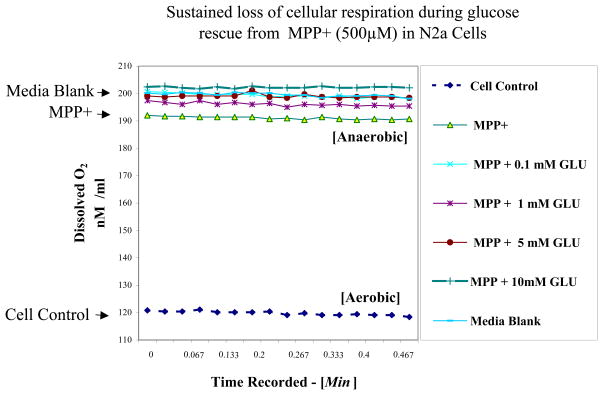
Figure 2.
Oxygen electrode raw data chart recording of dissolved O2 in the media matrix blank vs. N2a cell supernatant ± [MPP+ 500 μM] with variation in additional glucose (0.1 –10 mM) in low glucose DMEM (1000 mg /L). The data represent dissolved O2 (nM / ml at 37.5°C) in one sample set, and all groups were statistically different from cell controls determined by a one–way ANOVA followed by a Tukey post hoc test n=4 * p<0.05.

