

Abstract
Pluripotent cells can be derived from various types of somatic cells by nuclear reprogramming using defined transcription factors. It is however unclear whether human cancer cells can be similarly reprogrammed and subsequently terminally differentiated with abrogation of tumorigenicity. Here, using sarcomas we show that human derived complex karyotype solid tumors: (1) can be reprogrammed into a pluripotent-like state as defined by all in vitro criteria used to define pluripotent stem cells generated from somatic cells; (2) can be terminally differentiated into mature connective tissue and red blood cells; and (3) terminal differentiation is accompanied with loss of both proliferation and tumorigenicity. We go on to perform the first global DNA promoter methylation and gene expression analyses comparing human cancers to their reprogrammed counterparts and report that reprogramming/differentiation results in significant epigenetic remodeling of oncogenes and tumor suppressors; while not significantly altering the differentiation status of the reprogrammed cancer cells, in essence de-differentiating them to a state slightly before the mesenchymal stem cell differentiation stage. Our data demonstrates that direct nuclear reprogramming can restore terminal differentiation potential to human derived cancer cells, with simultaneous loss of tumorigenicity, without the need to revert to an embryonic state. We anticipate that our models would serve as a starting point to more fully assess how nuclear reprogramming overcomes the multitude of genetic and epigenetic aberrancies inherent in human cancers to restore normal terminal differentiation pathways. Finally, these findings suggest that nuclear reprogramming may be a broadly applicable therapeutic strategy for the treatment of cancer.
Introduction
The nucleus of somatic cells can be “reprogrammed” to exhibit embryonic stem cell-like pluripotent differentiation properties by various means (1). More recently nuclear reprogramming of somatic cells using defined transcription factors, commonly referred to as direct reprogramming (2, 3) (i.e. Oct4, Sox2, Klf4 and c-Myc or Oct4, Sox2, Nanog, and Lin28) has transformed interesting biology into a revolutionary technology that is being rapidly exploited for cell transplantation and tissue engineering purposes (4). Several cancer cell lines (5–8) have been similarly reprogrammed to varying degrees at least as defined by some combination of expression of genes specific to undifferentiated embryonic stem cells (ESCs) and pluripotency as defined by embryoid body formation in vitro, teratoma formation in vivo, and early markers of commitment to various differentiation lineages (2, 3).
Although greatly advancing the field, previous work has not directly addressed the critical question as to whether human cancer cells can be reprogrammed and subsequently terminally differentiated with concomitant abrogation of tumorigenicity. Since previous reports describing direct reprogramming of cancer either used cell lines of mouse origin (e.g., melanoma R545 (6, 9, 10), embryonic carcinoma P19 (11)) and/or not assayed for terminal differentiation (e.g., chronic myeloid leukemia KBM7 (5), colorectal carcinoma Dld1 (8)) the implications of reprogramming human cancer cells in terms of their ability to both achieve the terminally differentiated state, and the latter’s potential to irreversibly abolish tumorigenicity remains unexplored.
Here, using defined factors, we show that direct reprogramming of multiple characteristic, complex karyotype sarcomas of varying etiological lineages is feasible and allows for recapitulation of terminal differentiation into varied connective tissues as well as mature red blood cells with cessation of tumorigenicity. We further go on to explore the genetic and epigenetic basis of direct cancer reprogramming.
Results
Direct Reprogramming of Sarcomas
Since our primary objective was to elucidate whether or not it is possible to reprogram cancer cells into a state from which terminal differentiation is achievable, and not knowing a priori: (1) whether this is feasible; and (2) which transcription factors would be necessary (and at which levels) and/or sufficient, we sought to introduce all six previously identified reprogramming transcription factors into five sarcoma cell lines. Pooled supernatant derived from lentivectors expressing cDNAs of human Oct4, Nanog, Sox2, Lin28, Klf4, c-Myc (12, 13) were used to infect human osteosarcoma cells (SAOS2, HOS, MG63), human liposarcoma cells (SW872), and human sarcomas of unknown lineage (i.e., Ewing’s sarcoma SKNEP). The frequency of reprogrammed-sarcoma formation ranged from 1–5% and the time to initial formation ranged from 18–42 days (Supplemental Figure 1). Our reprogramming efficiency is slightly higher than those reported for somatic cell reprogramming and may be due to pre-existing tumor suppressor loss (7). In agreement with our previous gene expression data on these cell lines (14, 15), all five ‘parental’ sarcoma cell lines expressed Myc and Klf4 (Figure 1 and Supplemental Figure 2); while reprogrammed-sarcomas silenced the transgenes while reactivating the corresponding endogenous genes after full reprogramming (Figure 1, Supplemental Figure 3B). All reprogrammed-sarcomas also expressed standard human pluripotent markers (e.g., Tra-1–81 and SSEA4 (Figure 1A–E), Rex (Supplemental Figure 3), and alkaline phosphatase (Supplemental Figure 4). Reprogrammed-sarcomas were also able to undergo Activin A (50ng/ml) Noggin (100ng/ml) directed differentiation into endoderm and ectoderm respectively (Figure A–E). In contrast, reprogrammed cells showed no evidence of ‘spontaneous’ differentiation (i.e., when cultured in the absence of Activin A or Noggin) along the ectodermal or endodermal lineages (Figure 1(a–e)-v left panel). As controls, parental cells showed no spontaneous or Activin A or Noggin mediated differentiation (data not shown).
Figure 1.
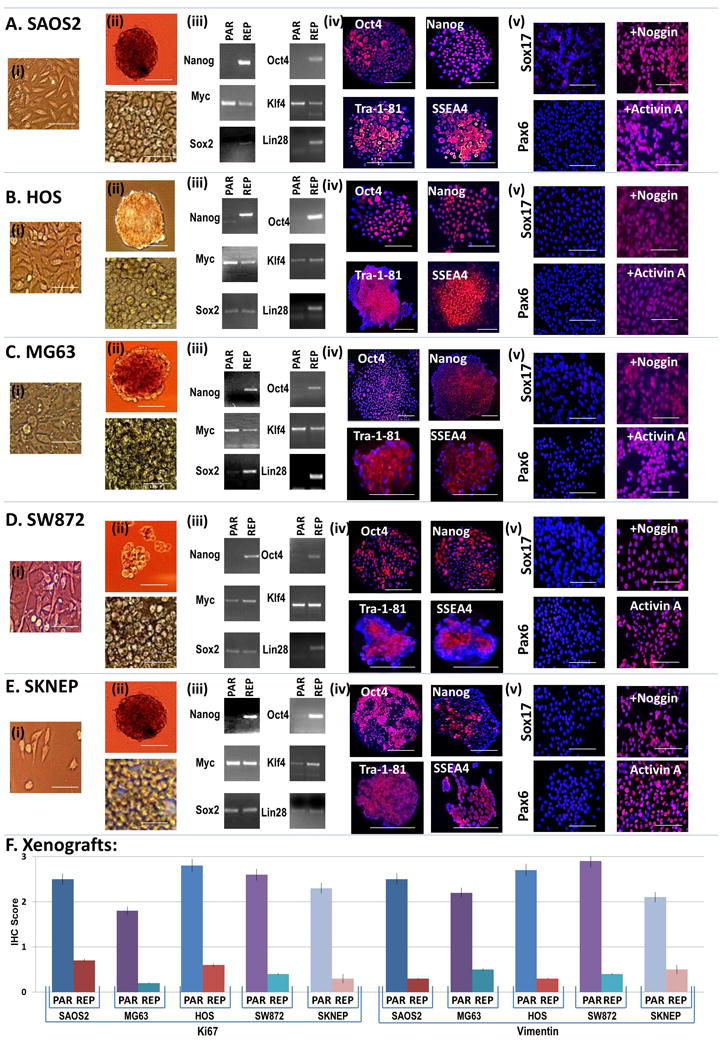
Characterization of reprogrammed-sarcomas as compared to parental sarcomas: (A–E) (i) parental cell in culture (scale bar=50um), (ii-top) embryoid body formation (scale bar=500um); (ii-bottom) reprogrammed cells in culture (scale bar=50um), (iii), expression via RT-PCR of reprogramming transcription factors in parental (PAR) and reprogrammed (REP) sarcomas; (iv) ESC markers via immunofluorescence in reprogrammed cells, and lineage directed differentiation (via Activin A (50ng/ml) or Noggin (100ng/ml) directed differentiation into endoderm and ectoderm respectively; (scale bar=500um); (v) morphologically and via expression of lineage specific markers (e.g., Sox 17 - endoderm, Pax6 ectoderm) (scale bar=50um). All cells were grown on matrigel. (F) Quantification of Ki67 and vimentin immunohistochemistry of xenografts from parental and reprogrammed cells as seen in Supplemental Figure 5.
We next assessed the in vivo tumorigenicity of the reprogrammed sarcomas. One million parental sarcoma cells and one million of the reprogrammed sarcomas were injected into the left and right anterior tibialis muscle of NOD-SCID-gamma (NSG) mice, respectively, and observed. As per our previous reports (14, 15) in which we described the properties of these cell lines in detail, parental sarcomas formed tumors at the 8–10 week point and all mice were sacrificed when the largest of the two forming tumors (either parental or reprogrammed-sarcomas) reached 1cm in greatest dimension. In all cases (eight mice per sarcoma-type) both the parental and their reprogrammed counterparts formed tumors, but the parental sarcomas formed tumors at a faster rate than their reprogrammed counterparts. Xenografts that arose from reprogrammed-sarcomas (a) were approximately half the size of the xenografts formed from parental cell lines; (b) were associated with necrosis which was not observed in the parental cells; (c) were less densely packed with tumor cells as compared to parental controls; (d) stained less frequently for Ki67 than parental cell lines; and (e) expressed less vimentin (a definitive mesenchymal marker) than their parental counterparts (Figure 1F and Supplemental Figure 5 and 6). As we have previously observed (15) most sarcoma cell lines (including the ones used here) form undifferentiated sarcomas when grown as xenografts regardless of initial histopathology. Although pathologically the reprogrammed sarcomas still best resemble undifferentiated sarcomas, it is important to note that the histopathological pattern shown by reprogrammed sarcomas (i.e., less vimentin expression than their reprogrammed counterparts without morphological indications of differentiation or expression of other lineage markers - pan-cytokeratin/epithelial, S100/melanocyte, and neurophysin/neuroendocrine were all negative in both parental and reprogrammed cells (data not shown) is pathologically consistent with a shift towards a less differentiated state. Despite all this evidence we cannot absolutely rule out the possibility that a transition from a high grade sarcoma to a malignant teratoma or embryonal carcinoma has occurred. However given that no benign mature tissue elements were observed, we can conclude that a benign teratoma (as would have been expected for reprogrammed-somatic cells) did not form. “Teratoma” formation from solid human cancer cells has been alluded to previously (8), but reported only as xenograft formation with no histology or immunohistochemistry presented. Thus it remains unclear whether or not human solid tumor cells can be reprogrammed into cells capable of dedifferentiating and forming benign teratomas. Regardless our results clearly show that direct reprogramming decreases the aggressiveness of cancer (as measured by growth/size/cellularity) as compared to its parental counterpart and additionally induces a loss of mesenchymal lineage markers suggesting a concurrent loss of differentiation.
Reprogrammed-Sarcomas Differentiate Into Multiple Mature Connective Tissue Phenotypes
We next assessed if reprogrammed sarcomas can be terminally differentiated either into the lineage in which they were initially blocked (e.g., osteosarcoma into osteocytes) or into an alternate lineage (e.g., osteosarcomas into adipocytes; a lineage switch) by growing all reprogrammed-sarcomas in either osteogenic or adipogenic differentiation medium. Since terminal differentiation is defined as BOTH expression of the mature phenotype and terminal cell division (i.e., cessation of proliferation) we assessed both these properties in all five reprogrammed-sarcomas and in two differentiation lineages. As seen in Figure 2, reprogrammed-sarcomas (but not the parental cells) in the presence of either adipogenic or osteogenic differentiation medium express the terminal phenotype of that differentiation lineage (i.e., either bone formation as measured by calcium mineralization via Alizarin Red-S or fat formation as measured by lipid accumulation via Oil-Red-O; considered “gold standards” (16–18) for terminal differentiation of embryonic and mesenchymal stem cells into bone and fat respectively). In both cases the mature phenotype is accompanied by cessation of proliferation as measured by loss of Ki-67 staining (Figure 2) and by standard proliferation assays (Supplemental Figure 7) in only the differentiating reprogrammed-sarcomas. Interestingly, reprogrammed-sarcomas do not regain Ki67 staining or show signs of further growth following four weeks in replacement of differentiation medium with maintenance medium (data not shown). In agreement with the latter, no tumors formed upon subcutaneous inoculation of the entire cell culture obtained from differentiated reprogrammed-sarcomas in to NSG mice and followed for up to 16 weeks (Supplemental Figure 8). Taken together, we conclude that terminal differentiation of reprogrammed-sarcomas can abrogate the tumorigenicity of the parental sarcoma cells.
Figure 2.

(A–E) Comparison of sarcomas and reprogrammed-sarcomas in terms of achieving terminal differentiation as measured by acquisition of the terminal phenotype (both bone via Alizarin Red S staining for calcium deposition and fat via Oil-Red-O staining for lipid accumulation) AND cessation of proliferation via loss of Ki67. (F) MSCs differentiated as controls into bone and fat. (Oil-Red-O images are magnified 10-fold to accentuate lipid formation associated with each cell). Scale bars=10um.
Reprogrammed-Sarcoma Differentiate Into Hematopoietic Cells
We further sought to examine if the terminal differentiation potential of the reprogrammed-sarcomas was restricted to connective tissue lineages or whether reprogrammed-sarcomas had broader differentiation potential. Thus we differentiated reprogrammed-sarcomas along the erythroid lineage by employing an ESC-to-erythroid differentiation protocol (19, 20). In each case, the cells undergo a significant-fold reduction in cell size: starting with parental sarcoma cells having fibroblastic appearance measuring approximately 25um in diameter (Figure 3A, first panel); to reprogrammed sarcoma cells having a more rounded appearance and measuring approximately 20um in diameter (Figure 3A, second panel); and to differentiated erythroid cells measuring approximately 8um in greatest dimension (Figure 3A, most right panel). The volume reduction from a diameter change of 25um to 8um, assuming a fully spherical shape (and therefore a function of the radius cubed), suggests a 30 fold reduction in volume. Volume reduction is accompanied by obvious morphological changes from fibroblastic to hematopoietic appearing cells accompanied with loss of cell adhesion (Figure 3A,B). Additionally, characteristic pro-erythroblastic cells were seen, many on the verge of enucleation (Figure 3B). Finally, we performed a hematopoietic cell surface antigen analysis as a function of time. Our data indicates that CD71 and CD36 both peak during the mid-phase of our differentiation protocol, a point of differentiation at which the majority of cells are CD235 (GPA) negative, consistent with that previously shown for normal ESC to erythroid differentiation (19, 20). This specific profile is most consistent with erythroid colony formation units (CFU-Es; CD36+/CD71+/CD235a(GPA)−)(21). However, upon further differentiation both CD71 and CD36 decline and CD235a(GPA) positive cells appear (Figure 3C). We further validated these results by performing immunofluorescence for both CD71 and CD235a both at Day 14 and at Day 28 of the erythroid differentiation time course. As see in Figure 3D at day 14 most cells are CD71 positive, but lose CD71 expression by day 28. In contrast, only rare CD235a(GPA) expressing cells can be observed at day 14, however at day 28 three distinct populations of cells can be identified: CD235a+/DAPI+ (green circle); CD235−/DAPI+ (blue circle); and CD235a+/DAPI− (yellow circle). The latter indicates enucleated mature red blood cells. Taken together, our differentiation results using reprogrammed-sarcomas and specifically the prevalence of CFU-Es with rare mature cells are identical to those for ESCs cultured along the erythrocytic lineage differentiation (19, 20, 22). Additionally, as above, no tumors formed upon intramuscular or subcutaneous inoculation of the entire cell culture obtained from erythroid differentiated reprogrammed-sarcomas in to NSG mice and followed for 16 weeks (Supplemental Figure 9).
Figure 3.

(A) Morphological comparison of sarcomas, reprogrammed sarcomas, and reprogrammed sarcomas at days 7, 14, 21 and 28 of an erythroid differentiation protocol. Scale bars=10uM. (B) Individual cells on the verge of enucleation from day 28 erythroid differentiation cultures. Scale bars=5uM. The original magnification for all panels in A were x200; and x1000 for B. (C) Percentage of cells from HOS, SW872, SKNEP, Rep-HOS, Rep-SW872, and Rep-SKNEP cultures undergoing erythroid differentiation expressing CD71, CD235a (GPA), CD36, and CD34. Error bars=standard deviation. (D) CD71 and CD235(GPA) immunofluorescence in reprogrammed SW872 cells after 14 and 28 days of erythroid differentiation. green circle=CD235a+/DAPI+; blue circle=CD235−/DAPI+; yellow circle=CD235a+/DAPI−. Scale bars=10um.
Epigenetic Silencing of Oncogenes
Our results suggest that direct reprogramming can supersede the specific genetic and/or epigenetic changes that resulted in the lineage specific differentiation block and subsequent tumorigenesis. To explore the relationship between reprogramming and the epigenetics of oncogenes we focused on myc since: (a) it is expressed at baseline in all of our sarcoma cell lines (Figure 1); (b) it was further introduced as part of the reprogramming process and its expression did not change upon reprogramming (Figure 1); (c) it is an established oncogene prognosticating poor outcomes in sarcoma patients (23); and (d) myc levels were found to decline dramatically after reprogrammed-sarcomas were differentiated, not merely reprogrammed (Figure 4A).We have confirmed these semi-quantitative RT-PCR results using quantitative PCR (Supplemental Figure 10). Thus our data shows that differentiation following direct reprogramming is accompanied by myc down-regulation and suggested to us that epigenetic changes at the myc promoter may change during the reprogramming process in order to become amenable to transcriptional down-regulation during differentiation.
Figure 4.

(A) Myc RT-PCR in parental and reprogrammed sarcoma cells following three weeks in either maintenance (control), adipogenic (fat) or osteogenic (bone) differentiation medium. Chromatin immunoprecipitation of the myc promoter using anti-H3K4triMe (B) or anti-HEK27triMe (C) antibodies in either maintenance (control), adipogenic (fat) or osteogenic (bone) differentiation medium. (D) DNA-promoter methylation analysis showing all statistically differentially methylated promoters (T-Test p<0.05). (E) Percentage of tumor suppressor gene (TSGs) and oncogene promoters accounting for all differentially expressed promoters (T-Test p<0.05) plotted as a function of fold change. (F) Unsupervised hierarchical clustering of sarcomas and their reprogrammed counterparts using all statistically differentially methylated promoters (T-Test p<0.05).
We assessed the epigenetic status of the myc promoter in parental sarcomas and reprogrammed-sarcomas using chromatin immunoprecipitation to assess for active, H3K4triMe, and repressive, H3K27triMe marks (24, 25). We observed that in parental sarcoma cell lines the myc promoter is H3K4triMe modified - consistent with an active state; while in reprogrammed-sarcomas the myc promoter is H3K4triMe and H3K27triMe modified (Figure 4B) consistent with a bivalent state (24, 25) characteristic of many stem cell genes that exist in a ‘poised’ state (25–27) that is amenable to being rapidly activated or repressed by removal of the appropriate modification. Furthermore, the H3K4triMe active mark is indeed lost as reprogrammed-sarcoma cells undergo adipogenic and osteogenic differentiation (Figure 4B). Thus our data shows that reprogramming sarcomas results in an epigenetic change in the myc promoter in which it becomes permissive to being silenced, but only becomes silenced with subsequent differentiation. It is noteworthy that the reprogramming epigenetic patterns of the myc promoter as observed in reprogrammed sarcoma cells before and after differentiation are identical to those observed in normal MSCs before induction of and during osteogenic and adipocytic differentiation (24).
As for histone modifications, changes in DNA-methylation are characteristic of late nuclear reprogramming (28, 29) and tumorigenesis. Cancer has been described as globally DNA hypomethylated, oncogene promoter DNA hypomethylated and tumor suppressor promoter DNA hypermethylated (30). Interestingly, nuclear reprogramming of somatic cells is associated with similar patterns (31); however DNA methylation patterns in reprogrammed cancer cells have not been examined. We examined global DNA-methylation changes in sarcomas and their reprogrammed counterparts using Infinium HumanMethylation27 arrays (Supplemental Table 2). Cancer reprogramming was accompanied by global DNA demethylation (Figure 4D). In fact of the 216 CpG islands (corresponding to 205 gene promoters) demonstrating a 15% change in DNA promoter CpG methylation (p<0.05, paired T-Test; Supplemental Table 3) only one promoter (cg17133183; 1.1968464 up) corresponding to CRABP1 (cellular retinoic acid binding protein 1) showed an increase in methylation. Interestingly of these 205 gene promoters showing significant changes in CpG methylation only 29 unique genes (37 Affymetrix IDs; Supplemental Table 4) showed significant changes (p<0.05, paired T-Test) at the gene expression level (please see next section). 25 of the 37 (67%) Affymetrix IDs showed an increase in gene expression levels (Supplemental Table 4 and Supplemental Figure 12) suggesting that promoter hypomethylation accompanying reprogramming results in an increase in overall gene expression of those genes. We further confirmed the gene expression changes obtained via microarray expression data by performing quantitative RT-PCR for 26 of the 29 genes. With only occasional exceptions in some cell lines (i.e., MPZL1, IMP4, & FBLIM1) 23 of the 26 genes showed an increase in gene expression in reprogrammed as compared to their parental counterparts (Supplemental Figure 18); including three tumor suppressor genes (DNTM3a, HOOK3, and JAK2; and one oncogene TOML1; please see next section) thus reaffirming that a decrease in promoter DNA methylation correlates to an increase in gene expression (when gene expression changes are observed). However, given that 205 promoters were identified as hypomethylated and only 23 genes showed a definitive increase in gene expression, our data suggests that (as demonstrated for the myc promoter above) changes in DNA methylation are not sufficient to result in changes in gene expression for the majority of genes.
Since reprogramming of sarcomas resulted in global hypomethylation and restoration of differentiation potential, we were particularly curious as to how reprogramming affects promoter DNA methylation of oncogenes and tumor suppressor genes (TSGs). We obtained large gene lists of both oncogenes and TSGs (downloaded from http://cbio.mskcc.org/CancerGenes (32); Supplemental Tables 5&6) and overlapped these lists with all 1241 promoters whose degree of methylation was significantly changed by direct reprogramming (p<0.05, paired T-Test; no restriction on fold change, Supplemental Table 7 as opposed to the analysis above which was restricted to a 15% fold change shown as Supplemental Table 3). Using this approach, 82 TSGs and 32 oncogenes were identified (Supplemental Tables 8&9) accounting for 7.1% and 3.2%, respectively, of the genes affected by DNA methylation. As expected since the vast majority of genes were hypomethylated, all oncogenes and TSGs affected by DNA methylation were also hypomethylated as a result of reprogramming. The observation that oncogenes were hypomethylated is not surprising as during somatic reprogramming and tumorigenesis, oncogenes are known to be hypomethylated. However, in contrast to somatic reprogramming and tumorigenesis, which would have predicted that TSGs should have been silenced (via DNA hypermethylation); our observations that TSGs are also hypomethylated suggests that there may be significant differences in epigenetic control between reprogrammed cancer and somatic cells. Furthermore, since many of our cell lines are deleted for specific tumor suppressor genes (Supplemental Table 1), we feel that this data may under-represent the actual difference in epigenetic control during reprogramming between somatic and cancer cells at tumor suppressor loci. To pursue the association between reprogramming and TSG and oncogene DNA hypomethylation, we examined the relationship between the frequency of oncogenes and TSGs as a function of DNA methylation fold change. As seen in Figure 4E, the percentage of TSGs and oncogenes accounting for all genes that undergo a given fold change (p<0.05 paired T-Test), increase as the fold change threshold increases. Note that for both the oncogene and TSG curves, R2 (the coefficient of determination; i.e., the proportion of variability in a data set that is accounted for by the statistical model and capable of predicting future outcomes) approaches the ideal of 1. Or in other words, the subset of genes with the greatest change in gene promoter DNA methylation between the sarcomas and their reprogrammed counterparts actually occurs at oncogenes and tumor suppressors. This is the first report of a global DNA promoter methylation analysis comparing human cancers to their reprogrammed counterparts.
Lastly we performed unsupervised hierarchical clustering (a bio-informatic approach that allows self-organization based on similarities in gene expression using predefined genes) using the 216 CpG island set demonstrating a 15% change in DNA promoter CpG methylation (p<0.05, paired T-Test; Supplemental Table 3) on the five sarcomas, their reprogrammed counterparts, and human MSCs (hMSCs). As seen in Figure 4F: (1) all reprogrammed sarcomas (with the exception of Rep-HOS) cluster together; (2) all parental sarcomas cluster together; (3) parental HOS and reprogrammed HOS cluster together as well (most likely since many of the genes hypomethylated during reprogramming appear already hypomethylated in HOS); (4) methylation is higher in each parental sarcomas (red on the heat map) as compared to its reprogrammed counterpart (blue on the heat map) in agreement with the data presented as averages in Figure 4D; (4) and potentially most interesting is that reprogrammed sarcomas exhibit a methylation state that is much closer to hMSCs than to sarcomas (note that many of the genes hypomethylated during reprogramming are hypomethylated in hMSCs, blue on the heat map). The latter suggests that reprogramming of sarcomas results in an epigenetic state (at least partially) similar to hMSCs.
Degree of differentiation reversion following direct reprogramming
One of the many unsettled issues in the field of reprogramming is the degree of differentiation reversion. How far back does a somatic cell need to be de-differentiated before it is possible to re-differentiate it along an alternate lineage? What about a cancer cell? The presumption is that reprogramming recapitulates the ESC state as shown by acquisition of functional pluripotency and ESC-markers. To assess if this was similarly true for reprogrammed cancer cells, we performed gene expression analysis of our sarcoma and reprogrammed-sarcomas and compared them to known gene expression patterns for ESCs (GSE6561), mesenchymal stem cells (GSE6460), fibroblasts (GSE9865), reprogrammed fibroblasts (GSE9709), partially reprogrammed fibroblasts (GSE9865) and reprogrammed-sarcomas. We limited our analysis to a discriminatory 50 gene set (33), previously used to differentiate between mouse ESCs, mouse embryonic fibroblasts, and reprogrammed fibroblasts (Supplemental Table 10). Performing unsupervised hierarchical clustering using the above gene set reveals that reprogrammed-sarcomas associates most closely with sarcomas and partially reprogrammed fibroblasts (Figure 5A) and not with the fully reprogrammed state (as defined via the clustering group of ESCs and reprogrammed fibroblasts).
Figure 5.

(A) Unsupervised hierarchical clustering using a gene set representing ANOVA between ESCs, reprogrammed fibroblasts, partially reprogrammed fibroblasts, reprogrammed sarcomas, sarcomas, fibroblasts and MSCs. (B) Scatter plot analysis showing differences in gene expression between indicated cell types. red box=comparison between sarcomas and rep-sarcomas, blue box=comparison between ESCs and sarcomas; green box=comparison between ESCs and rep-fibroblasts. (C) Unsupervised hierarchical clustering of sarcomas and their reprogrammed counterparts using all statistically differentially expressed genes between sarcomas and their reprogrammed counterparts (paired T-Test p 0.05; 1.5 fold change). (D) Schematic representation of a primary component analysis (accounting for 100% of all genes representative of an ESC-MSC-fibroblast analysis; please see text for details) showing relative relations of indicated samples as a “differentiation” axis. (E) Model of degree of cancer reprogramming and subsequent differentiation (please see Discussion for details).
Having observed that reprogrammed sarcomas associates most closely with sarcomas and partially reprogrammed fibroblasts we further enquired as to which genes (out of the entire genome) best discriminate between these states. To simultaneously analyze gene expression of multiple groups we used analysis of variance (ANOVA) to identify a subset of genes that was able to discriminate among ESCs, MSCs, fibroblasts, reprogrammed fibroblasts, partially reprogrammed fibroblasts and reprogrammed-sarcomas (Supplemental Table 11) and examined the differences in gene expression data sets between each two of the five groups. As seen in Figure 5b (red outlined), sarcomas and reprogrammed-sarcomas share the most homology (i.e., expressing the least divergence from the diagonal); while all comparisons to the ESC (e.g., ESCs compared to sarcomas, blue outline) and the four other sub-types shows large deviations from the diagonal. It is worth pointing out that ESCs and reprogrammed fibroblasts (green outline) are fairly convergent (i.e., showing a lesser degree of divergence from the diagonal than any other comparison to the ESC state). In fact a paired T-Test (p 0.05; 1.5 fold change) comparing sarcomas to their reprogrammed counterparts identified only 125 differentially expressed unique genes (169 Affymetrix IDs; Supplemental Table 12). However, unlike the unsupervised hierarchical clustering based on DNA methylation (Figure 4F) which demonstrated global hypomethylation in the reprogrammed state, unsupervised hierarchical clustering based on this gene set did not result in an obvious one sided shift (i.e., towards hypomethylation and thus a predicted increase in global gene expression). In fact this analysis identified two distinct gene sub-groups (Figure 5C) in which approximately half of the 125 genes increase their expression (red-colored) and half decrease their expression (blue-colored) as a function of reprogramming. This is the first report of a global gene expression analysis comparing human cancers to their counterparts reprogrammed via defined factors. Although several cancer cell lines (5–8) have been previously reprogrammed by different means, the degree of differentiation reversion following reprogramming has never been directly assessed. Our data here (from Figure 5A) suggests that cancer reprogramming does not result in the pluripotent state via gene expression; albeit still allowing for attainment of terminal differentiation into multiple previously blocked lineages.
Principal component analysis (PCA) identifies genes that are uniformly changing or uniquely different in various known subgroups thus allowing those subgroups of genes to uniquely identify certain states. Extrapolation of gene expression change between states and the ordering of states to reflect normal biology allows the creation of a roadmap onto which other states may be mapped. We have previously used principal component analysis (PCA) to evaluate degrees of cancer differentiation in comparison to normal differentiating cells or cells representative of various differentiation stages(24); analogous to that recently described for ESCs and iPSCs (34). The latter analysis hypothesizes that a highly representative component of the PCA would align the samples along a differentiation axis. To first establish such a differentiation axis we first performed ANOVA using gene expression profiles from ESCs, MSCs, and fibroblasts (from above) to identify differentially expressed genes between the three states (Supplemental Table 13) which we hypothesized represent three stages along a mesodermal differentiation spectrum. We then performed PCA using gene expression profiles for ESCs, rep-fibroblasts, rep-sarcomas, MSCs, sarcomas, and fibroblasts. To be further unbiased we allowed for only one component to the PCA to be identified thus ensuring that all differentially identified genes between the three states would be used to assign the above groups to the differentiation axis. In Figure 5D, we observe that (1) ESCs and fibroblasts were at opposite ends of a putative differentiation spectrum; (2) reprogrammed fibroblasts were close to ESCs, (3) sarcomas fall in between mesenchymal stem cells (MSCs) and fibroblasts (as per our previous data in which we assigned differentiation stages to sarcomas using gene expression profiling (24, 35)); and (4) reprogrammed-sarcomas fall on the ESC side of MSCs in between MSCs and partially reprogrammed fibroblasts (Figure 5D). Taken together this data suggests that reprogramming sarcomas does indeed dedifferentiate them to a pre-MSC state (closer to ESCs; red arrow Figure 5D). However in direct comparison to the differentiation change undergone by reprogrammed fibroblasts which are reprogrammed to the ESC state (blue arrow, Figure 5D), the differentiation change undergone by sarcomas only reverts them to a pre-MSC state. Taken together our data would suggest that sarcomas are reprogrammed to a differentiation state that best resembles partially reprogrammed fibroblasts. Yet it is important to note that this partial reprogramming appears to be enough to re-establish the ability to achieve terminal differentiation in multiple lineages. This observation leads us to suggest that small, albeit specific changes in epigenetics and genetics might be sufficient in order to change non-differentiable tumor into one that is amenable to terminal differentiation (Figure 5E and see discussion).
Discussion
Here, using sarcomas as proof-of-principle, we show that: (1) human derived complex karyotype solid tumors can be reprogrammed into a pluripotent state as defined by all in vitro criteria used to define pluripotent stem cells generated from somatic cells(2, 3); (2) reprogrammed-sarcomas can be terminally differentiated into mature connective tissue and red blood cells; and (3) terminal differentiation of reprogrammed-sarcomas irreversibly abolishes their tumorigenic potential as measured by the ability to further proliferate in vitro or form xenografts. We then perform the first global DNA promoter methylation and gene expression analyses comparing human cancers to their reprogrammed counterparts and show that (1) reprogramming is associated with epigenetic remodeling of the myc promoter (from an active to bivalent marking) resulting in a chromatin permissive state in which silencing by external signaling (i.e., differentiation signaling) is possible; (2) reprogramming results in global DNA hypomethylation as well as both oncogene and tumor suppressor gene hypomethylation; and (3) reprogramming of sarcomas does not significantly alter the differentiation status of the reprogrammed cells, in essence de-differentiating them to a state slightly before the MSC. To the best of our knowledge this is the first demonstration that bestowing aspects of pluripotentiality to human derived cancer cells results in their ability to achieve the terminally differentiated state both in an alternative lineage as well as the lineage in which they were originally blocked with a simultaneous abrogation of tumorigenicity.
Previously nuclear reprogrammed human cancer cells (5, 8) have never been tested for their ability to achieve the terminally differentiation state or its implications on abolishing tumorigenicity. Although arguably the formation of viable mouse chimeras from reprogrammed cancer cells would be an ideal gold standard and masterfully used for such purposes previously (i.e. mouse melanoma R545 (6, 9, 10), the approach is limited to cancer cell lines of non-human origin whose approximation to the human condition is not always exact. Thus we would proceed with caution in simply extrapolating the sufficiency of nuclear reprogramming and viable chimera formation using mouse derived cancers as ‘proof’ that human cancers have similar potential in the absence of direct terminal differentiation data using human models as provided here. Furthermore, for somatic cells it has been clearly demonstrated that there is an indirect relationship between cellular differentiation and iPSC frequency (i.e., less differentiated, higher iPSC frequency (2, 36–42). Yet for cancer cells question of differentiation status relative to the feasibility of iPSC formation has not been addressed. We believe that as predicted by the “cancer stem cell” theory, a differentiation hierarchy exists even in cell cultures and thus we are currently pursuing the hypothesis that the most undifferentiated component in the cell culture may be the one that is most permissive to reprogramming.
Perhaps the most striking conclusion is that reprogramming of cancer cells results in the ability of the cancer cells to re-engage and terminally execute normal cellular differentiation pathways with consequent loss of tumorigenicity. All five sarcoma cell lines used are complex karyotype sarcomas derived initially from patients and established, commercially available, and highly stable in cell culture (Supplemental Table 1). They have innumerable degrees of genetic level damage and yet upon iPSC-based reprogramming all the inherent genetic level damage is ameliorated? We provide one possible explanation as to how oncogenes may be modified by the reprogramming process epigenetically in order to be responsive to external cues. However, how does a cell deal with deletions? One possible answer is that the cell upon reprogramming engages alternative signaling pathways to activate the final executors of terminal differentiation; this remains to be proven. An alternative explanation would be that the extensive genetic level damage in fact does not hinder global differentiation and therefore does not need to be corrected. The nuclear reprogrammed BCR-ABL expressing CML cell line KBM7 (5) is actually more resistant to imatinib therapy than the parental counterpart; and yet the reprogrammed KBM7 cells show a greater propensity to spontaneously engage (though not complete) cellular lymphoid differentiation(5). In fact the numerous recent publications clearly demonstrating that iPSC formation from somatic cells itself gives rise to pluripotent cells that have widespread degrees of multiple types of genetic (and epigenetic) aberrancies (43–47) but which are quite capable of terminally differentiating supports this concept. Finally, given that cancer cell lines often express some of these reprogramming factors at baseline levels equivalent to ESCs or iPSCs (as we show in Supplemental Figure 2) it is tempting to speculate that it may not be necessary to introduce all these genes and that cancer cell reprogramming may be possible with the introduction of much fewer genes than used herein. The concept that reprogramming cancer cells into full pluripotency may actually be simpler than reprogramming somatic cells is further strengthened by the fact that reprogrammed sarcomas (and even some sarcomas before reprogramming, e.g., HOS) exhibit a methylation state that is much closer to pluripotent hMSCs than to lineage restricted sarcomas.
Finally, a fair amount of recent work on the concept of somatic pre-iPSCs has recently been published (33, 48–50) describing a semi-stable (i.e. readily differentiable pluripotent state) that partially resembles the full iPSC state. The similarities to those reports and the nuclear reprogrammed sarcomas described herein, suggests that our reprogrammed cells may better be described as sarcoma-pre-iPSCs. We propose a model (Figure 5E) in which normal differentiation goes from a pluripotent state through multiple lineage restrictions resulting in cellular intermediates that are more and more limited in terms of differentiation potential until terminal differentiation results (Figure 5E; left panel). During tumorigenesis there is an accompanying loss of terminal differentiation; albeit cancer cells do retain some limited degree of differentiation ability ultimately accounting for tumor cellular differentiation and heterogeneity (Figure 5E, 2nd panel). When we had designed these experiments we initially hypothesized that in order to restore terminal differentiation to cancer cells we would have to reprogram them back to the ESC or totipotent state (Figure 5E, 3rd panel). However, our data indicates that reprogrammed sarcomas can be terminally differentiated along multiple connective tissue lineages without first being reprogrammed to the ESC state. This suggests that reprogramming sarcomas to an earlier pluripotent state (pre-MSC; as given by erythroid differentiation) is sufficient to restore terminal differentiation ability in at least some lineages (Figure 5E, right panel). We propose that as a treatment strategy, the latter being a differentiation prone, none-fully dedifferentiating state may be a more desirable intermediate for cancer therapeutic purposes than the fully reprogrammed state. Furthermore, since our initial question was: can cancer cells be reprogrammed? The necessity of introducing all six reprogramming transcription was not assessed. Given the recent data suggesting that it is possible to reprogram some cells with just one reprogramming factor, it is possible that we may not need all six. In fact given that all of our sarcoma cells express many of the reprogramming transcription factors at baseline and at levels equivalent to other iPSCs and ESCs (Supplemental Figure 2 and data not shown), the possibility of reprogramming our sarcoma cell lines with the minimal number of transcription factors is something we are actively pursuing in the laboratory.
There are multiple examples in the literature of cancer terminal differentiation ranging from the frequent (retinoids for APML (51) and PPAR agonists for liposarcomas (52)) to the infrequent (epigenetic agents (53)). Additionally, activation of specific pathways via the introduction of either upstream activators (24) or downstream lineage specific transcription factors (54) can under specific conditions and in specific cells result in lineage directed cancer differentiation that could potentially be better than with the reprogramming approach outlined herein. The potential limitation of these approaches is that a detailed understanding of the underlying cancer biology and a means to specifically modulate its differentiation along a given direction was necessary. Our reprogramming approach (as the somatic counterpart) might have the advantage that it may be promiscuous enough to work in any cancer type – although this remains to be formally tested.
More work needs to be done in the field to understand the consequences of bestowing pluripotentiality (even if partial) to cancer cells. However, we propose that the concept that a solid tumor can be changed from an aggressive cancer to enucleated red blood cells or other mature tissues with loss of tumorigenicity fosters the hope that similar approaches, once the biology is better understood, may be used therapeutically to treat cancer.
Materials and Methods
Cell Culture
Cell lines HOS, SAOS2, MG63, SW872, SKNEP, their growth conditions and properties have been thoroughly described by us(15) and Supplemental Table 1. Briefly, the following maintenance conditions were used: HOS: MEM-Alpha + 10% FBS; SAOS2: McCoys 5a Medium + 10% FBS; MG63: MEM + 10% FBS +1% NEAA; SW872: MEM + 10% FBS +1% NEAA; SKNEP: McCoy’s 5a Medium + 20% FBS. Reprogrammed cells were maintained in hESC medium: knockout DMEM (Gibco) supplemented with 20% knockout serum replacement (Gibco), 0.1mM beta-mercaptoethanol (Gibco), 10ng/ml bFGF (Invitrogen), 1x MEM non-essential amino acid solution (Hyclone 1x L-Glutamine), and 1x pen strep (Gibco). For MEF-dependent iPS cell culture, 6×10⁶ irradiated mouse embryonic fibroblast (Invitrogen) cells were plated to one 100mm plate, or 1.0×10⁶ cells to each well of six-well plates, and cultured in DMEM with 10% FBS. MEF cells were grown to confluence. To passage the cells, three hours prior to colony picking, the medium in MEF plates were changed to hESC cell growth medium. Colonies were manually picked and plated back on new MEF plates. For MEF-independent hiPSC culture, plates were coated with hESC-qualified matrigel (BD) overnight at 4°C. Two hours prior to colony picking, the matrigel plates were warmed to 37°C and MEF-conditioned hESC growth medium was added. Colonies were then manually picked and plated on matrigel plates for further expansion and differentiation (see below). For embryoid body formation colonies were collected and mechanically segregated into individual cells and further cultured on low adherence plates in regular hESC growth medium for 6~8days. Medium was change every other day by sedimentation.
iPSC infection and isolation
Supernatant of lentiviral vectors expressing human Oct4, Sox2, Nanog, Klf4, c-Myc, and Lin28(12, 13) under control of the human elongation factor-1 alpha promoter (EF1) titered in HEK293T cells and verified to contain at least 5 × 10⁸TU/ml were purchased from Open Biosystems (viPSTM Vector Kit). Supernatants of all six factors were pooled and used to transduce human sarcoma cell lines (HOS, SAOS2, MG63, SW872, & SKNEP). Specifically: the day before transduction, the sarcoma cell lines were plated at 100 cells per well in two 6-well plates in triplicate. Each cell line was maintained in its preferred growth medium(15). Four wells per plate were used for transductions with lentivirus stocks encoding the six pluripotency factors to generate iPS cells. One well was used for transductions with viPS-EF1-TurboGFP control lentivirus to assess transduction efficiency. One well was used as a “non-transduced” control. Cells were incubated for 16–18 hours. Approximately 2.5ul (amount varying according to virus conrentration) of each lentivirus stock (6 stocks for each of the 6 pluripotency factors; corresponding to a multiplicity of infection (MOI) of 10 per well) was resuspended in 1ml of corresponding sarcoma cell line medium and added to each well (which was aspirated immediately prior to this step). Cells were incubated for 24 hours. For wells transduced with viPS-EF1-TurboGFP control; cells were washed with PBS and monitored for GFP expression via fluorescent microscopy. For wells transduced with reprogramming factors; cells well were aspirated and transferred to 10cm plates with inactivated mouse embryonic fibroblasts (MEF; Invitrogen). Cells were thus maintained for an additional 3–4 days and then replated on MEFs at an approximate concentration of 10,000 cells/ml of hESC modified medium(55) as described above. Cells were subsequently observed for colony formation (spherical in shape with a more defined outer border and a translucent, light-refractive appearance compared to the surrounding MEFs) from 7–56 days with daily changes in hESC medium. Formed colonies were isolated and transferred to fresh MEF feeder plates and further maintained in hESC medium. Repeated passaging was performed manually using a hooked Pasteur pipette.
RT-PCR
Total RNA was extracted from the indicated cell lines using RNeasy RNA extraction kit (Qiagen) according to the manufacturer’s protocol. 1 μg of RNA was transcribed into cDNA using SuperScript III First Strand Synthesis System for RT-PCR (Invitrogen). To assess the expression levels of Oct4, Sox2, Nanog, Klf4, c-Myc, and Lin28 control semi-quantitative RT-PCR reactions containing Platinum Blue PCR mix (Invitrogen), 1ul cDNA and corresponding primers were run at the following PCR program: 94°C × 30s; 58°C × 30s, 72°C × 1m, for 36 cycles’ 72°C × 5m. Experiments were performed in triplicate. The following primers (all human): Oct3/4: GACAGGGGGAGGGGAGGAGCTAGG; CTTCCCTCCAACCAGTTGCCCCAAAC; Nanog: CAGCCCCGATTCTTCCACCAGTCCC;:CGGAAGATTCCCAGTCGGGTTCACC; c-Myc: GCGTCCTGGGAAGGGAGATCCGGAGC; TTGAGGGGCATCGTCGCGGGAGGTG; Sox2: GGGAAATGGGAGGGGTGCAAAAGAGG; TTGCGTGAGTGTGGATGGGATTGGTG; KLf4: TGATTGTAGTGCTTTCTGGCTGGGCTCC; ACGATCGTGGCCCCGGAAAAGGACC; Lin-28: CAAAAGGAAAGAGCATGCAGAA; ATGATCTAGACCTCCAGAGTTGTAGC.
Immunohistochemistry
Cells grown on matrigel were fixed with pre-chilled 50% methanol + 50% acetone for 10 minutes, washed with PBS three times and blocked in 10% normal goat serum (NGS; MP Biomedicals) with 2% BSA for 30 minutes. Rabbit polyclonal to Ki67 (Abcam) or vimentin (Santa Cruz) was added to cells in 10% NGS with 2% BSA and incubated overnight at 4°C. Cells were washed with PBS three times the following day and biotinylated anti-rabbit secondary antibody (Vector Laboratories) was added at 1:200 dilution in 10%NGS with 2%BSA. Cells were washed with PBS twice and PBS with 0.5%triton once. DAB solution (Sigma Fast 3,3-Diaminobenzidine Tablets) was added to cells for up to 1 minute. Hematoxylin was added for nuclear counterstain. Cells were further washed with water and ammonium and maintained in cold PBS. NIKON Eclipse 50i was used to visualize images. For fresh frozen paraffin embedded: Briefly, formalin-fixed, paraffin-embedded tissues were rehydrated and treated with citric buffer for antigen retrieval. Slides were blocked with 10% horse of goat serum in 2% BSA-PBS and then incubated in primary antibody (diluted in 2% BSA-PBS) overnight at 4°C. Following 30 minutes of secondary antibody and tertiary antibody (Vector Labs) incubation, slides were developed with 3,3-diaminobenzidine (DAB) and counterstained with Hematoxylin. For immunohistochemistry on cells: embedded xenografts (see below), fixation was performed with 50% Methanol/Acetone for 10 minutes, then blocking, primary antibody incubation, and detection was performed as for FFPE IHC. To quantitatively assess the qualitative immunohistochemical findings, three pathologists with significant sarcoma expertise (Carlos Cordon-Cardo MD PhD of Mt. Sinai Hospital and Fabrizio Remotti MD of Columbia University) independently scored all a minimum of three sections from each xenograft for percentage of positively staining cells for each marker. Hematoxylin and eosin was graded as percentage cellularity per visualized field. Averages of all were scores obtained and plotted.
Immunofluorescence
Cells grown on matrigel (as above) were fixed with pre-chilled 50% methanol + 50% acetone for 10 minutes, washed with PBS three times and blocked in 10% donkey serum (Jackson ImmunoResearch) with 2% BSA for 30 minutes. Primary antibodies Nanog, Oct4, SSEA4, Tra-1–81, CD71, CD235a, Pzx6, Sox17 (all from Abcam) were added to cells at 1:200 dilution in 10% donkey serum with 2% BSA and incubated overnight at 4°C. Cells were washed with PBS three times the following day and fluorescent secondary antibodies (Invitrogen, Alexa Fluor 594 donkey anti-rabbit IgG, Alexa Fluor 594 donkey anti-mouse IgG) or goat anti-rabbit Oregon Green 488 (for CD71, CD235a) were added to cells at 1:200 dilution in 10% NGS with 2%BSA. After 30 minutes of incubation in the dark at room temperature, cells were washed with PBS with 0.5% Triton X100 twice and mounted with mounting medium with DAPI (Vector Laboratories). NIKON Eclipse 50i was used to visualize cells.
Xenograft formation
For each graft, approximately 106 iPS cells were manually harvested, centrifuges for 5min at 1200rpm washed and resuspended in a 1.5 ml tube containing 300 μl hESC medium and then injected intramuscularly (tibialis anterior) into NOD SCID Gamma mice (Jackson Labs). Each parental and reprogrammed sarcoma cell line was injected in to both tibialis anterior muscles (i.e., one injection on each lower limb). Eight mice were used for each cell line. The experiment was repeated independently two times. Any visible tumors 4–8 weeks post-transplantation were dissected and fixed overnight with 4% paraformaldehyde/PBS solution. The tissues were then paraffin embedded, sectioned, stained with hematoxylin and eosin, and examined for the presence of tissue representatives of all three germ layers. All NOD-SCID-gamma mice were treated in accordance with IACUC Guidelines and Columbia veterinary policy as previously described(14). IRB protocol AAAD-1669; PI Matushansky.
Spontaneous Differentiation
Embryoid bodies, after 8 days of culture in hESC medium were transferred to 0.1% gelatin-coated plates and cultured in hESC growth medium (without bFGF) for 8 days(12, 13).
Ectoderm and Endoderm Differentiation
For ectoderm differentiation: cells were grown on matrigel, cultured in normal ESC growth medium, and then further supplemented with Noggin (100ng/ml, from Sigma) for four days(56). For endoderm differentiation: cells were grown on matrigel, cultured in normal ESC growth medium, and then further supplemented with Activin A (50ng/ml, from Sigma) for four days(57). Dose of Noggin and Activin A used was empirically determined as based on most potent lineage specific differentiation induction as measured via Sox17 and Pax7 immunofluorescence respectively.
Adipogenic and Osteogenic Differentiation
Reprogrammed sarcoma cells were grown on matrigel as described above to 50% confluence at which point medium was subsequently supplemented with bone differentiation (dexamethasone 10nM, β-glycerophosphate 5 mM, L-ascorbic acid 50 μg/mL, lithium chloride 10 mM; Sigma Aldrich) or fat differentiation media (dexamethasone 0.5 μM, isobutylmethylxanthine 0.5 μM, indomethacin 50 μM; Sigma Aldrich). Cells were further grown under such conditions for up to 28 days. Bone differentiation was assessed by Alizarin red (Sigma Aldrich) staining, and fat differentiation was visualized with Oil Red O (Sigma Aldrich) stain as previously described by us(24, 35).
Erythroid Differentiation and FACS analysis
Based on Lu et al(20). Specifically, reprogrammed sarcomas were grown on matrigel in ESC medium until colonies were visualized. Colonies were manually picked and single cell suspensions were generated and replated on ultra-low adherent plates (Corning). To form embryoid bodies, cells were further grown in serum free Stemline medium (Sigma-Aldrich) with + BMP-4 (50ng/ml; Sigma-Aldrich), VEGF (50ng/ml; R&D), basic fibroblast growth factor (20ng/ml; Invitrogen). Medium was refreshed with the addition of stem cell factor (SCF, 20ng/ml), thrombopoietin (20ng/ml) and FLT3 ligand (20ng/ml) (all from R&D). After 4 days, EBs were collected and dissociated with trypsin. A single cell suspension was formed via passing cells through a G21 needle and filtering through a 40-um filter. Cells were then resuspended in Stemline II medium and mixed with blast-colony growth (BGM) media at a concentration of 5×10⁵ cells/ml and replated in 100-mm ultra-low dishes. The cells were subsequently expanded in BGM (a semi-solid growth media: 1% methylcellulose in IMDM, with 0.1mM beta-mercaptoethenol, VEGF 50ng/ml, BMP-4 50ng/ml, IL-3 20ng/ml, IL-6 20ng/ml, Epo 5U/ml, Tpo 50ng/ml, SCF 50ng/ml, CSF 20ng/ml, FGF-2 20ng/ml, insulin 10ug/ml, & FLI3 50ng/ml). The cultures were expanded for 6–8 days in BGM until the appearance of grape like clusters (see Figure 3A-Day 7 panel). The blast cells were then transferred into 150-mm Petri dishes with Stemline II-based medium containing SCF (100ng/ml), Epo (3units/ml) and 0.5% methycellulose. The cells were split at a ratio of 1:3 when they reached confluence for maximum expansion. Cells were diluted in 5 volumes of IMDM+0.5%BSA, and collected by centrifugation at 1000g for 5mins. The cell pellets were then washed twice with IMDM+0.5%BSA and plated in tissue culture flasks overnight to allow non-erythroid cells to attach. The non-adherent cells were then collected by brief centrifugation. For further maturation, the cells were then plated in StemPro-34 SCF (Invitrogen) medium containing SCF (100ng/ml) and Epo (3U/ml) at a density of 2×10⁶ cells/ml. The cells were cultured 6 days with media changes every 2 days and then switched to StemPro-34 containing Epo (3U/ml) for 5 more days. The entire protocol takes 28 days at which point erythroid cells were collected, washed twice in PBS with 0.1%BSA, resuspended in flow cytometry buffer (PBS + 3% FBS) and stained in accordance with the manufacturer’s suggested concentration of conjugated antibody for one hour at 4°C. The stained cells were then washed twice in PBS+0.1%BSA, re-suspended in 500ul FACS buffer (PBS+3%BSA). The samples were then analyzed using a flow cytometer immediately. All of the conjugated antibodies were purchased from eBioscience. The antibodies used were: CD71 (17-0719); CD235a (12-9987); CD36 (11-0369); CD34 (17-0349).
Chromatin Immunoprecipitation (ChIP)
Chromatin immunoprecipitation (ChIP) was performed as previously described by us(24) using EZ ChIP™ Chromatin Immunoprecipitation Kit (Upstate; 17–371), and the following antibodies: Millipore: anti-trimethyl-histone H3(lys27); anti-trimethyl-histone H3(Lys4). Briefly, cells grown on matrigel or differentiated on matrigel (as described above) were isolated, counted, and 2×10⁷ cells (per sample) were cross-linked using 1% (final concentration) formaldehyde and lysed using SDS Lysis Buffer. Cell lysates were sonicated (Fisher Scientific Sonic Dismembrator Model 300) and resultant sheared cross-linked chromatin were collected via centrifugation. Protein G Agarose was added to pre-clear the samples. Supernatant was re-isolated 1ug of either anti-trimethyl-histone H3(lys27) (#07-449) or anti-trimethyl-histone H3(Lys4)(#07-473) was added to each sample. Positive control: anti-acetyl Histone H3; Negative control: Normal Rabbit IgG (data not shown). Antibody-chromatin mixtures were incubated overnight at 4°C with rotation. Protein G Agarose was added for 1 hour at 4°C with rotation to collect the antibody/antigen/DNA complex. Protein DNA/complexes were washed and eluted as the per buffers provided via EZ ChIP™ Chromatin Immunoprecipitation Kit. Crosslinks were reversed using 5M NaCl at 65°C overnight. DNA purification was performed using spin columns. RT-PCR was performed as described above using Myc promoter primers: 5′-ACCTCGACTACGACTCGGTG-3′ and 5′-AGAAGCCGCTCCACATACAG-3′ as previously used by us for ChiP analysis.(24)
DNA methylation analysis
DNA promoter methylation analysis was performed using Infinium HumanMethylation27 arrays via the Genomics Shared Resource at the Roswell Park Cancer Institute and analyzed as previously described(58). Briefly, to analyze DNA methylation patterns comparing cell line before and after reprogramming on a genome-wide scale we used Infinium methylation profiling to interrogate the methylation status of 27,578 CpG dinucleotides representing 14,475 associated genes. Methylation of individual loci was determined by average beta (AVB) values that ranged from 0 (unmethylated) to 1 (completely methylated). Only CpG that showed a decrease or increase in their AVB value (delta beta, DB) of at least 0.15 with a p<0.05 were used (unless indicated otherwise in the text) for the analysis of methylation changes.
Gene Expression Analysis
Total RNA was extracted from the indicated cell lines using an RNA extraction kit (Qiagen) according to the manufacturer’s instructions. RNA was hybridized to Affymetrix U133Plus2 arrays via Genomics Shared Resource at Columbia University and analyzed as previously described by us(24, 35) and being submitted to NCBI GEO. Specifically, data was imported into GeneSpring and RMA (Robust Multi-array Analysis) was used to normalize and summarize probe-level intensity measurements (PM) corrected for background using a non-linear correction, done on a per-chip basis based on the distribution of PM values. Expression values were then quantile normalized. For RMA, the probe affinity effects are assumed to sum to zero, and the gene effect (expression level) is estimated using median polishing thus protecting against outlier probes. Hierarchical cluster analysis was performed using a Pearson correlation coefficient. Gene ranking per subtype was performed using ANOVA (parametric test, Benjamin and Hochberg false discovery rate p<0.05, and Student-Newman-Keuls post hoc analysis). Statistical analysis to correlate stages of differentiation using analysis of variance and principle of component analysis was performed using GeneSpring Software as previously described in detail by us(24, 35).
Statistical Analysis
Statistical test used (i.e., paired or unpaired T-test, ANOVA, etc.) as well as statistical cut-offs (e.g., p value <0.05, fold-change, etc.) are indicated and discussed in the main text. Where appropriate data is presented as means with error bars representing standard deviation.
Supplementary Material
Acknowledgments
The authors would like to thank: Timothy C. Wang MD for critical discussions and manuscript review; Sara Siddiqi and Gannie Tzonove for general technical assistance; Carlos Cordo-Cardo MD PhD for assistance with solid tumor pathological review and discussion; Benjamin Tycko MD PhD for assistance with DNA-methylation analysis; Bachir Alobeid MD for assistance with hematological pathological review; Pavel Sumazin PhD for bioniformatic analysis. I.M. receives funding from NCI, Gerstner CDA, and the Damon Runyon Cancer Research Fund.
Footnotes
Author contributions:
XZ performed all experiments and assisted with experimental design.
MT assisted with experiments and data interpretation.
FDC assisted with experiments and data interpretation.
FR reviewed and interpreted all histopathology outlined.
IM designed the concept and experiments, interpreted the data and wrote the manuscript.
I.M. receives funding from NCI, Gerstner CDA, and the Damon Runyon Cancer Research Fund
References
- 1.Jaenisch R, Young R. Stem Cells, The Molecular Circuitry Of Pluripotency And Nuclear Reprogramming. Cell. 2008;132(4):567–82. doi: 10.1016/j.cell.2008.01.015. Epub 2008/02/26. [DOI] [PMC free article] [PubMed] [Google Scholar]
- 2.Takahashi K, Yamanaka S. Induction Of Pluripotent Stem Cells From Mouse Embryonic And Adult Fibroblast Cultures By Defined Factors. Cell. 2006;126(4):663–76. doi: 10.1016/j.cell.2006.07.024. Epub 2006/08/15. [DOI] [PubMed] [Google Scholar]
- 3.Wernig M, Meissner A, Foreman R, Brambrink T, Ku M, Hochedlinger K, et al. In Vitro Reprogramming Of Fibroblasts Into A Pluripotent Es-Cell-Like State. Nature. 2007;448(7151):318–24. doi: 10.1038/nature05944. Epub 2007/06/08. [DOI] [PubMed] [Google Scholar]
- 4.Lengner Cj. Ips Cell Technology In Regenerative Medicine. Ann N Y Acad Sci. 2010;1192(1):38–44. doi: 10.1111/j.1749-6632.2009.05213.x. Epub 2010/04/16. [DOI] [PubMed] [Google Scholar]
- 5.Carette Je, Pruszak J, Varadarajan M, Blomen Va, Gokhale S, Camargo Fd, et al. Generation Of Ipscs From Cultured Human Malignant Cells. Blood. 2010 doi: 10.1182/blood-2009-07-231845. Epub 2010/03/18. [DOI] [PMC free article] [PubMed] [Google Scholar]
- 6.Utikal J, Maherali N, Kulalert W, Hochedlinger K. Sox2 Is Dispensable For The Reprogramming Of Melanocytes And Melanoma Cells Into Induced Pluripotent Stem Cells. Journal Of Cell Science. 2009;122(Pt 19):3502–10. doi: 10.1242/jcs.054783. Epub 2009/09/03. [DOI] [PMC free article] [PubMed] [Google Scholar]
- 7.Utikal J, Polo Jm, Stadtfeld M, Maherali N, Kulalert W, Walsh Rm, et al. Immortalization Eliminates A Roadblock During Cellular Reprogramming Into Ips Cells. Nature. 2009;460(7259):1145–8. doi: 10.1038/nature08285. Epub 2009/08/12. [DOI] [PMC free article] [PubMed] [Google Scholar]
- 8.Miyoshi N, Ishii H, Nagai K, Hoshino H, Mimori K, Tanaka F, et al. Defined Factors Induce Reprogramming Of Gastrointestinal Cancer Cells. Proceedings Of The National Academy Of Sciences Of The United States Of America. 2010;107(1):40–5. doi: 10.1073/pnas.0912407107. Epub 2009/12/19. [DOI] [PMC free article] [PubMed] [Google Scholar]
- 9.Tang Y, Kim M, Carrasco D, Kung Al, Chin L, Weissleder R. In Vivo Assessment Of Ras-Dependent Maintenance Of Tumor Angiogenesis By Real-Time Magnetic Resonance Imaging. Cancer Research. 2005;65(18):8324–30. doi: 10.1158/0008-5472.CAN-05-0027. Epub 2005/09/17. [DOI] [PubMed] [Google Scholar]
- 10.Hochedlinger K, Blelloch R, Brennan C, Yamada Y, Kim M, Chin L, et al. Reprogramming Of A Melanoma Genome By Nuclear Transplantation. Genes Dev. 2004;18(15):1875–85. doi: 10.1101/gad.1213504. Epub 2004/08/04. [DOI] [PMC free article] [PubMed] [Google Scholar]
- 11.Chang G, Miao Yl, Zhang Y, Liu S, Kou Z, Ding J, et al. Linking Incomplete Reprogramming To The Improved Pluripotency Of Murine Embryonal Carcinoma Cell-Derived Pluripotent Stem Cells. Plos One. 2010;5(4):E10320. doi: 10.1371/journal.pone.0010320. Epub 2010/05/04. [DOI] [PMC free article] [PubMed] [Google Scholar]
- 12.Yu J, Vodyanik Ma, Smuga-Otto K, Antosiewicz-Bourget J, Frane Jl, Tian S, et al. Induced Pluripotent Stem Cell Lines Derived From Human Somatic Cells. Science. 2007;318(5858):1917–20. doi: 10.1126/science.1151526. Epub 2007/11/22. [DOI] [PubMed] [Google Scholar]
- 13.Takahashi K, Tanabe K, Ohnuki M, Narita M, Ichisaka T, Tomoda K, et al. Induction Of Pluripotent Stem Cells From Adult Human Fibroblasts By Defined Factors. Cell. 2007;131(5):861–72. doi: 10.1016/j.cell.2007.11.019. Epub 2007/11/24. [DOI] [PubMed] [Google Scholar]
- 14.Mills J, Hricik T, Siddiqi S, Matushansky I. Chromatin Structure Predicts Epigenetic Therapy Responsiveness In Sarcoma. Mol Cancer Ther. 2011 doi: 10.1158/1535-7163.MCT-10-0724. Epub 2011/01/11. [DOI] [PMC free article] [PubMed] [Google Scholar]
- 15.Mills J, Matos T, Charytonowicz E, Hricik T, Castillo-Martin M, Remotti F, et al. Characterization And Comparison Of The Properties Of Sarcoma Cell Lines In Vitro And In Vivo. Human Cell: Official Journal Of Human Cell Research Society. 2009;22(4):85–93. doi: 10.1111/j.1749-0774.2009.00073.x. Epub 2009/10/31. [DOI] [PMC free article] [PubMed] [Google Scholar]
- 16.Krause U, Seckinger A, Gregory Ca. Assays Of Osteogenic Differentiation By Cultured Human Mesenchymal Stem Cells. Methods Mol Biol. 2011;698:215–30. doi: 10.1007/978-1-60761-999-4_17. Epub 2011/03/25. [DOI] [PubMed] [Google Scholar]
- 17.Feng J, Mantesso A, De Bari C, Nishiyama A, Sharpe Pt. Dual Origin Of Mesenchymal Stem Cells Contributing To Organ Growth And Repair. Proceedings Of The National Academy Of Sciences Of The United States Of America. 2011 doi: 10.1073/pnas.1015449108. Epub 2011/04/06. [DOI] [PMC free article] [PubMed] [Google Scholar]
- 18.Lai Rc, Choo A, Lim Sk. Derivation And Characterization Of Human Esc-Derived Mesenchymal Stem Cells. Methods Mol Biol. 2011;698:141–50. doi: 10.1007/978-1-60761-999-4_11. Epub 2011/03/25. [DOI] [PubMed] [Google Scholar]
- 19.Lu Sj, Feng Q, Park Js, Lanza R. Directed Differentiation Of Red Blood Cells From Human Embryonic Stem Cells. Methods Mol Biol. 2010;636:105–21. doi: 10.1007/978-1-60761-691-7_7. Epub 2010/03/26. [DOI] [PubMed] [Google Scholar]
- 20.Lu Sj, Feng Q, Park Js, Vida L, Lee Bs, Strausbauch M, et al. Biologic Properties And Enucleation Of Red Blood Cells From Human Embryonic Stem Cells. Blood. 2008;112(12):4475–84. doi: 10.1182/blood-2008-05-157198. Epub 2008/08/21. [DOI] [PMC free article] [PubMed] [Google Scholar]
- 21.Merryweather-Clarke At, Atzberger A, Soneji S, Gray N, Clark K, Waugh C, et al. Global Gene Expression Analysis Of Human Erythroid Progenitors. Blood. 2011 doi: 10.1182/blood-2010-07-290825. Epub 2011/01/29. [DOI] [PubMed] [Google Scholar]
- 22.Ma F, Ebihara Y, Umeda K, Sakai H, Hanada S, Zhang H, et al. Generation Of Functional Erythrocytes From Human Embryonic Stem Cell-Derived Definitive Hematopoiesis. Proceedings Of The National Academy Of Sciences Of The United States Of America. 2008;105(35):13087–92. doi: 10.1073/pnas.0802220105. Epub 2008/08/30. [DOI] [PMC free article] [PubMed] [Google Scholar]
- 23.Barrios C, Castresana Js, Kreicbergs A. Clinicopathologic Correlations And Short-Term Prognosis In Musculoskeletal Sarcoma With C-Myc Oncogene Amplification. Am J Clin Oncol. 1994;17(3):273–6. doi: 10.1097/00000421-199406000-00019. Epub 1994/06/01. [DOI] [PubMed] [Google Scholar]
- 24.Matushansky I, Hernando E, Socci Nd, Mills Je, Matos Ta, Edgar Ma, et al. Derivation Of Sarcomas From Mesenchymal Stem Cells Via Inactivation Of The Wnt Pathway. The Journal Of Clinical Investigation. 2007;117(11):3248–57. doi: 10.1172/JCI31377. Epub 2007/10/20. [DOI] [PMC free article] [PubMed] [Google Scholar]
- 25.Bernstein Be, Mikkelsen Ts, Xie X, Kamal M, Huebert Dj, Cuff J, et al. A Bivalent Chromatin Structure Marks Key Developmental Genes In Embryonic Stem Cells. Cell. 2006;125(2):315–26. doi: 10.1016/j.cell.2006.02.041. [DOI] [PubMed] [Google Scholar]
- 26.Spivakov M, Fisher Ag. Epigenetic Signatures Of Stem-Cell Identity. Nature Reviews. 2007;8(4):263–71. doi: 10.1038/nrg2046. [DOI] [PubMed] [Google Scholar]
- 27.Ohm Je, Mcgarvey Km, Yu X, Cheng L, Schuebel Ke, Cope L, et al. A Stem Cell-Like Chromatin Pattern May Predispose Tumor Suppressor Genes To Dna Hypermethylation And Heritable Silencing. Nature Genetics. 2007;39(2):237–42. doi: 10.1038/ng1972. [DOI] [PMC free article] [PubMed] [Google Scholar]
- 28.Koche Rp, Smith Zd, Adli M, Gu H, Ku M, Gnirke A, et al. Reprogramming Factor Expression Initiates Widespread Targeted Chromatin Remodeling. Cell Stem Cell. 2011;8(1):96–105. doi: 10.1016/j.stem.2010.12.001. Epub 2011/01/08. [DOI] [PMC free article] [PubMed] [Google Scholar]
- 29.Stadtfeld M, Hochedlinger K. Induced Pluripotency: History, Mechanisms, And Applications. Genes Dev. 2010;24(20):2239–63. doi: 10.1101/gad.1963910. Epub 2010/10/19. [DOI] [PMC free article] [PubMed] [Google Scholar]
- 30.Jones Pa, Baylin Sb. The Epigenomics Of Cancer. Cell. 2007;128(4):683–92. doi: 10.1016/j.cell.2007.01.029. Epub 2007/02/27. [DOI] [PMC free article] [PubMed] [Google Scholar]
- 31.Han J, Sachdev Ps, Sidhu Ks. A Combined Epigenetic And Non-Genetic Approach For Reprogramming Human Somatic Cells. Plos One. 2010;5(8):E12297. doi: 10.1371/journal.pone.0012297. Epub 2010/09/03. [DOI] [PMC free article] [PubMed] [Google Scholar]
- 32.Higgins Me, Claremont M, Major Je, Sander C, Lash Ae. Cancergenes: A Gene Selection Resource For Cancer Genome Projects. Nucleic Acids Res. 2007;35(Database Issue):D721–6. doi: 10.1093/nar/gkl811. Epub 2006/11/08. [DOI] [PMC free article] [PubMed] [Google Scholar]
- 33.Mikkelsen Ts, Hanna J, Zhang X, Ku M, Wernig M, Schorderet P, et al. Dissecting Direct Reprogramming Through Integrative Genomic Analysis. Nature. 2008;454(7200):49–55. doi: 10.1038/nature07056. Epub 2008/05/30. [DOI] [PMC free article] [PubMed] [Google Scholar]
- 34.Zhang B, Chen B, Wu T, Tan Y, Qiu S, Xuan Z, et al. Estimating The Quality Of Reprogrammed Cells Using Es Cell Differentiation Expression Patterns. Plos One. 2011;6(1):E15336. doi: 10.1371/journal.pone.0015336. Epub 2011/02/02. [DOI] [PMC free article] [PubMed] [Google Scholar]
- 35.Matushansky I, Hernando E, Socci Nd, Matos T, Mills J, Edgar Ma, et al. A Developmental Model Of Sarcomagenesis Defines A Differentiation-Based Classification For Liposarcomas. The American Journal Of Pathology. 2008;172(4):1069–80. doi: 10.2353/ajpath.2008.070284. Epub 2008/03/04. [DOI] [PMC free article] [PubMed] [Google Scholar]
- 36.Glauche I, Moore K, Thielecke L, Horn K, Loeffler M, Roeder I. Stem Cell Proliferation And Quiescence--Two Sides Of The Same Coin. Plos Comput Biol. 2009;5(7):E1000447. doi: 10.1371/journal.pcbi.1000447. Epub 2009/07/25. [DOI] [PMC free article] [PubMed] [Google Scholar]
- 37.Ogawa M, Porter Pn, Nakahata T. Renewal And Commitment To Differentiation Of Hemopoietic Stem Cells (An Interpretive Review) Blood. 1983;61(5):823–9. Epub 1983/05/01. [PubMed] [Google Scholar]
- 38.Giebel B, Punzel M. Lineage Development Of Hematopoietic Stem And Progenitor Cells. Biol Chem. 2008;389(7):813–24. doi: 10.1515/BC.2008.092. Epub 2008/07/17. [DOI] [PubMed] [Google Scholar]
- 39.Siddiqi S, Mills J, Matushansky I. Epigenetic Remodeling Of Chromatin Architecture: Exploring Tumor Differentiation Therapies In Mesenchymal Stem Cells And Sarcomas. Curr Stem Cell Res Ther. 2010;5(1):63–73. doi: 10.2174/157488810790442859. Epub 2009/10/08. [DOI] [PMC free article] [PubMed] [Google Scholar]
- 40.Miyamoto K, Araki Ky, Naka K, Arai F, Takubo K, Yamazaki S, et al. Foxo3a Is Essential For Maintenance Of The Hematopoietic Stem Cell Pool. Cell Stem Cell. 2007;1(1):101–12. doi: 10.1016/j.stem.2007.02.001. Epub 2008/03/29. [DOI] [PubMed] [Google Scholar]
- 41.Eminli S, Foudi A, Stadtfeld M, Maherali N, Ahfeldt T, Mostoslavsky G, et al. Differentiation Stage Determines Potential Of Hematopoietic Cells For Reprogramming Into Induced Pluripotent Stem Cells. Nat Genet. 2009;41(9):968–76. doi: 10.1038/ng.428. Epub 2009/08/12. [DOI] [PMC free article] [PubMed] [Google Scholar]
- 42.Okita K, Hong H, Takahashi K, Yamanaka S. Generation Of Mouse-Induced Pluripotent Stem Cells With Plasmid Vectors. Nat Protoc. 2010;5(3):418–28. doi: 10.1038/nprot.2009.231. Epub 2010/03/06. [DOI] [PubMed] [Google Scholar]
- 43.Gore A, Li Z, Fung Hl, Young Je, Agarwal S, Antosiewicz-Bourget J, et al. Somatic Coding Mutations In Human Induced Pluripotent Stem Cells. Nature. 2011;471(7336):63–7. doi: 10.1038/nature09805. Epub 2011/03/04. [DOI] [PMC free article] [PubMed] [Google Scholar]
- 44.Hussein Sm, Batada Nn, Vuoristo S, Ching Rw, Autio R, Narva E, et al. Copy Number Variation And Selection During Reprogramming To Pluripotency. Nature. 2011;471(7336):58–62. doi: 10.1038/nature09871. Epub 2011/03/04. [DOI] [PubMed] [Google Scholar]
- 45.Lister R, Pelizzola M, Kida Ys, Hawkins Rd, Nery, Hon G, et al. Hotspots Of Aberrant Epigenomic Reprogramming In Human Induced Pluripotent Stem Cells. Nature. 2011;471(7336):68–73. doi: 10.1038/nature09798. Epub 2011/02/04. [DOI] [PMC free article] [PubMed] [Google Scholar]
- 46.Laurent Lc, Ulitsky I, Slavin I, Tran H, Schork A, Morey R, et al. Dynamic Changes In The Copy Number Of Pluripotency And Cell Proliferation Genes In Human Escs And Ipscs During Reprogramming And Time In Culture. Cell Stem Cell. 2011;8(1):106–18. doi: 10.1016/j.stem.2010.12.003. Epub 2011/01/08. [DOI] [PMC free article] [PubMed] [Google Scholar]
- 47.Mayshar Y, Ben-David U, Lavon N, Biancotti Jc, Yakir B, Clark At, et al. Identification And Classification Of Chromosomal Aberrations In Human Induced Pluripotent Stem Cells. Cell Stem Cell. 2010;7(4):521–31. doi: 10.1016/j.stem.2010.07.017. Epub 2010/10/05. [DOI] [PubMed] [Google Scholar]
- 48.Theunissen Tw, Van Oosten Al, Castelo-Branco G, Hall J, Smith A, Silva Jc. Nanog Overcomes Reprogramming Barriers And Induces Pluripotency In Minimal Conditions. Curr Biol. 2011;21(1):65–71. doi: 10.1016/j.cub.2010.11.074. Epub 2011/01/05. [DOI] [PMC free article] [PubMed] [Google Scholar]
- 49.Silva J, Barrandon O, Nichols J, Kawaguchi J, Theunissen Tw, Smith A. Promotion Of Reprogramming To Ground State Pluripotency By Signal Inhibition. Plos Biol. 2008;6(10):E253. doi: 10.1371/journal.pbio.0060253. Epub 2008/10/24. [DOI] [PMC free article] [PubMed] [Google Scholar]
- 50.Esteban Ma, Wang T, Qin B, Yang J, Qin D, Cai J, et al. Vitamin C Enhances The Generation Of Mouse And Human Induced Pluripotent Stem Cells. Cell Stem Cell. 2010;6(1):71–9. doi: 10.1016/j.stem.2009.12.001. Epub 2009/12/29. [DOI] [PubMed] [Google Scholar]
- 51.Pitha-Rowe I, Petty Wj, Kitareewan S, Dmitrovsky E. Retinoid Target Genes In Acute Promyelocytic Leukemia. Leukemia: Official Journal Of The Leukemia Society Of America, Leukemia Research Fund, Uk. 2003;17(9):1723–30. doi: 10.1038/sj.leu.2403065. Epub 2003/09/13. [DOI] [PubMed] [Google Scholar]
- 52.Charytonowicz E, Terry M, Coakley K, Telis L, Remotti F, Cordon-Cardo C, et al. Ppargamma Agonists Enhance Et-743-Induced Adipogenic Differentiation In A Transgenic Mouse Model Of Myxoid Round Cell Liposarcoma. The Journal Of Clinical Investigation. 2012;122(3):886–98. doi: 10.1172/JCI60015. Epub 2012/02/02. [DOI] [PMC free article] [PubMed] [Google Scholar]
- 53.Richon Vm, Emiliani S, Verdin E, Webb Y, Breslow R, Rifkind Ra, et al. A Class Of Hybrid Polar Inducers Of Transformed Cell Differentiation Inhibits Histone Deacetylases. Proceedings Of The National Academy Of Sciences Of The United States Of America. 1998;95(6):3003–7. doi: 10.1073/pnas.95.6.3003. Epub 1998/04/18. [DOI] [PMC free article] [PubMed] [Google Scholar]
- 54.Pomerantz Jh, Mukherjee S, Palermo At, Blau Hm. Reprogramming To A Muscle Fate By Fusion Recapitulates Differentiation. Journal Of Cell Science. 2009;122(Pt 7):1045–53. doi: 10.1242/jcs.041376. Epub 2009/03/20. [DOI] [PMC free article] [PubMed] [Google Scholar]
- 55.West Fd, Machacek Dw, Boyd Nl, Pandiyan K, Robbins Kr, Stice Sl. Enrichment And Differentiation Of Human Germ-Like Cells Mediated By Feeder Cells And Basic Fibroblast Growth Factor Signaling. Stem Cells. 2008;26(11):2768–76. doi: 10.1634/stemcells.2008-0124. Epub 2008/08/23. [DOI] [PubMed] [Google Scholar]
- 56.Warren L, Manos Pd, Ahfeldt T, Loh Yh, Li H, Lau F, et al. Highly Efficient Reprogramming To Pluripotency And Directed Differentiation Of Human Cells With Synthetic Modified Mrna. Cell Stem Cell. 2010;7(5):618–30. doi: 10.1016/j.stem.2010.08.012. Epub 2010/10/05. [DOI] [PMC free article] [PubMed] [Google Scholar]
- 57.Huangfu D, Osafune K, Maehr R, Guo W, Eijkelenboom A, Chen S, et al. Induction Of Pluripotent Stem Cells From Primary Human Fibroblasts With Only Oct4 And Sox2. Nat Biotechnol. 2008;26(11):1269–75. doi: 10.1038/nbt.1502. Epub 2008/10/14. [DOI] [PubMed] [Google Scholar]
- 58.Bock C, Tomazou Em, Brinkman Ab, Muller F, Simmer F, Gu H, et al. Quantitative Comparison Of Genome-Wide Dna Methylation Mapping Technologies. Nat Biotechnol. 2010;28(10):1106–14. doi: 10.1038/nbt.1681. Epub 2010/09/21. [DOI] [PMC free article] [PubMed] [Google Scholar]
Associated Data
This section collects any data citations, data availability statements, or supplementary materials included in this article.