

Abstract
When grown on solid substrates, different microorganisms often form colonies with very specific morphologies. Whereas the pioneers of microbiology often used colony morphology to discriminate between species and strains, the phenomenon has not received much attention recently. In this study, we use a genome-wide assay in the model yeast Saccharomyces cerevisiae to identify all genes that affect colony morphology. We show that several major signalling cascades, including the MAPK, TORC, SNF1 and RIM101 pathways play a role, indicating that morphological changes are a reaction to changing environments. Other genes that affect colony morphology are involved in protein sorting and epigenetic regulation. Interestingly, the screen reveals only few genes that are likely to play a direct role in establishing colony morphology, with one notable example being FLO11, a gene encoding a cell-surface adhesin that has already been implicated in colony morphology, biofilm formation, and invasive and pseudohyphal growth. Using a series of modified promoters for fine-tuning FLO11 expression, we confirm the central role of Flo11 and show that differences in FLO11 expression result in distinct colony morphologies. Together, our results provide a first comprehensive look at the complex genetic network that underlies the diversity in the morphologies of yeast colonies.
Introduction
Long before genetic fingerprinting, brewers and bakers used differences in the morphologies of microbial colonies to discriminate between different strains of the common brewer's yeast Saccharomyces cerevisiae. Early reports from the Carlsberg research labs, first by Hansen in the 1890s, and later by Winge in the 1930s, show how differences in colony shape were used to discriminate different yeasts (Spencer and Spencer, 1997). Later, the same strategy was adopted by beer brewers, who used colony morphology to monitor the purity and identity of their yeast (Hall, 1971).
The enormous diversity in colony morphologies is both puzzling and intriguing. However, surprisingly little is known about the physiological and genetic principles that underlie colony formation and morphology. This is at least partly due to the common practice of studying planktonic cells in liquid culture rather than more heterogeneous colonies on solid substrates. Moreover, much of today's research is carried out with domesticated mutants that have lost the ability to form distinct colony morphologies (Mortimer and Johnston, 1986; Liu et al., 1996).
Recently, however, there is a renewed interest in the behaviour of feral yeasts on solid substrates. These studies revealed that yeast colonies are true multicellular communities that show a remarkable degree of differential gene expression and morphology that resembles to some degree cellular differentiation in higher multicellular organisms (Honigberg, 2011). Cellular differentiation into spores, for example, has been observed within specific regions of yeast colonies (Ohkuni et al., 1998; Piccirillo and Honigberg, 2010). Other studies have reported apoptosis, along with differential gene expression (Frohlich and Madeo, 2000; Minarikova et al., 2001), intercellular signalling (Palkova et al., 1997), changes in metabolism (Vachova et al., 2009a) and spatial organization (Varon and Choder, 2000; Scherz et al., 2001) in yeast colonies, indicating a higher level specialization and communication during growth on solid substrates. One particular gene, FLO11, which encodes a large cell-surface protein, has been identified as one of the key players in colony development (Granek and Magwene, 2010; Vachova et al., 2011). Interestingly, apart from being crucial for proper development of colony morphology, FLO11 also confers adhesion of the colony to the substrate. Moreover, in nutrient-poor conditions expression of FLO11 is necessary, but not sufficient, for the formation of pseudohyphae, which are chains of elongated cells at the edge of the colony (Gimeno et al., 1992; Lo and Dranginis, 1996). When yeast cells are grown on semi-solid substrates, FLO11 is required for the formation of large, thin biofilm-like structures called ‘mats’ (Reynolds and Fink, 2001; Reynolds, 2006; Reynolds et al., 2008).
FLO11 encodes a large mucin-like cell surface protein that shows homology to other S. cerevisiae adhesin genes, such as FLO1, FLO5, FLO9 and FLO10. All Flo proteins share a common structure composed of three domains. A C-terminal glycosylphosphatidylinositol (GPI)-anchor domain allows temporary anchoring of the protein in the cell membrane. A central domain contains serine and threonine-rich tandem repeats (Verstrepen et al., 2005; Gemayel et al., 2010). Variation in repeat number in the central domain allows for changes in FLO11-mediated phenotypes (Verstrepen et al., 2005; Fidalgo et al., 2008). The N-terminal domain of Flo11, however, differs from that of the other Flo proteins. Flo1, Flo5, Flo9 and Flo10 contain a lectin-like binding pocket that selectively binds specific sugar residues present on the surface of other cells. This structure is absent in Flo11 and this difference explains why Flo11 does not confer cell–cell adhesion (Verstrepen and Klis, 2006; Van Mulders et al., 2009; Veelders et al., 2010; Goossens et al., 2011). Instead, the presence of the long, variable central Flo11 domain seemingly increases the hydrophobicity of the yeast cell wall and increases adhesion to abiotic surfaces and substrates. A recent study shows that Flo11 proteins can even be shed from the cells, forming a extracellular layer of a mucus-like substance that may facilitate sliding motility (Karunanithi et al., 2010).
The regulation of FLO11 is remarkably complex. The long (3 kb) promoter of FLO11 integrates inputs from several signalling pathways, including the MAPK and RAS-cAMP-PKA pathways, which tune FLO11 expression in response to environmental changes (Lambrechts et al., 1996; Rupp et al., 1999; Bruckner and Mosch, 2011; Granek et al., 2011). A second regulatory layer employs non-coding RNAs, which yield a toggle-like bimodal expression (Bumgarner et al., 2009). Furthermore, FLO11 is also regulated by changes in the chromatin state, which makes the expression state epigenetically heritable from mother to daughter cells (Halme et al., 2004; Octavio et al., 2009).
Though previous studies have shown the enormous complexity underlying yeast colony morphology and physiology, they were not systematic. In those studies, relatively few genes were directly linked to colony morphology, and they do not represent a comprehensive view of the genetic network underlying colony formation. In this study, we performed a genome-wide screen to identify all non-essential genes that affect colony morphology in the Sigma 1278b strain. Our results reveal an extremely complex genetic network, involving multiple signalling pathways, including MAPK and cAMP-PKA, the HOG pathway, the TORC1 pathway, and the entire RIM101 pathway. The network derived from this work reveals the importance of endocytosis, protein sorting and actin modification in determining colony morphology. It also indicates that tRNA acetylation could be important in the induction of an altered morphology. Moreover, our screen confirms FLO11 as one of few effector genes that play a direct, functional role in establishing colony morphology. To further investigate the role of FLO11, we investigated the effects of FLO11 expression on morphology. We show that FLO11 expression is uniform within colonies, and that differences in overall FLO11 expression levels are directly linked to differences in colony morphology. Lastly, we compare the gene expression profile of a wrinkly strain to that of a smooth flo11Δ mutant. The results show that disruption of colony morphology results in relatively few pronounced changes in gene expression, with a few notable exceptions, including genes involved in respiration and genes encoding cell surface proteins.
Results
Colony morphology is influenced by growth conditions
The most commonly used yeast research strain S288c does not show a pronounced colony morphology, presumably because it was specifically selected not to show cell–cell and cell-surface adhesion (Mortimer and Johnston, 1986). Hence, to study colony morphology, we first investigated the morphologies of various other yeast strains under several different conditions. More specifically, we grew the strains SK1, Sigma 1278b and EM93 (the feral progenitor of S288c) in different temperatures, agar concentrations, pH, carbon and nitrogen sources. The results indicate that each of these strains showed remarkably complex, strain-specific morphologies that were influenced by the environmental conditions. Notably, media with glucose repressed wrinkled morphologies, while media containing other carbon sources, such as sucrose, promoted wrinkliness (Fig. 1). Similarly, varying agar concentrations in the medium also influenced the observed colony morphologies, with low concentrations resulting in flat, biofilm-like mats. Gradual increases in agar concentrations led to a gradual reduction in the surface area of the mats and caused a gradual transition from mats to small colonies with a reduced circumference but increased height (distance from the surface of the substrate to the top of the colony) (Fig. S1).
Fig. 1.
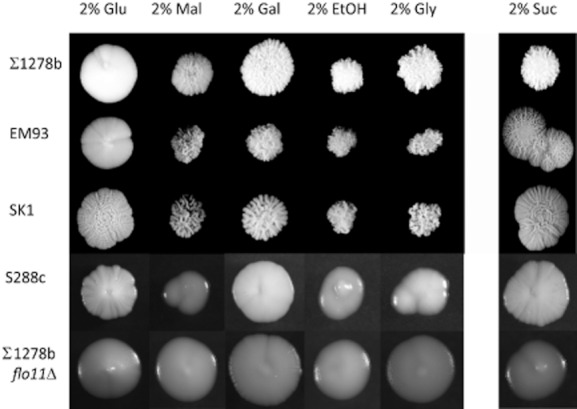
Yeast colony morphology depends on strain background and environment. Different media confer different morphologies in the same background and different strains yield different morphologies in the same media. Strains were grown in media with different carbon sources as described in Experimental procedures. Glu, glucose; Mal, maltose; Gal, galactose; EtOH, ethanol; Gly, glycerol; Suc, sucrose.
Colony morphology is regulated by a complex genetic network
Colony morphology is influenced by several environmental parameters, as shown in Fig. 1 and Fig. S1 for example. Some of these factors, such as the concentration of agar, may influence colony morphology by changing the physical and chemical properties of the substrate (e.g. surface tension, surface hydrophobicity etc … ). Other parameters, such as carbon source, likely act, at least in part, by changing the physiology of the yeast. Because of these multiple parameters, we hypothesized that colony morphology is likely regulated by several complex physiological processes involving many gene products.
To investigate the genetic network involved in regulating colony morphology, we examined the morphology of a set of 4156 mutants in the Sigma 1278b background, each carrying a deletion of one non-essential gene (Dowell et al., 2010). The morphology of each mutant was evaluated in conditions that promote the formation of complex colony morphologies (YP sucrose plates with 2% agar incubated at 30°C; see above and Fig. 1). Colonies were categorized for several criteria, including wrinkliness, size and shape (Fig. S2). Comparing the morphology of the deletion collection with the Sigma 1278b wild type, the screen identified a total of 211 gene deletions that affect morphology (52 result in smooth colonies, 159 reduce the wrinkliness) and 268 gene deletions that affect the size.
Next, we used a physical interaction network to identify processes that regulate colony morphology. The 211 genes associated with altered colony morphology could be mapped onto our network (Table S1, all smooth and semi-smooth genes, minus putative proteins and dubious open reading frames). To visualize which processes and pathways play a role in colony morphology, we performed gene ontology (GO), protein complex and pathway enrichments (Tables S2 and S3, Figs S3 and S4, and File S1). The results of these analyses were mapped onto the physical interaction network to visualize the associated biological functions and processes. Figure 2 shows a simplified version of this analysis. An uncondensed version of this figure and an interactive version are available at http://homes.esat.kuleuven.be/~kmarchal/Supplementary_Information_DeMaeyer_2012_2013/yeastcolonymorphology/). The resulting network confirms previous findings that the MAPK and the RIM101 pathways play a role in colony morphology by regulating FLO11 expression. However, our screen identifies many more genes, and several cellular processes that affect colony morphology, including chromatin modification complexes, endocytic proteins and tRNA modifying proteins.
Fig. 2.

Physical interaction network visualization of genes involved in colony morphology. Genes with mutations resulting in altered colony morphology are mapped onto a physical interaction network as round nodes. To improve clarity, protein complexes containing more than 2 genes are visualized as single coloured octagonal nodes. Small protein complexes containing genes associated with colony morphology are complemented with their corresponding gene members which were not directly associated with altered colony morphology, these are visualized as a parallelogram if the mutation of this gene is lethal, or as a triangle if the mutation resulted in decreased fitness. FLO11 is indicated as a large round yellow node. The edges between the nodes indicate physical interactions and specifically green edges indicate protein–protein interactions, blue phosphorylation interactions, orange de-phosphorylation interactions and red protein–DNA interactions. The direction if applicable for an interaction is indicated with an arrow. Genes with mutations resulting in altered colony morphology which are not connected to other smooth/semi-smooth genes or associated complexes are omitted from this figure.
Our screen shows that components of MAPK signal transduction pathways (Fig. 2, dark red shaded area, P < 1E-10 for filamentous growth (FG) associated MAPK pathway (Chavel et al., 2010) and P < 1E-5 for response to osmotic stress (GO:0006970)), the Snf1/Snf4/Gal83 complex and 10 other proteins play a role in the induction of colony morphology. Specifically, genes associated with the protein kinase C (PKC1), FG and high osmolarity glycerol (HOG) MAPK pathways (Gray et al., 1997; Posas et al., 1998; Vyas et al., 2003; Mapes and Ota, 2004; Saito and Tatebayashi, 2004; Saito, 2010), which largely overlap. In addition to these MAPK pathways, we also identify the Target Of Rapamycin (TOR) pathway as a central regulator of colony morphology. Similar to the MAPK cascades, the TOR pathway also plays a role in catabolite repression and stress response (Vinod and Venkatesh, 2008).
Interestingly, the pathway most tightly correlated to colony morphology in our screen is the RIM101 pathway, which is thought to regulate gene expression in response to alkaline conditions (Fig. 2, blue shaded area, P < 1E-15 using a consensus pathway as described in Sarode et al., 2011), for an overview of all enrichments in genes associated with altered colony morphology see Table S3. Genes spanning the whole pathway (including DFG16, RIM21, RIM8, SNF7, VPS20, VPS36, SNF8, STP22, BRO1, RIM13, RIM20, YGR122W and RIM101) were associated with altered colony morphology, indicating a primary involvement of this signalling cascade in the regulation of colony morphology.
Another important set of genes identified in our screen as regulators of colony morphology are associated with epigenetic inheritance, chromatin modification and gene regulation (Fig. 2, orange shaded area, P < 1E-12 for genes in shaded area with GO term chromatin organization (GO:0006325) and P < 1E-10 for chromatin modification (GO:16568), for an overview of all enrichments in the all altered colony morphology associated genes see Table S3). First, we identified three genes of the Rpd3L complex (ASH1, SDS3 and SIN3) as being involved in altered colony morphology, which is a chromatin modifying complex that plays a role in gene regulation through histone deacetylation (Carrozza et al., 2005). Second, three members of the Ino80/Swr1p complexes (SWC7, IES3 and ARP8) were also identified as genes associated with colony morphology. The Ino80/Swr1 complex is ATP-dependent, and influences up to 20% of genes in S. cerevisiae, including genes involved in filamentation (Jonsson et al., 2004; Furukawa et al., 2011). Third, several members of the SAGA complex (TAF12, SPT7, SUS1 and ADA2) were identified in our screen. The SAGA complex is involved in histone acetylation, stabilization of RNA Polymerase II and deubiquitination of histones (Grant et al., 1998; Koutelou et al., 2010). Lastly, our screen also identifies several other chromatin-related genes, including SIR3, RSC2 (part of the RSC chromatin structure remodelling complex), HTB2, IOC4 and HMO1.
Our screen also identified several genes that may influence colony morphology through post-transcriptional processes (Fig. 2, yellow shaded area, P < 1E-12 for genes in shaded area with GO terms wobble position uridine thiolation (GO:0002143), tRNA wobble uridine modification (GO:0002098) and tRNA wobble base modification (GO:0002097), for an overview of all enrichments in the altered colony morphology associated genes see Table S3). The protein products of these genes are related to protein tRNA modification and urmylation (Furukawa et al., 2000; Pedrioli et al., 2008). Strains defective in UBA4 and URM1 have been found to be defective in agar invasion (Goehring et al., 2003) and the tRNA modification has been linked to MAPK signalling (Abdullah and Cullen, 2009).
Several additional regulatory complexes were identified in our genetic screen. First, the glucose induced degradation (GID) complex through GID8 and VID24. This complex plays a role in the regulation of the gluconeogenic processes through degradation of fructose 1,6-bisphosphatase (Santt et al., 2008). Second, the cytoplasmic ribosomal large subunit consisting of RPL6A, RPL22A, RPL12B, RPL39, RPL34A and RPL35A. Third, the ATP F1/F0 synthase complex consisting of ATP18, OLI1, ATP8 and ATP16. Fourth, the acetyltransferases with the NatA complex consisting of ARD1 and NAT1. Lastly, the NatC complex, consisting of MAK10, and the NatB complex, consisting of MDM20 (Polevoda et al., 2003; Polevoda and Sherman, 2003).
Apart from a large set of genes that are involved in sensing, signalling and other regulatory processes, our screen also identified several genes involved in endocytosis (Fig. 2, green shaded area, P < 1E-11 for genes in shaded area with GO term membrane invagination (GO:0010324) and P < 1E-8 for endocytosis (GO:0006897), for an overview of all enrichments in the altered colony morphology associated genes see Table S3). RVS161 and RVS167 are associated with vesicle scission during endocytosis (Robertson et al., 2009; Youn et al., 2010). This complex plays a major role in membrane invagination, together with the protein complex Pan1/Sla1/End3 (the actin cytoskeleton-regulatory complex) and additional genes associated with membrane invagination, including END3, VRP1, YRB2, LDB17 and BZZ1 (Smythe and Ayscough, 2006; Toret and Drubin, 2006; Burston et al., 2009). Additionally, we identified that three members of the CORVET/HOPS complexes (PEP5, VPS41 and VPS33) play a role in altered colony morphology. These complexes can interconnect by dynamic subunit exchange and the HOPS complex has been found to play a role in the fusion of endosomes to vacuoles (Nakamura et al., 1997), while the CORVET complex plays a role in transition from endosome to lysosome (Peplowska et al., 2007).
Among the gene deletions that were shown to diminish colony morphology was only a small number of genes encoding enzymes or structural proteins. This short list includes FLO11, TOS1 (encoding a cell wall protein of unknown function; Terashima et al., 2002) and DFG16, a probable multiple transmembrane sensor involved in haploid invasive growth (Mosch et al., 1999; Sarode et al., 2011). The lack of additional genes that encode structural proteins suggests that colony morphology only relies on a relatively small number of ‘effector’ genes that are directly involved in shaping a colony, and a larger number of regulatory genes.
To corroborate results obtained from this large-scale screen, we selected nine genes that were identified in the genome-wide screen as potential mediators of colony morphology and that represent different pathways and cellular processes involved. The selected genes are DFG16 and YGR122W (components of the RIM101 pathway), RVS161 (endocytosis), SDS3, SWC7, RSC2 and ARP8 (chromatin organization and remodelling), URM1 (tRNA modification/protein urmylation) and TOS1 (a cell wall protein of unknown function). Deletion of eight of these candidate genes phenocopied the results obtained in the genome-level screen and thus confirmed the involvement of these genes in colony morphology (Fig. S5A). For one gene, TOS1, independently created deletion mutants displayed variable phenotypes, with three mutants having a wrinkly and two having a semi-smooth colony morphology (the latter is the phenotype observed in screen). The reason for this is currently still unclear, but one possibility is rapid accumulation of suppressor mutations in a tos1Δ mutant, which could affect colony morphology.
In addition, we also investigated whether the marker gene used to create these gene deletions was linked to the observed phenotype. The disruption cassette used to delete the selected genes mentioned above consisted of a hygromycin resistance marker flanked by loxP sites, allowing excision of the marker gene by the Cre recombinase. In all nine cases, removal of the marker gene resulted in an exact phenocopy of the previously obtained deletion mutant (still containing the resistance marker), showing that the colony morphology phenotype is not linked to the marker gene used (Fig. S5B).
FLO11 is a major determinant of colony morphology
Since FLO11 is one of the few downstream ‘effector’ genes that encode a protein that is directly responsible for colony morphology, and FLO11 is downstream of a very large and complex regulatory network, we hypothesized that FLO11 expression levels may be an important factor contributing to the diversity in colony morphologies. To investigate this possibility, we analysed the correlation between FLO11 expression and colony morphology in a set of haploid derivatives of EM93, which is a feral diploid yeast with a pronounced colony morphology. Each haploid derivative of this heterozygous diploid feral strain shows a different colony morphology. In each of the examined haploid strains, the wrinkly phenotype correlated with the highest FLO11 expression (one example tetrad shown in Fig. 3A). In addition, it was possible to convert a smooth haploid strain to a wrinkly strain by deleting SFL1, a repressor of the FLO11 gene (Conlan and Tzamarias, 2001). Deletion of SFL1 in this smooth strain resulted in increased FLO11 expression and yielded wrinkly colonies that looked nearly indistinguishable from the wrinkly sister strain from the same tetrad (Fig. 3B).
Fig. 3.
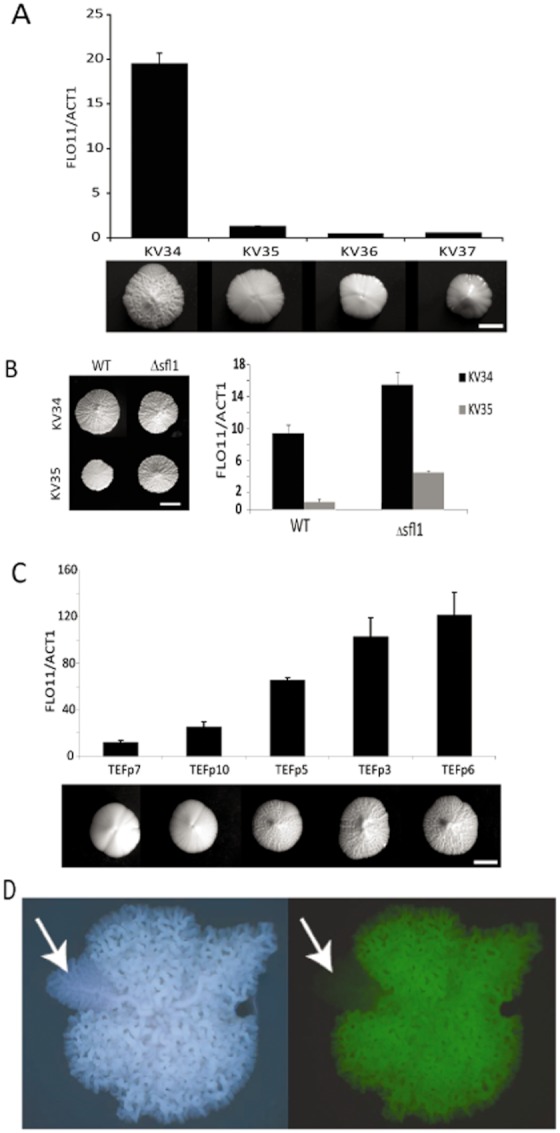
Variation of FLO11 levels and colony morphology.
A. Strains from single tetrads can also exhibit great variety in colony morphology and gene expression. Top, FLO11 gene expression of KV34, KV35, KV36 and KV37, haploids derived from a single tetrad of EM93 diploid strain. Bottom, corresponding photos of the same strains. Both photos and gene expression levels are of colonies grown on YPS agar medium. Scale bar represents 5 mm.
B. De-repressing FLO11 expression increases wrinkliness of a smooth strain. KV34 and KV35 are sister haploid strains derived from the same tetrad of natural isolate strain EM93. KV34 is wrinkly and KV35 is smooth, and this is reflected in the levels of FLO11 expression, with KV34 having higher levels of FLO11. Deletion of SFL1, a repressor of FLO11 expression, raises levels of FLO11 and makes KV35 as wrinkly as KV34. Scale bar represents 5 mm.
C. Increasing FLO11 expression correlates with increasing colony wrinkliness. Replacement of the native FLO11 promoter by a series of constitutive promoters of increasing strength results in a series of strains with increasing wrinkliness. The TEF1prm::FLO11 series was made in the EM93 haploid background. Scale bar represents 5 mm.
D. Flo11 expression correlates with wrinkliness, but is uniform within wrinkly areas of colony. A FLO11–YFP construct was made that incorporated a self-cleaving viral sequence, such that simultaneous expression of Flo11 and YFP was assured without causing interference of Flo11 function. Wrinkly colonies often spawn variants or mutants with smooth morphologies, which results in smooth sectors in growing colonies (arrow in panel D). These sectors are associated with low Flo11 (low YFP) levels. However, closer inspection of wrinkly parts of colonies shows rather homogenous expression of YFP, suggesting that differential expression of FLO11 does not account for patterned growth within a colony (bottom panel).
Second, we constructed a series of mutants wherein we replaced the native FLO11 promoter with a series of TEF1-derived promoters (Nevoigt et al., 2006), that induce a range of gene expression levels, to confirm the correlation of FLO11 expression levels with colony morphology. The resulting strains exhibited increased colony wrinkliness that correlated with increased FLO11 expression (Fig. 3C).
In a third experiment, we investigated FLO11 expression in spontaneous non-wrinkly isolates derived from wrinkly progenitors. Wrinkly colonies often spawn smooth sectors within wrinkly colonies. To investigate if these non-wrinkly mutants were a consequence of FLO11 expression, we first constructed mutants carrying a FLO11–YFP gene fusion. However, the strains carrying the FLO11–YFP fusion formed smooth colonies, indicating that tagging Flo11 with a fluorescent protein results in loss of function of Flo11. We therefore generated mutants carrying a multicistronic gene fusion of the FLO11 gene, a self-cleaving viral peptide (picornaviral 2A peptide), and a yellow fluorescent protein (YFP) (see Experimental procedures for details). In this case, the fluorescent tag is immediately cleaved off after translation, resulting in one separate YFP molecule released in the cytoplasm for every Flo11 protein produced. The resulting strain showed normal colony morphology, indicating that the strategy to preserve Flo11 function worked. Examination of these colonies by fluorescence microscopy showed that Flo11 (as deducted from YFP levels) is present throughout the colony, except in smooth sectors, which showed virtually no fluorescence (Fig. 3D).
In a fourth experiment, the effect of deletion of the nine candidate genes mentioned above on Flo11 expression was examined, using the same cleavable FLO11-2A-YFP construct as discussed above (see Fig. S6). For four of these genes (DFG16, YGR122W, URM1 and the semi-smooth tos1Δ mutants), deletion resulted in lower Flo11 levels, suggesting that the effect of these genes deletions may be directly caused by a reduction in Flo11 levels. Genes whose deletion did not result in reduced Flo11 levels include RVS161 (encoding a cell raft protein involved in structural organization of the cell surface) and 4 genes (ARP8, SDS3, SWC7 and RSC2) involved in chromatin modification, a process known to affect FLO11 expression. It is possible that these genes do not affect the mean FLO11 transcription level in the colony, but rather change the epigenetic inheritance of FLO11 expression and/or cause differential spatial expression levels in the colony, and/or interfere with Flo11 protein processing, transport or incorporation at the cell surface. Alternatively, it is also possible that these genes do not affect FLO11, but rather other genes involved in colony morphology.
To investigate if, apart from FLO11, other genes encoding structural proteins also contribute to colony morphology, we investigated the effect of overexpression of TOS1 and DFG16, two genes encoding cell surface proteins that may also play a structural role in establishing colony morphology (see above). As shown in Fig. S7, colonies overexpressing TOS1 or DFG16 display increased wrinkliness, which is in keep with a putative structural role for these proteins. However, further research is needed to investigate the precise contribution of Tos1 and Dfg16 to colony morphology.
A physiological role of wrinkly colony morphology?
Why do yeast cells form such pronounced, intricate morphologies when they grow on solid substrates? Is this merely a biologically irrelevant consequence of the expression of certain cell-surface proteins such as the Flo11 adhesin? Or do the wrinkles have a biological role? To answer this question, we first tested whether there was a general fitness defect in the smooth flo11 deletion mutants, and we tested whether smooth mutants were more or less resistant to heat and desiccation. The results of these experiments did not reveal any statistically significant difference in fitness between smooth and wrinkly colonies under the conditions tested, even though there seemed to be a trend for wrinkly colonies being more resistant (data not shown).
In another approach, we hypothesized that we might be able to obtain some clues about the possible physiological relevance of wrinkly colony morphology by comparing the transcriptional response of a smooth flo11Δ mutant to that of a wrinkly wild-type colony. In brief, we measured the expression levels of wild-type Sigma 1278b and compared these to the expression level in a flo11Δ mutant by microarray. To investigate whether some of the transcriptional response to flo11Δ is specifically linked to growth as a colony on a solid substrate, we also performed the same comparison between the transcriptomes of planktonic wild-type and flo11 deletion mutants grown in liquid medium. Analysis of the differentially expressed genes (Tables S4 and S5, Fig. S8 and Fig. 4, see also http://homes.esat.kuleuven.be/~kmarchal/Supplementary_Information_DeMaeyer_2012_2013/yeastcolonymorphology/) identified clusters of differentially expressed genes involved in several physiological processes. Interestingly, large clusters of genes show altered gene expression in response to flo11 deletion in both liquid and solid medium, including genes involved in central processes like ion homeostasis, cell–cell adhesion, sexual reproduction, the electron transport chain and oxidation-reduction. Three processes are differentially regulated exclusively in solid medium: carbohydrate transport, thiamine biosynthesis and RNA processing.
Fig. 4.

Overview of genes differentially expressed between a flo11 deletion mutant and a wild-type strain grown on liquid and solid medium. The colour of the core of the genes indicates the differential expression of the genes in liquid, while the colour of the border indicates the differential expression on solid medium. Green indicates under-expression and red overexpression of the flo11 mutant compared with the wild type. Overrepresented GO biological process terms were categorized and overlain onto the network as grey shaded areas. Red edges indicate protein–DNA interactions while green edges indicate protein–protein interactions.
Discussion
Our comprehensive screen shows that colony morphology is regulated by a large number of genes that play central roles in the RIM101, MAPK, TOR and HOG signalling cascades. RIM101 is a pathway induced under alkaline conditions to regulate gene expression (Lamb et al., 2001; Hayashi et al., 2005; Castrejon et al., 2006). The MAPK and TOR pathways are involved in regulating growth, stress resistance and development (sporulation, filamentation) in response to nutrients and growth factors (for recent reviews, see (Madhani, 2000; Chen and Thorner, 2007; Hohmann, 2009; Loewith and Hall, 2011)). The HOG pathway is primarily a sensor of osmotic stress (Saito and Tatebayashi, 2004; Hohmann, 2009). Together, these results indicate that colony development is strongly influenced by environmental parameters, including pH, osmotic pressure and nutrient status. In concordance with this finding, one study has shown that hyper-osmotic stress inhibits the development of the fluffy colony morphology (Furukawa et al., 2009).
Apart from several major signalling pathways, colony morphology is also regulated by proteins involved in post-transcriptional regulation, tRNA modifications and endocytosis. Interestingly, though endocytosis and endosomes have not previously been linked to yeast colony formation, the homologues of some of the respective genes that were identified in our screen have been implicated in hyphae formation in Candida albicans (Sudbery, 2011), suggesting that it is an important process in morphogenic switching and adaptation to the environment. There is a clear link in our network between endocytosis and vacuolar sorting, most likely due to the fact that both processes rely on actin to perform their functions (Olave et al., 2002; Conner and Schmid, 2003; Smythe and Ayscough, 2006; Toret and Drubin, 2006; Zheng et al., 2009; Dion et al., 2010). One possibility is that endocytosis of the Flo11 cell surface adhesin may influence colony morphology (Vopalenska et al., 2010). However, the multitude of genes associated with endocytosis identified in this screen suggest a more complex influence of endocytosis on colony morphology.
Our results confirm that the Flo11 cell surface adhesin protein is a key player in colony development. We also note that the RIM101, cAMP/PKA and MAPK pathways that control colony morphology are also known to regulate FLO11 expression (Pretorius and Bauer, 2002; van Dyk et al., 2005; Castrejon et al., 2006; Vinod et al., 2008; Granek and Magwene, 2010; Bruckner and Mosch, 2011; Granek et al., 2011). Similarly, it is known that chromatin modification is also involved in FLO11 regulation (Halme et al., 2004; Barrales et al., 2008; Bumgarner et al., 2009; Octavio et al., 2009). Together, our results show that yeast colony morphology is controlled by a very large number of genes that are involved in different signalling pathways and biological processes, many of which are known to control FLO11 regulation. Moreover, the results shown in Fig. 3 indicate that changes in FLO11 expression levels generate differences in colony morphology. We believe that these observations at least partly explain the enormous differences in colony morphology that are observed between different S. cerevisiae strains. Analysis of Flo11 levels in different deletion mutants with a smooth colony morphology indicates that FLO11 expression is necessary but not sufficient to establish a wrinkly phenotype. Our data suggest that also a correct spatial expression, proper Flo11 protein processing and/or other additional (still unknown) genes are important. Apart from Flo11, it is possible that other proteins also play a key role, and our results point at Dfg16 and Tos1 as possible candidates.
The remarkably large number of genes that are involved in regulating FLO11 expression create an unusually large ‘mutational target size’ (i.e. the total number of DNA bases that, when mutated, result in changes in FLO11 expression and regulation). In other words, different yeast strains are very likely to carry multiple mutations that affect FLO11 regulation, and this may in turn affect their colony morphology. Hence, colony morphology could in fact be a rather useful proxy for genetic relatedness, indicating that the early microbiology pioneers may have had good reasons to use this criterion to distinguish between strains, isolates and mutants.
It is reassuring to see that our screen confirms some previous observations. Most notably, genes of the RIM101, cAMP and MAPK pathways have been associated with altered colony morphology (both in S. cerevisiae and C. albicans), even though these previous studies did not provide a comprehensive screen of all genes involved in colony development (Su and Mitchell, 1993; Mosch and Fink, 1997; Lamb and Mitchell, 2003; Bharucha et al., 2008; Jin et al., 2008; Granek and Magwene, 2010; Noble et al., 2010; Xu et al., 2010; Granek et al., 2011). It is also striking that many of the genes and pathways that control colony morphology have previously been implicated in the regulation of adhesion, mat formation, and invasive and filamentous growth (see for example Madhani, 2000; Gagiano et al., 2002; Verstrepen and Klis, 2006; Barrales et al., 2008; Reynolds et al., 2008; Verstrepen and Fink, 2009; Bruckner and Mosch, 2011). This suggests that all these phenomena are at least interconnected, or may even be different sides of the same physiological phenomenon.
Our study yields the first comprehensive look at the genetic network underlying yeast colony development but several central questions remain. First, though our study and previous work shows the complexity of the cellular regulation of colony morphology, it is still unclear how the various pathways translate environmental clues into specific colony morphologies. Pioneering work by Palkova and co-workers indicates that colony development depends on complex gradients in nutrients and metabolites (Palkova et al., 1997; 2002; Kuthan et al., 2003; Vachova and Palkova, 2005; Palkova and Vachova, 2006; Vachova et al., 2009a,b; 2011; Vopalenska et al., 2010). A key factor in understanding how a colony develops will require integration of our knowledge on signalling pathways with a detailed study of environmental changes in three-dimensional gradients during colony development. Given that our screen identified many genes involved in endocytosis, it is tempting to speculate that endocytosis plays a central role in colony development. Endocytosis has already been implicated to play a role in the polarized growth of cells in other fungi (Upadhyay and Shaw, 2008) which in turn affects colony morphology (Karunanithi et al., 2010). Clearly, further research is needed to link environmental cues to cellular changes, and to link these cellular changes to colony development.
A second series of unanswered questions revolves around the biological role of colony morphology. It is tempting to speculate that the intricate hub-and-spokes patterns may help to carry water and nutrients from the substrate through the colony, and that the wrinkled surface of a colony may help to increase the surface area for gas exchange. Whereas our transcriptome study indicated that disruption of the wrinkly pattern (by deletion of FLO11) does result in extensive transcriptional reprogramming, it is difficult to pinpoint specific physiological processes. Still, changes in the expression of a large number of genes involved in respiration (mitochondria, respiratory chain, ion homeostasis and oxidation/reduction; see Fig. 4) indicate that FLO11 expression and the wrinkly colony surface may influence the balance between respiration and fermentation. Changes in expression of cell-surface genes involved in adhesion and agglutination indicate that cells adapt their cell surface in response to loss of FLO11 expression. We hope that the genes identified in this study will propel further research into the physiological role of yeast colony formation.
Experimental procedures
Media
Media used in this study consisted of 1% yeast extract, 2% peptone and 2% of either glucose or sucrose (YPD or YPS). Plates of these media were made with 2% agar for standard growth conditions, and with 0.3% agar for growth on low-agar media. YPD containing Hygromycin B (Invitrogen) (200 mg l−1) or G418 (Formedium) (200 mg l−1) were used for selection of yeast transformants. Where noted glucose or sucrose were replaced with other carbon sources, such as maltose, galactose, ethanol or glycerol, to 2% final concentration.
Genome wide screen
All deletion mutants were pinned in triplicate on 2% YPS using a Singer Rotor (Singer Instruments, UK) and grown at 30°C for 10 days before taking pictures. Pictures were assessed and all colonies were given a code based on their morphology. This allowed us to classify the genes according to the colony morphology they confer (Table S1). Gene deletions that gave an altered colony morphology (smooth, semi-smooth, extra wrinkly, small or large) were put in a direct interaction network (Fig. 2).
Construction of the physical interaction network
Protein–protein interactions (PPI) and phosphorylation interactions were extracted from the BioGRID database (Reguly et al., 2006; Stark et al., 2006). Transcription factor–DNA interactions were obtained from Lee et al. (2002), Milo et al. (2002) and MacIsaac et al. (2006). Interactions are represented by edges in the network, while molecular entities (i.e. proteins and genes) are represented by nodes. Each edge (i,j) between a node i and a node j is assigned a weight wij that reflects the probability of interaction between node i and j.
Weights for transcription factor-DNA interactions were determined as in (Yeger-Lotem et al., 2009). For the assignment of weights to PPI and phosphorylation interactions, a naïve Bayesian classifier, that uses the experimental technique(s) by which an interaction was measured as predictors, was implemented. To train the classifier, both a positive interaction set, consisting of literature-curated interactions measured by low-throughput techniques (Reguly et al., 2006), and a negative interaction set, consisting of protein pairs whose most specific co-annotation occurs in GO terms of 1000 total annotations or more (Myers et al., 2005), were compiled.
Additionally, phosphorylation data were added from literature curated interactions (Fiedler et al., 2009) and an ad-hoc probability was assigned to these interactions. Based on the probabilities assigned to edges the network was trimmed to remove interactions with low proof (Yeger-Lotem et al., 2009). Protein complex data were added to the network (Pu et al., 2009).
Network visualization
Network analysis and visualization were performed in Cytoscape (Smoot et al., 2010).
Protein complex association
A cumulative hypergeometric probability was used to assign a P-value to the overrepresentation of complex members in the results of the genetic screen (Rivals et al., 2007). This test represents the probability that at least the same amount of protein members would be present in the screen when the same amount of genes identified in the screen were picked at random. It thus allows to identify protein complexes associated with colony morphology.
Interactive network representation
An interactive version of the physical interaction network with the genes mapped from our genetic screen was developed using Cytoscape Web (Lopes et al., 2011).
GO enrichment
GO enrichment was obtained through the BiNGO plugin (Maere et al., 2005) using a hypergeometric test and a Benjamini–Hochberg correction (Hochberg and Benjamini, 1990). GO annotations for S. cerevisiae were downloaded from the Gene Ontology (Ashburner et al., 2000) website (version 1.1600).
Yeast strains
The whole genome screen was carried out using the Sigma 1278b deletion collection, a collection of 4156 strains, each of which carries a null mutation for one specific non-essential gene (Dowell et al., 2010). For an overview of all yeast strains used in this study see Table S6. Mutant strains were generated by amplifying the HygB cassette (pAG34) and the KANMX cassette (pUG6) from plasmids using primers (Table S7) that contained 60 bp sequence homologous to target DNA. The PCR product was then used for directed integration of the cassette and replacement of target locus. Yeast transformation was carried out using the LiAc procedure (Gietz and Woods, 2006). Transformants were verified by PCR using specific primers.
To obtain a series of mutants showing different levels of FLO11 expression, we integrated a series of modified TEF1 promoters (Nevoigt et al., 2006) directly upstream of the FLO11 ORF. Strains overexpressing TOS1 and DFG16 were created by integrating a modified TEF1 promoter (TEF6 promoter from Nevoigt et al., 2006) directly upstream of the corresponding ORF.
To visualize Flo11 protein levels, we constructed a multicistronic DNA sequence encoding the FLO11 gene, a viral self-cleaving peptide, and a gene encoding a yellow fluorescent protein (YFP). PCR transformation was used to incorporate the picornaviral 2A self-processing peptide sequence (de Felipe et al., 2006) at the 3′ end of the FLO11 ORF. The 2A viral peptide sequence within the resulting FLO11–2A–YFP fusion allows for expression of multiple discrete proteins in equimolar quantities from a single transcript. The fusion construct thus generates a multicistronic mRNA from the FLO11–2A–YFP fusion, which is translated and thought to allow an intra-ribosomal cleavage event on the nascent protein to occur as the 2A peptide is exiting from the ribosome (de Felipe et al., 2006), and thus the two Flo11 and YFP proteins are produced separately. This method allows for a functional Flo11 protein to be expressed at the same time as the YFP so that we could monitor Flo11 expression without interfering with normal Flo11 function. Colony morphology phenotypes were retained in the FLO11–2A–YFP fusion constructs. Conventional fusions of YFP to FLO11 interfered with Flo11 function, and abolished colony morphology phenotypes (data not shown).
Selected deletions (see Fig. S5) were created in the strain containing the FLO11–2A–YFP fusion construct. Yeast colonies grown for 5 days on solid media at 30°C were analysed by flow cytometry to quantify Flo11 expression levels.
Growth assays
Yeast colonies were grown routinely for 5 days at 30°C unless otherwise noted. Yeast mats were grown on YPD or YPS with 0.3% agar for 14 days at room temperature. Colony morphology was assayed on YPS medium (2% agar), and colonies photographed using Nikon AZ100M with DS-R1 camera. Mat/colony area and height were measured with NIS Elements software and graphs were made in Prism with fitted curves.
Desiccation experiments
Cells were plated from liquid YPD culture to form single colonies on a Nylon membrane (Millipore) placed on YPS solid medium and grown for 5 days at 30°C. After growth the membrane was removed and the colonies were placed in an empty Petri dish to dry for 8, 24 or 48h. To assess the number of dead cells within colonies, colonies were scraped off the plates and suspended in GM buffer (glucose 2%, Na-Hepes 10 mM, pH 7) and vortexed vigorously. Cells were stained with Live/Dead yeast viability stain (Invitrogen) with a final concentration of 20 μM and incubated for 30 min at 30°C in the dark. A Nikon TIE inverted scope equipped with a 60× oil objective, mCherry and GFP filter and a Luca R camera was used to determine the number of dead cells in biological triplicates. In all cases at least 300 cells were counted per sample per time point.
Gene expression
Yeast colonies grown for 5 days on solid media at 30°C were harvested and frozen at −80°C in RNALater (Applied Biosystems) before processing for RNA extraction. RNA was extracted from cells by first spheroplasting the yeast cells for 1 h at 37°C using Solution A [Zymolyase, 1 mg ml−1 (MP Biomedicals); sorbitol, 0.9 M; EDTA pH 7.5, 0.1 M; β-mercaptoethanol, 14 mM] and subsequently using an ABI 6100 Nucleic Acid Prep Station and reagents (Applied Biosystems). Synthesis of cDNA was performed using the QuantiTect Reverse Transcription Kit (Qiagen). Real-time quantitative PCR (RT-PCR) was performed using the Power SYBR Green PCR Master Mix (Applied Biosystems). Analysis of FLO11 transcript level was done using primers specific for FLO11 and PCR reactions in a 25 μl volume in an Applied Biosystems StepOnePlus Real-Time OCR System and the following PCR program: 10 min at 95°C, followed by 40 cycles of 95°C for 15 s (melting), and 60°C for 1 min (annealing and extension). Expression values were normalized with levels of expression of a housekeeping gene (ACT1).
Microarray
Yeast colonies were grown for 5 days on YPS at 30°C, harvested and frozen at −80°C before processing for RNA extraction. Total RNA was extracted using the hot phenol extraction method (Guthrie and Fink, 1991) and dissolved in 40 μl RNase free water. Quality control and array were performed by the VIB Micro Array Facility (http://www.microarray.be). The Affymetrix Yeast Genome 2.0 array was used for this experiment. This array contains probe sets to detect transcripts from both S. cerevisiae and Schizosaccharomyces pombe. This array includes approximately 5744 probe sets for 5841 of the 5845 genes present in S. cerevisiae and 5021 probe sets for all 5031 genes present in S. pombe. The sequence information for this array was selected by Affymetrix from the public data sources GenBankR (May 2004) and Sanger Center (June 2004) for the S. cerevisiae and S. pombe genomes respectively. These microarray data have been published in Gene Expression Omnibus under accession number GSE36151. The correlation between the RMA expression values for all samples was computed, and the intensities lower than the background signal (i.e. absent detection call) were omitted. The normalized intensity values over the different conditions were compared using the limma package (Smyth, 2004; Smyth et al., 2005) of the Bioconductor bioinformatics framework. For each of these contrasts, significant deviating values were selected using a moderated t-statistic, and additionally a Benjamini–Hochberg correction (Hochberg and Benjamini, 1990) was performed. Differentially expressed genes were selected based on the corrected P-values (P < 0.05) and a fold-change larger than 2 (log-ratio > 1) (Table S4). ClueGO (Bindea et al., 2009) was used to identify the biological processes, which were overrepresented in the differentially expressed genes between wild type and a flo11 deletion mutant grown on liquid and solid media (Fig. S8). ClueGO was run as an Enrichment/Depletion (two-sided hypergeometric test) test with a Bonferroni correction for GO terms between level 3 and 8, a minimum of 8% of all genes in all groups and a kappa score threshold of 0.3. Finally, the identified GO terms were mapped onto our physical interaction network (Fig. 4).
Acknowledgments
The authors thank Professor Charles Boone for providing access to the Sigma deletion collection, all CMPG members for their help and suggestions and three anonymous reviewers for their useful comments. Research in the lab of K.J.V. is supported by the Human Frontier Science Program, ERC Stg 241426, VIB, EMBO YIP program, K.U.Leuven, FWO, IWT and the AB InBev Baillet-Latour foundation.
Supporting information
Additional supporting information may be found in the online version of this article.
Please note: Wiley-Blackwell are not responsible for the content or functionality of any supporting materials supplied by the authors. Any queries (other than missing material) should be directed to the corresponding author for the article.
References
- Abdullah U, Cullen PJ. The tRNA modification complex elongator regulates the Cdc42-dependent mitogen-activated protein kinase pathway that controls filamentous growth in yeast. Eukaryot Cell. 2009;8:1362–1372. doi: 10.1128/EC.00015-09. [DOI] [PMC free article] [PubMed] [Google Scholar]
- Ashburner M, Ball CA, Blake JA, Botstein D, Butler H, Cherry JM, et al. Gene ontology: tool for the unification of biology. The Gene Ontology Consortium. Nat Genet. 2000;25:25–29. doi: 10.1038/75556. [DOI] [PMC free article] [PubMed] [Google Scholar]
- Barrales RR, Jimenez J, Ibeas JI. Identification of novel activation mechanisms for FLO11 regulation in Saccharomyces cerevisiae. Genetics. 2008;178:145–156. doi: 10.1534/genetics.107.081315. [DOI] [PMC free article] [PubMed] [Google Scholar]
- Bharucha N, Ma J, Dobry CJ, Lawson SK, Yang Z, Kumar A. Analysis of the yeast kinome reveals a network of regulated protein localization during filamentous growth. Mol Biol Cell. 2008;19:2708–2717. doi: 10.1091/mbc.E07-11-1199. [DOI] [PMC free article] [PubMed] [Google Scholar]
- Bindea G, Mlecnik B, Hackl H, Charoentong P, Tosolini M, Kirilovsky A, et al. ClueGO: a Cytoscape plug-in to decipher functionally grouped gene ontology and pathway annotation networks. Bioinformatics. 2009;25:1091–1093. doi: 10.1093/bioinformatics/btp101. [DOI] [PMC free article] [PubMed] [Google Scholar]
- Bruckner S, Mosch HU. Choosing the right lifestyle: adhesion and development in Saccharomyces cerevisiae. FEMS Microbiol Rev. 2011;36:25–58. doi: 10.1111/j.1574-6976.2011.00275.x. [DOI] [PubMed] [Google Scholar]
- Bumgarner SL, Dowell RD, Grisafi P, Gifford DK, Fink GR. Toggle involving cis-interfering noncoding RNAs controls variegated gene expression in yeast. Proc Natl Acad Sci USA. 2009;106:18321–18326. doi: 10.1073/pnas.0909641106. [DOI] [PMC free article] [PubMed] [Google Scholar]
- Burston HE, Maldonado-Baez L, Davey M, Montpetit B, Schluter C, Wendland B, Conibear E. Regulators of yeast endocytosis identified by systematic quantitative analysis. J Cell Biol. 2009;185:1097–1110. doi: 10.1083/jcb.200811116. [DOI] [PMC free article] [PubMed] [Google Scholar]
- Carrozza MJ, Florens L, Swanson SK, Shia WJ, Anderson S, Yates J, et al. Stable incorporation of sequence specific repressors Ash1 and Ume6 into the Rpd3L complex. Biochim Biophys Acta. 2005;1731:77–87. doi: 10.1016/j.bbaexp.2005.09.005. discussion 75–76. [DOI] [PubMed] [Google Scholar]
- Castrejon F, Gomez A, Sanz M, Duran A, Roncero C. The RIM101 pathway contributes to yeast cell wall assembly and its function becomes essential in the absence of mitogen-activated protein kinase Slt2p. Eukaryot Cell. 2006;5:507–517. doi: 10.1128/EC.5.3.507-517.2006. [DOI] [PMC free article] [PubMed] [Google Scholar]
- Chavel CA, Dionne HM, Birkaya B, Joshi J, Cullen PJ. Multiple signals converge on a differentiation MAPK pathway. PLoS Genet. 2010;6:e1000883. doi: 10.1371/journal.pgen.1000883. [DOI] [PMC free article] [PubMed] [Google Scholar]
- Chen RE, Thorner J. Function and regulation in MAPK signalling pathways: lessons learned from the yeast Saccharomyces cerevisiae. Biochim Biophys Acta. 2007;1773:1311–1340. doi: 10.1016/j.bbamcr.2007.05.003. [DOI] [PMC free article] [PubMed] [Google Scholar]
- Conlan RS, Tzamarias D. Sfl1 functions via the co-repressor Ssn6-Tup1 and the cAMP-dependent protein kinase Tpk2. J Mol Biol. 2001;309:1007–1015. doi: 10.1006/jmbi.2001.4742. [DOI] [PubMed] [Google Scholar]
- Conner SD, Schmid SL. Regulated portals of entry into the cell. Nature. 2003;422:37–44. doi: 10.1038/nature01451. [DOI] [PubMed] [Google Scholar]
- Dion V, Shimada K, Gasser SM. Actin-related proteins in the nucleus: life beyond chromatin remodelers. Curr Opin Cell Biol. 2010;22:383–391. doi: 10.1016/j.ceb.2010.02.006. [DOI] [PubMed] [Google Scholar]
- Dowell RD, Ryan O, Jansen A, Cheung D, Agarwala S, Danford T, et al. Genotype to phenotype: a complex problem. Science. 2010;328:469. doi: 10.1126/science.1189015. [DOI] [PMC free article] [PubMed] [Google Scholar]
- van Dyk D, Pretorius IS, Bauer FF. Mss11p is a central element of the regulatory network that controls FLO11 expression and invasive growth in Saccharomyces cerevisiae. Genetics. 2005;169:91–106. doi: 10.1534/genetics.104.033704. [DOI] [PMC free article] [PubMed] [Google Scholar]
- de Felipe P, Luke GA, Hughes LE, Gani D, Halpin C, Ryan MD. E unum pluribus: multiple proteins from a self-processing polyprotein. Trends Biotechnol. 2006;24:68–75. doi: 10.1016/j.tibtech.2005.12.006. [DOI] [PubMed] [Google Scholar]
- Fidalgo M, Barrales RR, Jimenez J. Coding repeat instability in the FLO11 gene of Saccharomyces yeasts. Yeast. 2008;25:879–889. doi: 10.1002/yea.1642. [DOI] [PubMed] [Google Scholar]
- Fiedler D, Braberg H, Mehta M, Chechik G, Cagney G, Mukherjee P, et al. Functional organization of the S. cerevisiae phosphorylation network. Cell. 2009;136:952–963. doi: 10.1016/j.cell.2008.12.039. [DOI] [PMC free article] [PubMed] [Google Scholar]
- Frohlich KU, Madeo F. Apoptosis in yeast – a monocellular organism exhibits altruistic behaviour. FEBS Lett. 2000;473:6–9. doi: 10.1016/s0014-5793(00)01474-5. [DOI] [PubMed] [Google Scholar]
- Furukawa K, Mizushima N, Noda T, Ohsumi Y. A protein conjugation system in yeast with homology to biosynthetic enzyme reaction of prokaryotes. J Biol Chem. 2000;275:7462–7465. doi: 10.1074/jbc.275.11.7462. [DOI] [PubMed] [Google Scholar]
- Furukawa K, Sidoux-Walter F, Hohmann S. Expression of the yeast aquaporin Aqy2 affects cell surface properties under the control of osmoregulatory and morphogenic signalling pathways. Mol Microbiol. 2009;74:1272–1286. doi: 10.1111/j.1365-2958.2009.06933.x. [DOI] [PubMed] [Google Scholar]
- Furukawa K, Furukawa T, Hohmann S. Efficient construction of homozygous diploid strains identifies genes required for the hyper-filamentous phenotype in Saccharomyces cerevisiae. PLoS ONE. 2011;6:e26584. doi: 10.1371/journal.pone.0026584. [DOI] [PMC free article] [PubMed] [Google Scholar]
- Gagiano M, Bauer FF, Pretorius IS. The sensing of nutritional status and the relationship to filamentous growth in Saccharomyces cerevisiae. FEMS Yeast Res. 2002;2:433–470. doi: 10.1111/j.1567-1364.2002.tb00114.x. [DOI] [PubMed] [Google Scholar]
- Gemayel R, Vinces MD, Legendre M, Verstrepen KJ. Variable tandem repeats accelerate evolution of coding and regulatory sequences. Annu Rev Genet. 2010;44:445–477. doi: 10.1146/annurev-genet-072610-155046. [DOI] [PubMed] [Google Scholar]
- Gietz RD, Woods RA. Yeast transformation by the LiAc/SS Carrier DNA/PEG method. Methods Mol Biol. 2006;313:107–120. doi: 10.1385/1-59259-958-3:107. [DOI] [PubMed] [Google Scholar]
- Gimeno CJ, Ljungdahl PO, Styles CA, Fink GR. Unipolar cell divisions in the yeast Saccharomyces cerevisiae lead to filamentous growth-regulation by starvation and Ras. Cell. 1992;68:1077–1090. doi: 10.1016/0092-8674(92)90079-r. [DOI] [PubMed] [Google Scholar]
- Goehring AS, Rivers DM, Sprague GF. Urmylation: a ubiquitin-like pathway that functions during invasive growth and budding in yeast. Mol Biol Cell. 2003;14:4329–4341. doi: 10.1091/mbc.E03-02-0079. [DOI] [PMC free article] [PubMed] [Google Scholar]
- Goossens KV, Stassen C, Stals I, Donohue DS, Devreese B, De Greve H, Willaert RG. The N-terminal domain of the Flo1 flocculation protein from Saccharomyces cerevisiae binds specifically to mannose carbohydrates. Eukaryot Cell. 2011;10:110–117. doi: 10.1128/EC.00185-10. [DOI] [PMC free article] [PubMed] [Google Scholar]
- Granek JA, Magwene PM. Environmental and genetic determinants of colony morphology in yeast. PLoS Genet. 2010;6:e1000823. doi: 10.1371/journal.pgen.1000823. [DOI] [PMC free article] [PubMed] [Google Scholar]
- Granek JA, Kayikci O, Magwene PM. Pleiotropic signalling pathways orchestrate yeast development. Curr Opin Microbiol. 2011;14:676–681. doi: 10.1016/j.mib.2011.09.004. [DOI] [PMC free article] [PubMed] [Google Scholar]
- Grant PA, Schieltz D, Pray-Grant MG, Steger DJ, Reese JC, Yates JR, 3rd, Workman JL. A subset of TAF(II)s are integral components of the SAGA complex required for nucleosome acetylation and transcriptional stimulation. Cell. 1998;94:45–53. doi: 10.1016/s0092-8674(00)81220-9. [DOI] [PubMed] [Google Scholar]
- Gray JV, Ogas JP, Kamada Y, Stone M, Levin DE, Herskowitz I. A role for the Pkc1 MAP kinase pathway of Saccharomyces cerevisiae in bud emergence and identification of a putative upstream regulator. EMBO J. 1997;16:4924–4937. doi: 10.1093/emboj/16.16.4924. [DOI] [PMC free article] [PubMed] [Google Scholar]
- Guthrie C, Fink GR. Guide to Yeast Genetics and Molecular Biology. New York: Academic Press; 1991. [Google Scholar]
- Hall JF. Detection of wild yeast in the brewery. Journal of the Institute of Brewing. 1971;77:513–516. [Google Scholar]
- Halme A, Bumgarner S, Styles C, Fink GR. Genetic and epigenetic regulation of the FLO gene family generates cell-surface variation in yeast. Cell. 2004;116:405–415. doi: 10.1016/s0092-8674(04)00118-7. [DOI] [PubMed] [Google Scholar]
- Hayashi M, Fukuzawa T, Sorimachi H, Maeda T. Constitutive activation of the pH-responsive Rim101 pathway in yeast mutants defective in late steps of the MVB/ESCRT pathway. Mol Cell Biol. 2005;25:9478–9490. doi: 10.1128/MCB.25.21.9478-9490.2005. [DOI] [PMC free article] [PubMed] [Google Scholar]
- Hochberg Y, Benjamini Y. More powerful procedures for multiple significance testing. Stat Med. 1990;9:811–818. doi: 10.1002/sim.4780090710. [DOI] [PubMed] [Google Scholar]
- Hohmann S. Control of high osmolarity signalling in the yeast Saccharomyces cerevisiae. FEBS Lett. 2009;583:4025–4029. doi: 10.1016/j.febslet.2009.10.069. [DOI] [PubMed] [Google Scholar]
- Honigberg SM. Cell signals, cell contacts, and the organization of yeast communities. Eukaryot Cell. 2011;10:466–473. doi: 10.1128/EC.00313-10. [DOI] [PMC free article] [PubMed] [Google Scholar]
- Jin R, Dobry CJ, McCown PJ, Kumar A. Large-scale analysis of yeast filamentous growth by systematic gene disruption and overexpression. Mol Biol Cell. 2008;19:284–296. doi: 10.1091/mbc.E07-05-0519. [DOI] [PMC free article] [PubMed] [Google Scholar]
- Jonsson ZO, Jha S, Wohlschlegel JA, Dutta A. Rvb1p/Rvb2p recruit Arp5p and assemble a functional Ino80 chromatin remodeling complex. Mol Cell. 2004;16:465–477. doi: 10.1016/j.molcel.2004.09.033. [DOI] [PubMed] [Google Scholar]
- Karunanithi S, Vadaie N, Chavel CA, Birkaya B, Joshi J, Grell L, Cullen PJ. Shedding of the mucin-like flocculin Flo11p reveals a new aspect of fungal adhesion regulation. Curr Biol. 2010;20:1389–1395. doi: 10.1016/j.cub.2010.06.033. [DOI] [PMC free article] [PubMed] [Google Scholar]
- Koutelou E, Hirsch CL, Dent SY. Multiple faces of the SAGA complex. Curr Opin Cell Biol. 2010;22:374–382. doi: 10.1016/j.ceb.2010.03.005. [DOI] [PMC free article] [PubMed] [Google Scholar]
- Kuthan M, Devaux F, Janderova B, Slaninova I, Jacq C, Palkova Z. Domestication of wild Saccharomyces cerevisiae is accompanied by changes in gene expression and colony morphology. Mol Microbiol. 2003;47:745–754. doi: 10.1046/j.1365-2958.2003.03332.x. [DOI] [PubMed] [Google Scholar]
- Lamb TM, Mitchell AP. The transcription factor Rim101p governs ion tolerance and cell differentiation by direct repression of the regulatory genes NRG1 and SMP1 in Saccharomyces cerevisiae. Mol Cell Biol. 2003;23:677–686. doi: 10.1128/MCB.23.2.677-686.2003. [DOI] [PMC free article] [PubMed] [Google Scholar]
- Lamb TM, Xu W, Diamond A, Mitchell A. Alkaline response genes of Saccharomyces cerevisiae and their relationship to the RIM101 pathway. J Biol Chem. 2001;276:1850–1856. doi: 10.1074/jbc.M008381200. [DOI] [PubMed] [Google Scholar]
- Lambrechts MG, Bauer FF, Marmur J, Pretorius IS. Muc1, a mucin-like protein that is regulated by Mss10, is critical for pseudohyphal differentiation in yeast. Proc Natl Acad Sci USA. 1996;93:8419–8424. doi: 10.1073/pnas.93.16.8419. [DOI] [PMC free article] [PubMed] [Google Scholar]
- Lee TI, Rinaldi NJ, Robert F, Odom DT, Bar-Joseph Z, Gerber GK, et al. Transcriptional regulatory networks in Saccharomyces cerevisiae. Science. 2002;298:799–804. doi: 10.1126/science.1075090. [DOI] [PubMed] [Google Scholar]
- Liu H, Styles CA, Fink GR. Saccharomyces cerevisiae S288C has a mutation in FLO8, a gene required for filamentous growth. Genetics. 1996;144:967–978. doi: 10.1093/genetics/144.3.967. [DOI] [PMC free article] [PubMed] [Google Scholar]
- Lo WS, Dranginis AM. FLO11, a yeast gene related to the STA genes, encodes a novel cell surface flocculin. J Bacteriol. 1996;178:7144–7151. doi: 10.1128/jb.178.24.7144-7151.1996. [DOI] [PMC free article] [PubMed] [Google Scholar]
- Loewith R, Hall MN. Target of rapamycin (TOR) in nutrient signalling and growth control. Genetics. 2011;189:1177–1201. doi: 10.1534/genetics.111.133363. [DOI] [PMC free article] [PubMed] [Google Scholar]
- Lopes P, Dalgleish R, Oliveira JL. WAVe: web analysis of the variome. Hum Mutat. 2011;32:729–734. doi: 10.1002/humu.21499. [DOI] [PubMed] [Google Scholar]
- MacIsaac KD, Wang T, Gordon DB, Gifford DK, Stormo GD, Fraenkel E. An improved map of conserved regulatory sites for Saccharomyces cerevisiae. BMC Bioinformatics. 2006;7:113. doi: 10.1186/1471-2105-7-113. [DOI] [PMC free article] [PubMed] [Google Scholar]
- Madhani HD. Interplay of intrinsic and extrinsic signals in yeast differentiation. Proc Natl Acad Sci USA. 2000;97:13461–13463. doi: 10.1073/pnas.011511198. [DOI] [PMC free article] [PubMed] [Google Scholar]
- Maere S, Heymans K, Kuiper M. BiNGO: a Cytoscape plugin to assess overrepresentation of gene ontology categories in biological networks. Bioinformatics. 2005;21:3448–3449. doi: 10.1093/bioinformatics/bti551. [DOI] [PubMed] [Google Scholar]
- Mapes J, Ota IM. Nbp2 targets the Ptc1-type 2C Ser/Thr phosphatase to the HOG MAPK pathway. EMBO J. 2004;23:302–311. doi: 10.1038/sj.emboj.7600036. [DOI] [PMC free article] [PubMed] [Google Scholar]
- Milo R, Shen-Orr S, Itzkovitz S, Kashtan N, Chklovskii D, Alon U. Network motifs: simple building blocks of complex networks. Science. 2002;298:824–827. doi: 10.1126/science.298.5594.824. [DOI] [PubMed] [Google Scholar]
- Minarikova L, Kuthan M, Ricicova M, Forstova J, Palkova Z. Differentiated gene expression in cells within yeast colonies. Exp Cell Res. 2001;271:296–304. doi: 10.1006/excr.2001.5379. [DOI] [PubMed] [Google Scholar]
- Mortimer RK, Johnston JR. Genealogy of principal strains of the yeast genetic stock center. Genetics. 1986;113:35–43. doi: 10.1093/genetics/113.1.35. [DOI] [PMC free article] [PubMed] [Google Scholar]
- Mosch HU, Fink GR. Dissection of filamentous growth by transposon mutagenesis in Saccharomyces cerevisiae. Genetics. 1997;145:671–684. doi: 10.1093/genetics/145.3.671. [DOI] [PMC free article] [PubMed] [Google Scholar]
- Mosch HU, Kubler E, Krappmann S, Fink GR, Braus GH. Crosstalk between the Ras2p-controlled mitogen-activated protein kinase and cAMP pathways during invasive growth of Saccharomyces cerevisiae. Mol Biol Cell. 1999;10:1325–1335. doi: 10.1091/mbc.10.5.1325. [DOI] [PMC free article] [PubMed] [Google Scholar]
- Myers CL, Robson D, Wible A, Hibbs MA, Chiriac C, Theesfeld CL, et al. Discovery of biological networks from diverse functional genomic data. Genome Biol. 2005;6:R114. doi: 10.1186/gb-2005-6-13-r114. [DOI] [PMC free article] [PubMed] [Google Scholar]
- Nakamura N, Matsuura A, Wada Y, Ohsumi Y. Acidification of vacuoles is required for autophagic degradation in the yeast, Saccharomyces cerevisiae. J Biochem. 1997;121:338–344. doi: 10.1093/oxfordjournals.jbchem.a021592. [DOI] [PubMed] [Google Scholar]
- Nevoigt E, Kohnke J, Fischer CR, Alper H, Stahl U, Stephanopoulos G. Engineering of promoter replacement cassettes for fine-tuning of gene expression in Saccharomyces cerevisiae. Appl Environ Microbiol. 2006;72:5266–5273. doi: 10.1128/AEM.00530-06. [DOI] [PMC free article] [PubMed] [Google Scholar]
- Noble SM, French S, Kohn LA, Chen V, Johnson AD. Systematic screens of a Candida albicans homozygous deletion library decouple morphogenetic switching and pathogenicity. Nat Genet. 2010;42:590–598. doi: 10.1038/ng.605. [DOI] [PMC free article] [PubMed] [Google Scholar]
- Octavio LM, Gedeon K, Maheshri N. Epigenetic and conventional regulation is distributed among activators of FLO11 allowing tuning of population-level heterogeneity in its expression. PLoS Genet. 2009;5:e1000673. doi: 10.1371/journal.pgen.1000673. [DOI] [PMC free article] [PubMed] [Google Scholar]
- Ohkuni K, Hayashi M, Yamashita I. Bicarbonate-mediated social communication stimulates meiosis and sporulation of Saccharomyces cerevisiae. Yeast. 1998;14:623–631. doi: 10.1002/(SICI)1097-0061(199805)14:7<623::AID-YEA264>3.0.CO;2-D. [DOI] [PubMed] [Google Scholar]
- Olave IA, Reck-Peterson SL, Crabtree GR. Nuclear actin and actin-related proteins in chromatin remodeling. Annu Rev Biochem. 2002;71:755–781. doi: 10.1146/annurev.biochem.71.110601.135507. [DOI] [PubMed] [Google Scholar]
- Palkova Z, Vachova L. Life within a community: benefit to yeast long-term survival. FEMS Microbiol Rev. 2006;30:806–824. doi: 10.1111/j.1574-6976.2006.00034.x. [DOI] [PubMed] [Google Scholar]
- Palkova Z, Janderova B, Gabriel J, Zikanova B, Pospisek M, Forstova J. Ammonia mediates communication between yeast colonies. Nature. 1997;390:532–536. doi: 10.1038/37398. [DOI] [PubMed] [Google Scholar]
- Palkova Z, Devaux F, Icicova M, Minarikova L, Crom SL, Jacq C. Ammonia pulses and metabolic oscillations guide yeast colony development. Mol Biol Cell. 2002;13:3901–3914. doi: 10.1091/mbc.E01-12-0149. [DOI] [PMC free article] [PubMed] [Google Scholar]
- Pedrioli PG, Leidel S, Hofmann K. Urm1 at the crossroad of modifications. ‘Protein Modifications: Beyond the Usual Suspects’ Review Series. EMBO Rep. 2008;9:1196–1202. doi: 10.1038/embor.2008.209. [DOI] [PMC free article] [PubMed] [Google Scholar]
- Peplowska K, Markgraf DF, Ostrowicz CW, Bange G, Ungermann C. The CORVET tethering complex interacts with the yeast Rab5 homolog Vps21 and is involved in endo-lysosomal biogenesis. Dev Cell. 2007;12:739–750. doi: 10.1016/j.devcel.2007.03.006. [DOI] [PubMed] [Google Scholar]
- Piccirillo S, Honigberg SM. Sporulation patterning and invasive growth in wild and domesticated yeast colonies. Res Microbiol. 2010;161:390–398. doi: 10.1016/j.resmic.2010.04.001. [DOI] [PMC free article] [PubMed] [Google Scholar]
- Polevoda B, Sherman F. Composition and function of the eukaryotic N-terminal acetyltransferase subunits. Biochem Biophys Res Commun. 2003;308:1–11. doi: 10.1016/s0006-291x(03)01316-0. [DOI] [PubMed] [Google Scholar]
- Polevoda B, Cardillo TS, Doyle TC, Bedi GS, Sherman F. Nat3p and Mdm20p are required for function of yeast NatB Nalpha-terminal acetyltransferase and of actin and tropomyosin. J Biol Chem. 2003;278:30686–30697. doi: 10.1074/jbc.M304690200. [DOI] [PubMed] [Google Scholar]
- Posas F, Takekawa M, Saito H. Signal transduction by MAP kinase cascades in budding yeast. Curr Opin Microbiol. 1998;1:175–182. doi: 10.1016/s1369-5274(98)80008-8. [DOI] [PubMed] [Google Scholar]
- Pretorius IS, Bauer FF. Meeting the consumer challenge through genetically customized wine-yeast strains. Trends Biotechnol. 2002;20:426–432. doi: 10.1016/s0167-7799(02)02049-8. [DOI] [PubMed] [Google Scholar]
- Pu S, Wong J, Turner B, Cho E, Wodak SJ. Up-to-date catalogues of yeast protein complexes. Nucleic Acids Res. 2009;37:825–831. doi: 10.1093/nar/gkn1005. [DOI] [PMC free article] [PubMed] [Google Scholar]
- Reguly T, Breitkreutz A, Boucher L, Breitkreutz BJ, Hon GC, Myers CL, et al. Comprehensive curation and analysis of global interaction networks in Saccharomyces cerevisiae. J Biol. 2006;5:11.1–11.28. doi: 10.1186/jbiol36. [DOI] [PMC free article] [PubMed] [Google Scholar]
- Reynolds TB. The Opi1p transcription factor affects expression of FLO11, mat formation, and invasive growth in Saccharomyces cerevisiae. Eukaryot Cell. 2006;5:1266–1275. doi: 10.1128/EC.00022-06. [DOI] [PMC free article] [PubMed] [Google Scholar]
- Reynolds TB, Fink GR. Bakers' yeast, a model for fungal biofilm formation. Science. 2001;291:878–881. doi: 10.1126/science.291.5505.878. [DOI] [PubMed] [Google Scholar]
- Reynolds TB, Jansen A, Peng X, Fink GR. Mat formation in Saccharomyces cerevisiae requires nutrient and pH gradients. Eukaryot Cell. 2008;7:122–130. doi: 10.1128/EC.00310-06. [DOI] [PMC free article] [PubMed] [Google Scholar]
- Rivals I, Personnaz L, Taing L, Potier MC. Enrichment or depletion of a GO category within a class of genes: which test? Bioinformatics. 2007;23:401–407. doi: 10.1093/bioinformatics/btl633. [DOI] [PubMed] [Google Scholar]
- Robertson AS, Smythe E, Ayscough KR. Functions of actin in endocytosis. Cell Mol Life Sci. 2009;66:2049–2065. doi: 10.1007/s00018-009-0001-y. [DOI] [PMC free article] [PubMed] [Google Scholar]
- Rupp S, Summers E, Lo HJ, Madhani H, Fink G. MAP kinase and cAMP filamentation signalling pathways converge on the unusually large promoter of the yeast FLO11 gene. EMBO J. 1999;18:1257–1269. doi: 10.1093/emboj/18.5.1257. [DOI] [PMC free article] [PubMed] [Google Scholar]
- Saito H. Regulation of cross-talk in yeast MAPK signalling pathways. Curr Opin Microbiol. 2010;13:677–683. doi: 10.1016/j.mib.2010.09.001. [DOI] [PubMed] [Google Scholar]
- Saito H, Tatebayashi K. Regulation of the osmoregulatory HOG MAPK cascade in yeast. J Biochem. 2004;136:267–272. doi: 10.1093/jb/mvh135. [DOI] [PubMed] [Google Scholar]
- Santt O, Pfirrmann T, Braun B, Juretschke J, Kimmig P, Scheel H, et al. The yeast GID complex, a novel ubiquitin ligase (E3) involved in the regulation of carbohydrate metabolism. Mol Biol Cell. 2008;19:3323–3333. doi: 10.1091/mbc.E08-03-0328. [DOI] [PMC free article] [PubMed] [Google Scholar]
- Sarode N, Miracle B, Peng X, Ryan O, Reynolds TB. Vacuolar protein sorting genes regulate mat formation in Saccharomyces cerevisiae by Flo11p-dependent and -independent mechanisms. Eukaryot Cell. 2011;10:1516–1526. doi: 10.1128/EC.05078-11. [DOI] [PMC free article] [PubMed] [Google Scholar]
- Scherz R, Shinder V, Engelberg D. Anatomical analysis of Saccharomyces cerevisiae stalk-like structures reveals spatial organization and cell specialization. J Bacteriol. 2001;183:5402–5413. doi: 10.1128/JB.183.18.5402-5413.2001. [DOI] [PMC free article] [PubMed] [Google Scholar]
- Smoot ME, Ono K, Ruscheinski J, Wang PL, Ideker T. Cytoscape 2.8: new features for data integration and network visualization. Bioinformatics. 2010;27:431–432. doi: 10.1093/bioinformatics/btq675. [DOI] [PMC free article] [PubMed] [Google Scholar]
- Smyth GK. Linear models and empirical bayes methods for assessing differential expression in microarray experiments. Stat Appl Genet Mol Biol. 2004;3:Article 3. doi: 10.2202/1544-6115.1027. [DOI] [PubMed] [Google Scholar]
- Smyth GK, Michaud J, Scott HS. Use of within-array replicate spots for assessing differential expression in microarray experiments. Bioinformatics. 2005;21:2067–2075. doi: 10.1093/bioinformatics/bti270. [DOI] [PubMed] [Google Scholar]
- Smythe E, Ayscough KR. Actin regulation in endocytosis. J Cell Sci. 2006;119:4589–4598. doi: 10.1242/jcs.03247. [DOI] [PubMed] [Google Scholar]
- Spencer J, Spencer D. Yeasts in Artificial and Natural Habitats. Berlin, Heidelberg: Springer; 1997. p. 396. [Google Scholar]
- Stark C, Breitkreutz BJ, Reguly T, Boucher L, Breitkreutz A, Tyers M. BioGRID: a general repository for interaction datasets. Nucleic Acids Res. 2006;34:D535–D539. doi: 10.1093/nar/gkj109. [DOI] [PMC free article] [PubMed] [Google Scholar]
- Su SS, Mitchell A. Identification of functionally related genes that stimulate early meiotic gene expression in yeast. Genetics. 1993;133:67–77. doi: 10.1093/genetics/133.1.67. [DOI] [PMC free article] [PubMed] [Google Scholar]
- Sudbery PE. Growth of Candida albicans hyphae. Nat Rev Microbiol. 2011;9:737–748. doi: 10.1038/nrmicro2636. [DOI] [PubMed] [Google Scholar]
- Terashima H, Fukuchi S, Nakai K, Arisawa M, Hamada K, Yabuki N, Kitada K. Sequence-based approach for identification of cell wall proteins in Saccharomyces cerevisiae. Curr Genet. 2002;40:311–316. doi: 10.1007/s00294-001-0264-9. [DOI] [PubMed] [Google Scholar]
- Toret CP, Drubin DG. The budding yeast endocytic pathway. J Cell Sci. 2006;119:4585–4587. doi: 10.1242/jcs.03251. [DOI] [PubMed] [Google Scholar]
- Upadhyay S, Shaw BD. The role of actin, fimbrin and endocytosis in growth of hyphae in Aspergillus nidulans. Mol Microbiol. 2008;68:690–705. doi: 10.1111/j.1365-2958.2008.06178.x. [DOI] [PubMed] [Google Scholar]
- Vachova L, Palkova Z. Physiological regulation of yeast cell death in multicellular colonies is triggered by ammonia. J Cell Biol. 2005;169:711–717. doi: 10.1083/jcb.200410064. [DOI] [PMC free article] [PubMed] [Google Scholar]
- Vachova L, Kucerova H, Devaux F, Ulehlova M, Palkova Z. Metabolic diversification of cells during the development of yeast colonies. Environ Microbiol. 2009a;11:494–504. doi: 10.1111/j.1462-2920.2008.01789.x. [DOI] [PubMed] [Google Scholar]
- Vachova L, Chernyavskiy O, Strachotova D, Bianchini P, Burdikova Z, Fercikova I, et al. Architecture of developing multicellular yeast colony: spatio-temporal expression of Ato1p ammonium exporter. Environ Microbiol. 2009b;7:1866–1877. doi: 10.1111/j.1462-2920.2009.01911.x. [DOI] [PubMed] [Google Scholar]
- Vachova L, Stovicek V, Hlavacek O, Chernyavskiy O, Stepanek L, Kubinova L, Palkova Z. Flo11p, drug efflux pumps, and the extracellular matrix cooperate to form biofilm yeast colonies. J Cell Biol. 2011;194:679–687. doi: 10.1083/jcb.201103129. [DOI] [PMC free article] [PubMed] [Google Scholar]
- Van Mulders SE, Christianen E, Saerens SM, Daenen L, Verbelen PJ, Willaert R, et al. Phenotypic diversity of Flo protein family-mediated adhesion in Saccharomyces cerevisiae. FEMS Yeast Res. 2009;9:178–190. doi: 10.1111/j.1567-1364.2008.00462.x. [DOI] [PubMed] [Google Scholar]
- Varon M, Choder M. Organization and cell–cell interaction in starved Saccharomyces cerevisiae colonies. J Bacteriol. 2000;182:3877–3880. doi: 10.1128/jb.182.13.3877-3880.2000. [DOI] [PMC free article] [PubMed] [Google Scholar]
- Veelders M, Bruckner S, Ott D, Unverzagt C, Mosch HU, Essen LO. Structural basis of flocculin-mediated social behavior in yeast. Proc Natl Acad Sci USA. 2010;107:22511–22516. doi: 10.1073/pnas.1013210108. [DOI] [PMC free article] [PubMed] [Google Scholar]
- Verstrepen KJ, Fink GR. Genetic and epigenetic mechanisms underlying cell-surface variability in protozoa and fungi. Annu Rev Genet. 2009;43:1–24. doi: 10.1146/annurev-genet-102108-134156. [DOI] [PubMed] [Google Scholar]
- Verstrepen KJ, Klis FM. Flocculation, adhesion and biofilm formation in yeasts. Mol Microbiol. 2006;60:5–15. doi: 10.1111/j.1365-2958.2006.05072.x. [DOI] [PubMed] [Google Scholar]
- Verstrepen KJ, Jansen A, Lewitter F, Fink GR. Intragenic tandem repeats generate functional variability. Nat Genet. 2005;37:986–990. doi: 10.1038/ng1618. [DOI] [PMC free article] [PubMed] [Google Scholar]
- Vinod PK, Venkatesh KV. A steady state model for the transcriptional regulation of filamentous growth in Saccharomyces cerevisiae. In Silico Biol. 2008;8:207–222. [PubMed] [Google Scholar]
- Vinod PK, Sengupta N, Bhat PJ, Venkatesh KV. Integration of global signalling pathways, cAMP-PKA, MAPK and TOR in the regulation of FLO11. PLoS ONE. 2008;3:e1663. doi: 10.1371/journal.pone.0001663. [DOI] [PMC free article] [PubMed] [Google Scholar]
- Vopalenska I, St'ovicek V, Janderova B, Vachova L, Palkova Z. Role of distinct dimorphic transitions in territory colonizing and formation of yeast colony architecture. Environ Microbiol. 2010;12:264–277. doi: 10.1111/j.1462-2920.2009.02067.x. [DOI] [PubMed] [Google Scholar]
- Vyas VK, Kuchin S, Berkey CD, Carlson M. Snf1 kinases with different beta-subunit isoforms play distinct roles in regulating haploid invasive growth. Mol Cell Biol. 2003;23:1341–1348. doi: 10.1128/MCB.23.4.1341-1348.2003. [DOI] [PMC free article] [PubMed] [Google Scholar]
- Xu T, Shively CA, Jin R, Eckwahl MJ, Dobry CJ, Song Q, Kumar A. A profile of differentially abundant proteins at the yeast cell periphery during pseudohyphal growth. J Biol Chem. 2010;285:15476–15488. doi: 10.1074/jbc.M110.114926. [DOI] [PMC free article] [PubMed] [Google Scholar]
- Yeger-Lotem E, Riva L, Su LJ, Gitler AD, Cashikar AG, King OD, et al. Bridging high-throughput genetic and transcriptional data reveals cellular responses to alpha-synuclein toxicity. Nat Genet. 2009;41:316–323. doi: 10.1038/ng.337. [DOI] [PMC free article] [PubMed] [Google Scholar]
- Youn JY, Friesen H, Kishimoto T, Henne WM, Kurat CF, Ye W, et al. Dissecting BAR domain function in the yeast Amphiphysins Rvs161 and Rvs167 during endocytosis. Mol Biol Cell. 2010;21:3054–3069. doi: 10.1091/mbc.E10-03-0181. [DOI] [PMC free article] [PubMed] [Google Scholar]
- Zheng B, Han M, Bernier M, Wen JK. Nuclear actin and actin-binding proteins in the regulation of transcription and gene expression. FEBS J. 2009;276:2669–2685. doi: 10.1111/j.1742-4658.2009.06986.x. [DOI] [PMC free article] [PubMed] [Google Scholar]
Associated Data
This section collects any data citations, data availability statements, or supplementary materials included in this article.