Abstract
A high pulse repetition frequency ultrasound system for ex vivo measurement of mechanical properties of animal crystalline lens was developed and validated. We measured the bulk displacement of laser-induced microbubbles created at different positions within the lens using nanosecond laser pulses. An impulsive acoustic radiation force was applied to the microbubble, and spatio-temporal measurements of the microbubble displacement were assessed using a custom-made high pulse repetition frequency ultrasound system consisting of two 25 MHz focused ultrasound transducers. One of these transducers was used to emit a train of ultrasound pulses and another transducer was used to receive the ultrasound echoes reflected from the microbubble. The developed system was operating at 1 MHz pulse repetition frequency. Based on measured motion of the microbubble, the Young’s moduli of surrounding tissue were reconstructed and the values were compared with those measured using indentation test. Measured values of Young’s moduli of 4 bovine lenses ranged from 2.6±0.1 to 26±1.4 kPa and there was good agreement between the two methods. Therefore, our studies, utilizing the high pulse repetition frequency ultrasound system, suggest that the developed approach can be used to assess the mechanical properties of ex vivo crystalline lenses. Furthermore, the potential of the presented approach for in vivo measurements is discussed.
Keywords: Mechanical property, Crystalline lens, High pulse repetition frequency ultrasound system, Laser-induced microbubble, Acoustic radiation force
1. Introduction
Detailed measurements of mechanical properties of the crystalline lens precede comprehensive understandings of the mechanism of accommodation and the development of age-related loss of accommodation power, a condition referred to as presbyopia. It is commonly agreed upon that the changes in viscoelastic properties of the lens play a major role in the development of presbyopia (Pau and Kranz 1991, Heys et al 2004, Charman 2008, Glasser et al 2001). The measurement of the mechanical properties of the crystalline lens in vivo could significantly help in understanding the accommodative mechanism of the human eye and in developing new approaches for presbyopia treatment (Glasser 2008).
Numerous experimental approaches have been developed to assess the mechanical properties of lenses: ultrasonic characterization of the lens using ultrasound wave attenuation (Tabandeh et al 2000); compression tests (Kikkawa and Sato 1963, Sharma et al 2011); application of radial force (Fisher 1971, Fisher 1973, Burd et al 2011); hydrostatic or automated guillotine tests (Heyworth et al 1993, Assia et al 1997) (Heyworth et al 1993, Assia et al 1997); uniaxial test (van Alphen and Graebel 1991); cone penetration test (Pau and Kranz 1991); and dynamic mechanical analysis (Soergel et al 1999, Heys et al 2004, Weeber et al 2007). However, there are several shortcomings in these measurement techniques. Most of them provide averaged mechanical properties of the whole lens. Even though some studies showed local stiffness gradients within the crystalline lenses (Heys et al 2004, Weeber et al 2007), fragmented lenses induced changes in the mechanical properties during handling and preparation of the experiments. Moreover, these limitations restrict measurement techniques to be used only for in vitro studies.
To overcome these disadvantages, microbubble-based acoustic radiation force method was introduced as a technique to remotely measure the localized viscoelastic properties of the crystalline lens by combining microbubbles created by laser-induced optical breakdown and acoustic radiation force (Milas et al 2003a, Milas et al 2003b, Erpelding et al 2005, Erpelding et al 2007, Hollman et al 2007). Using a bubble-based technique for both porcine and human crystalline lenses permitted measurement of age-related changes in the spatial distribution of elastic properties within lenses (Erpelding et al 2007, Hollman et al 2007). In these studies, estimation of the elastic properties was performed by the measurement of maximum displacement of microbubbles interrogated by long acoustic pulse. It was shown that maximum bubble displacements are inversely proportional to the local elasticity and Young’s modulus can be measured if the magnitude of acoustic radiation force on the bubble surface is known. However, the measurement or estimation of the acoustic radiation force delivered to the microbubble is a significant challenge because of generally unknown attenuation of surrounding tissue. This difficulty can be solved using the time characteristics of the dynamics of the microbubble, which also depend on the mechanical properties of surrounding tissue (Sarvazyan et al 1998), as it was shown in our previous works (Yoon et al 2011, Ilinskii et al 2005, Aglyamov et al 2007, Karpiouk et al 2009). Indeed, changes in the magnitude of an acoustic pulse applied to the microbubble do not affect the temporal characteristics of the microbubble displacement (e.g., time to reach its maximum displacement) because the magnitude of acoustic pulse acts as a scaling factor.
Our previous results showed that the elasticity measurements based on temporal characteristics of the bubble motion are very sensitive to the duration of acoustic radiation force and the temporal resolution of the ultrasound experimental system. (Aglyamov et al 2007, Karpiouk et al 2009, Yoon et al 2011). If small bubbles are used, we can significantly increase the sensitivity of the measurements by using impulsive acoustic radiation force. The difference between the end of acoustic pulse and the time of maximum displacement increases when the duration of acoustic pulse decreases, while the sensitivity of the approach increases due to the large difference between these two values. However, the use of the short acoustic radiation force for interrogating bubble produces large errors of measurements of the time of maximum displacement. As a result, this induces larger error in the Young’s modulus estimation. Therefore an ultrasound system with high pulse repetition frequency (PRF) is required to accurately measure mechanical properties of the tissue surrounding the microbubble.
In this paper, we present and verify our high PRF ultrasound system to measure the mechanical properties of ex vivo animal crystalline lens. We measured Young’s moduli of four different bovine lenses at different locations within lenses. Measured values of Young’s moduli were ranged from 2.6±0.1 to 26.0±1.4 kPa. The obtained values were compared with the results of indentation tests, and a good agreement between the methods was demonstrated.
2. Materials and methods
2.1. Overall experimental settings
To verify the theoretical model and a high pulse repetition frequency ultrasound system in ex vivo animal crystalline lens, the experiments were performed using a laser-induced microbubble interrogated by impulsive acoustic radiation force. The validation procedure consisted of two consecutive experiments: 1) microbubble-based measurements with a high PRF ultrasound system and 2) indentation tests for reference measurements with the bench-top uniaxial tester In-Spec 2200 (Instron, Inc., Morwood, MA). The same animal lenses were used for both steps. Young’s modulus of ex vivo animal lenses was reconstructed based on the microbubble experiments and compared with the results of the indentation test.
During the experiments, four testing procedures were carried out: performance of high PRF system was investigated, accuracy of indentation test was explored, boundary effects on the indentation test results were examined, and time effects on the changes of the mechanical properties of ex vivo animal crystalline lens were identified.
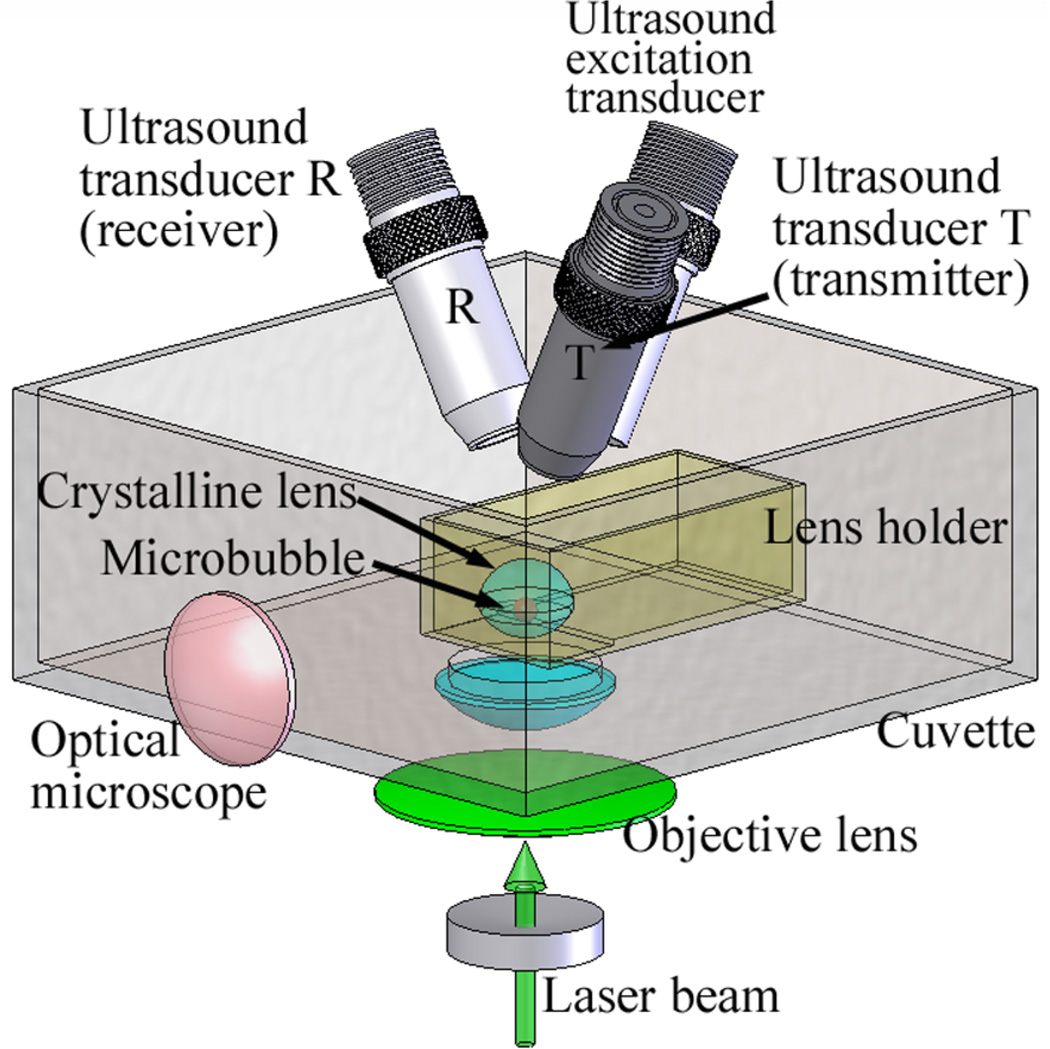
We designed and built (figure 1) an experimental system for the microbubble-based acoustic radiation force experiments. A Nd:YAG laser pulse (Polaris II, Fremont, CA) with 5 ns pulse duration, 532 nm wavelength, and 10 mJ energy was focused by a custom-built objective lens (1.13 numerical aperture (NA) and 8.0 mm working distance) to produce a microbubble inside the crystalline lens. A high NA was used to control the size and shape of the microbubbles (Vogel et al 2005). The size of the microbubbles was also observed using an optical microscope (Dino-Lite AM411T, Wirtz, VA) operating at 230x magnification.
Figure 1.
A schematic view of the experimental setup. A crystalline lens with anterior surface facing down was positioned in the lens holder, and a microbubble was produced by a focused laser beam inside a lens. A 3.7 MHz excitation transducer was used to generate acoustic radiation force applied to a microbubble. The motion of a microbubble was tracked by two 25 MHz ultrasound transducers (T and R) – separation of transmit (T) and receive (R) transducers allowed for high (up to 1 MHz) pulse repetition frequency. In addition to ultrasound measurements, the size of the microbubble was also observed using an optical microscope.
A cuvette with a hole for laser beam delivery was fixed to the standing post and it was filled with the phosphate buffered saline (Sigma-Aldrich, Inc., St Louis, MO) to minimize the changes of the mechanical properties of the lens during the experiments. A crystalline lens with anterior surface facing down was positioned in the lens holder. The lens holder, attached to 3D translation stages, was placed inside the cuvette. A microbubble was produced by a focused laser beam inside the lens. The lens holder was moved during the experiments to generate microbubbles at different locations in the crystalline lens. A 3.7 MHz transducer (F/#=2 and bandwidth=17%, Valpey Fisher, Hopkinton, MA) and two 25 MHz transducers (F/#=4 and bandwidth=51%, Olympus- NDT, Waltham, MA) with focal lengths of 25.4 mm were located at the top of the cuvette. The angle between two 25 MHz transducers was 35°. The angle between the 3.7 MHz transducer and the plane made by two 25 MHz transducers was also 35°. The foci of three transducers were aligned at the location of the microbubble.
The 3.7 MHz excitation transducer, connected to RF power amplifier (ENI model 2100L, ENI, Rochester, NY) with 50 dB gain, was used to generate impulsive acoustic radiation force and to displace a laser-induced microbubble. The duration of the acoustic radiation pulse was varied from 10 µs for phantom studies to 30 µs for ex vivo experiments. Because ultrasound attenuation was too high in the ex vivo crystalline lenses, the duration of acoustic pulse that induced observable displacement of a microbubble was changed from 10 µs to 30 µs.
The experimental setup was similar to the setup described in Yoon et al 2011. The main difference between the previous setup and the current setup was that an additional ultrasound transducer was included so that the motion of the microbubble was tracked by two 25 MHz ultrasound transducers (T and R). By separating ultrasound transducers T (transmit) and R (receive), we could achieve high pulse repetition frequency, up to 1 MHz.
Reconstruction of Young’s moduli of phantoms and animal crystalline lenses using microbubble approach was performed by finding the best fit between displacement profiles measured by the microbubble experiments and calculated by theory (Yoon et al 2011). Once the experimentally measured time required for a microbubble to reach its maximum displacement (tmax) was matched to the theoretically calculated tmax, the value of the scaling factor of acoustic radiation force was chosen to match experimentally observed displacements with theoretically calculated displacements. The shear viscosity was evaluated by comparing decaying profiles of microbubble displacements from theory and experiments.
2.2. High PRF ultrasound system and signal processing
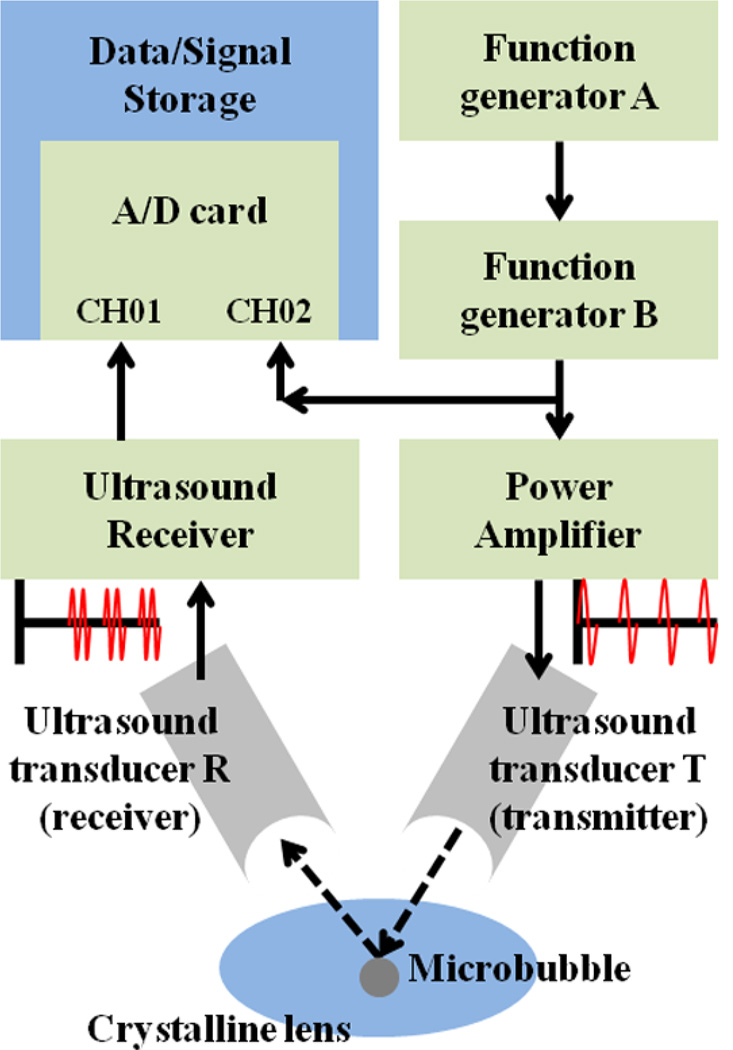
The schematic diagram of the high PRF ultrasound system is shown in figure 2. The system consisted of two function generators (Agilent 33250A, Agilent, Loveland, CO), radiofrequency (RF) power amplifier (E&I model A150, E&I, Rochester, NY) with 55 dB gain, two 25 MHz ultrasound transducers, an ultrasound receiver (DPR 300 Pulser / Reciever, JSR Ultrasonics, Pittsford, NY), and the analog-to-digital dual channels data acquisition card (A/D card, CompuScope 12400, GaGe Inc., Montreal, Canada). The function generator A was used to control the PRF of pulse-echo probing and to trigger the function generator B that controlled the center frequency of each sine pulse. The sine pulses, generated by the combination of function generators A and B with desired PRF and center frequency, were saved at the channel 2 of the A/D card for data analysis and, at the same time, directed to the RF power amplifier. The center frequency and PRF of the train of sine pulses were 25 MHz and 1 MHz, respectively. The amplified pulses were directed to the ultrasound transducer T (transmitter). Emitted ultrasound pulses were reflected at the surface of the microbubble and the ultrasound transducer R (receiver) received the train of echoes. This train of echoes was amplified by the ultrasound receiver with a 45 dB gain and stored at the channel 1 of the A/D card for offline data analysis. Therefore, RF raw data were comprised of trains of sine pulses, saved at channel 2, and backscattered ultrasound echoes, saved at channel 1. The acoustic radiation pulse was launched from the 3.7 MHz ultrasound excitation transducer with delay of 60 µs according to the first sine pulse to displace the laser-induced microbubble. The duration of the acoustic radiation pulse was varied from 10 to 30 µs. Arrival time of the first echo with respect to the first sine pulse defined the initial location of the microbubble. Changes in the arrival times of the following echoes were used to determine the microbubble displacement using a cross-correlation speckle tracking method (Lubinski et al 1999). The kernel size and search window for cross-correlation tracking were 94 µm and 188 µm, respectively. Before the cross-correlation speckle tracking algorithm was applied to the saved RF raw data, a comb filter was used to remove the cross-talk between the ultrasound transducer R and the excitation transducer.
Figure 2.
The schematic diagram of the high PRF ultrasound system. Dotted arrows indicated the direction of transmitted and reflected trains of sine pulses at the surface of microbubble.
2.3. Lens preparation
Four bovine eyes, from 25 – 30 months old cows, were obtained from the Sierra for Medical Science, Inc. (Whittier, CA). They were shipped over night in the thermo-insulated box with ice packs. All the experiments were done within 12 hours after eyes arrived at our facility.
For the laser-induced microbubble experiments, the cornea was removed from an eye. Then, the sclera was dissected vertically so that vitreous humor, lens, and components attached to both vitreous and lens could be pulled out from the sclera. The lens was carefully taken out by separating it from the vitreous. With an unused scalpel, the lens capsule was removed by slightly tearing off a small zone of the lens equator. Once the lens material without lens capsule was obtained, it was placed in a lens holder (figure 1) and 5 ml of 6% gelatin solution was added for fixation.
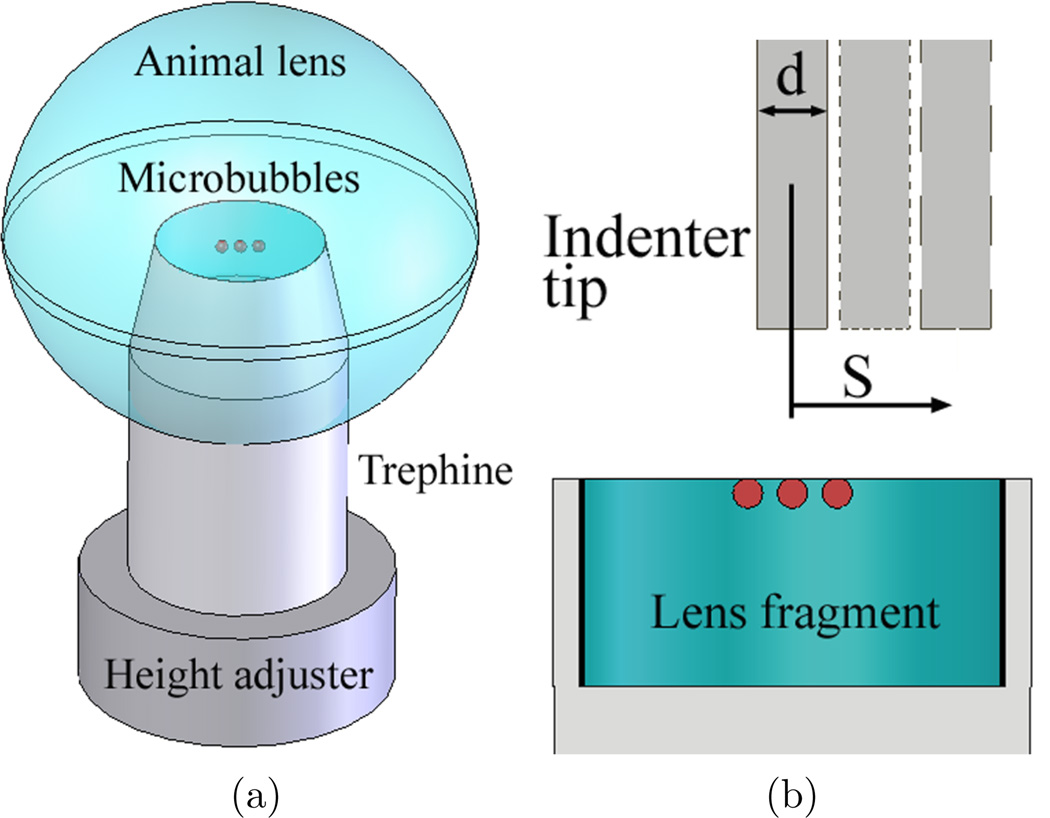
After the laser-induced microbubble experiments, the lens was carefully removed from the lens holder and sectioned equatorially for indentation testing. Firstly, a 14 mm internal diameter trephine (Katena eye instruments, Denville, NJ) was placed inside the animal lens by the guidance of the existing laser-induced microbubbles (figure 3(a)). Secondly, a razor blade was used to make a flat surface for the indentation test. The lens fragment, inside the trephine with an open surface on top of the trephine (figure 3(b)), was put inside phosphate buffered saline for the indentation test. The thickness of the lens fragment was 6 mm. Laser-induced microbubbles were always created 6 mm away from the anterior of the lens.
Figure 3.
Preparation of lens fragment for the indentation tests after laser-induced microbubble experiments. (a) The trephine with a 14 mm internal diameter and the height adjuster were placed into the lens by the guidance of existing microbubbles (red circles). Lens fragment was made by cutting the lens equatorially with a razor blade. (b) Cross-sectional view of lens fragment bounded by the height adjuster (bottom) and the trephine (sides). The indenter for indentation tests was placed above the lens fragment. The indenter was used to measure Young’s modulus of lens fragment at different locations. The diameter of indenter tip (d) was 2.38 mm and the location from the center (S=0) is S.
2.4. Validations of the experimental systems
Before the high PRF ultrasound system and the indentation system were used to measure Young’s modulus of animal crystalline lenses, the following experiments were performed.
2.4.1. High PRF ultrasound system validation with phantoms
To validate the high PRF ultrasound system, the experiments were performed using laser-induced microbubbles in tissue-mimicking phantoms, containing 2.0, 3.0, 6.0, 9.0, and 11.0% by weight gelatin (300 Bloom, type-A, Sigma-Aldrich, Inc., St. Louis, MO). For the microbubble experiments, one measurement was performed on five different microbubbles for each gelatin sample. In addition, cylindrical samples of 35 mm diameter and 17 mm height were made out of the same gelatin solution to be used in direct mechanical measurements with uniaxial tester by pressing the whole phantom with 45 mm diameter plates. The boundary condition at the contact between the gelatin sample and the plates was slip and the cylindrical wall of the sample was free. Prior to measurements, the phantoms and samples were kept together and followed the same experimental protocol to minimize any differences between the materials. The duration of acoustic pulse was 10 µs for all phantom experiments. Young’s modulus found using the laser-induced microbubble approach was compared with Young’s modulus measured using uniaxial tester.
2.4.2. Accuracy of the indentation system and boundary effects
The indentation system consisted of an indenter (tip diameter = 2.38 mm), lever system, and a uniaxial tester, In-Spec 2200. The indenter was connected to the load cell of the uniaxial tester by a lever system with the force gain of 7.5.
To measure localized Young’s modulus of a sample, an indenter with small tip diameter was used. However, for soft materials, the reaction force in the indentation tests was under the measurable ranges of the load cell. To increase the reaction force over the measurable ranges of the load cell, the lever system was used. If the reaction force from soft materials to the indenter tip was 20 mN, the lever magnified the force at the load cell to 150 mN. Therefore, the lever bridged the indenter and the load cell of the uniaxial tester to detect the small reaction force effectively. The indenter experienced acceleration and deceleration before the tip of the indenter moved up to about 2 mm from the starting point. Therefore, the fragmented animal crystalline lens, inside the trephine, was placed at least 2 mm away from the tip of the indenter.
To verify the accuracy of the indentation system and investigate the influence of the boundary effects on the measurements of Young’s modulus near the wall of the trephine, we used gelatin phantoms with the concentrations of 1.5, 2.0, 2.5, 3.0, 6.0, 9.0, and 11.0% by weight. Typical uniaxial test measurements with 45 mm diameter plates were done by pressing the whole gelatin samples with 35 mm diameter and 17 mm thickness. For indentation tests, we made a container that mimicked the geometry of a lens fragment inside the trephine. The container had 14 mm diameter and 6 mm depth. The containers were filled with gelatin solutions with different concentrations as mentioned above. Indentation measurements were performed at six points on gelatin samples inside the container. Six points were 0, 2.0, 2.5, 3.0, 3.5, and 4.0 mm away from the center of gelatin container (figure 3(b)). The tip of the indenter was moved with the speed of 0.11mm/s in vertical direction and the total indention was 1.5 mm after the indenter tip touched the gelatin surface. Young’s modulus was estimated in the assumption of the frictionless boundary condition at the indenter tip and the fixed bottom boundary using equations obtained by Yang (Yang 1998).
To test the accuracy of the indentation measurement system, we compared Young’s modulus of each gelatin sample measured by uniaxial test with Young’s modulus measured by the indentation test at the center of the gelatin samples in the container. To explore the boundary effects we compared Young’s modulus obtained in six different locations for each gelatin sample.
After the system for indentation experiments was tested, the same system was used for reference measurements. The fragment of animal lens was prepared using the trephine and the razor blade (figure 3(a)) and placed in the phosphate buffered saline (PBS) for indentation tests.
2.4.3. Time effects of bovine lens in PBS
To identify the time effects on the changes of Young’s modulus of bovine lens, we measured Young’s modulus of the fragmented bovine lens prepared by the same procedure explained at section 2.3 (figure 3(a)). We measured Young’s modulus of the bovine lens in 4 different times with 2 hour intervals (from 0 to 6 hours) and in 5 different locations with 2.5 mm gap.
3. Results
3.1. Validation of high PRF ultrasound system using phantom
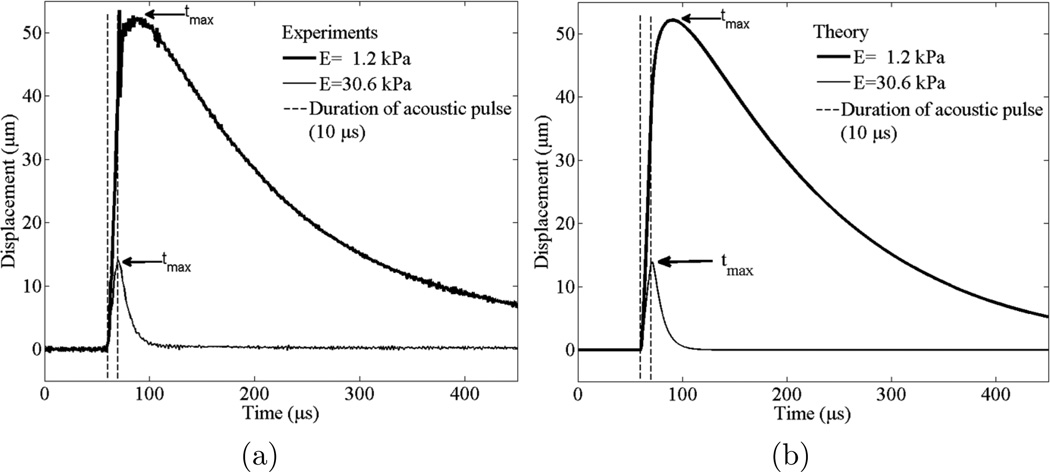
Reconstruction of Young’s modulus of viscoelastic medium using the custom-built high PRF ultrasound system is presented. Figure 4(a) presents an example of the dependence of microbubble displacement on time for 2% and 11% gelatin phantoms and the displacement of microbubbles shown in figure 4(a) are averaged from five measurements. For the theoretical calculations of the displacements of microbubbles shown in figure 4(b), Young’s moduli obtained from the best fit between experimental measurements and theory were used (Yoon et al 2011). Times required to reach microbubble’s maximum displacement (tmax) are indicated at figure 4 and tmax was used for reconstruction of Young’s modulus of the medium. Figure 4 shows how the amplitude of displacements and the time of maximum displacement (tmax) decrease with elasticity increase.
Figure 4.
(a) Experimentally measured and averaged displacement from five different microbubbles and (b) theoretically calculated displacement of the microbubbles in response to 10 µs acoustic pulse in gelatin phantoms of different elasticity. Average values of Young’s moduli (E) for plots (a) and (b) are 1.2 kPa (thick line) and 30.6 kPa (thin line). One measurement was performed to five different microbubbles for each gelatin phantom. Time of maximum displacement of microbubble is indicated as tmax. The dotted vertical lines indicate start and end of acoustic radiation force. For thick solid lines, the radius of the microbubble is 25±2 µm and for thin solid lines, the radius of the microbubble is 20±2 µm. In theoretical calculations shear viscosity of 0.05 Pa·s is used.
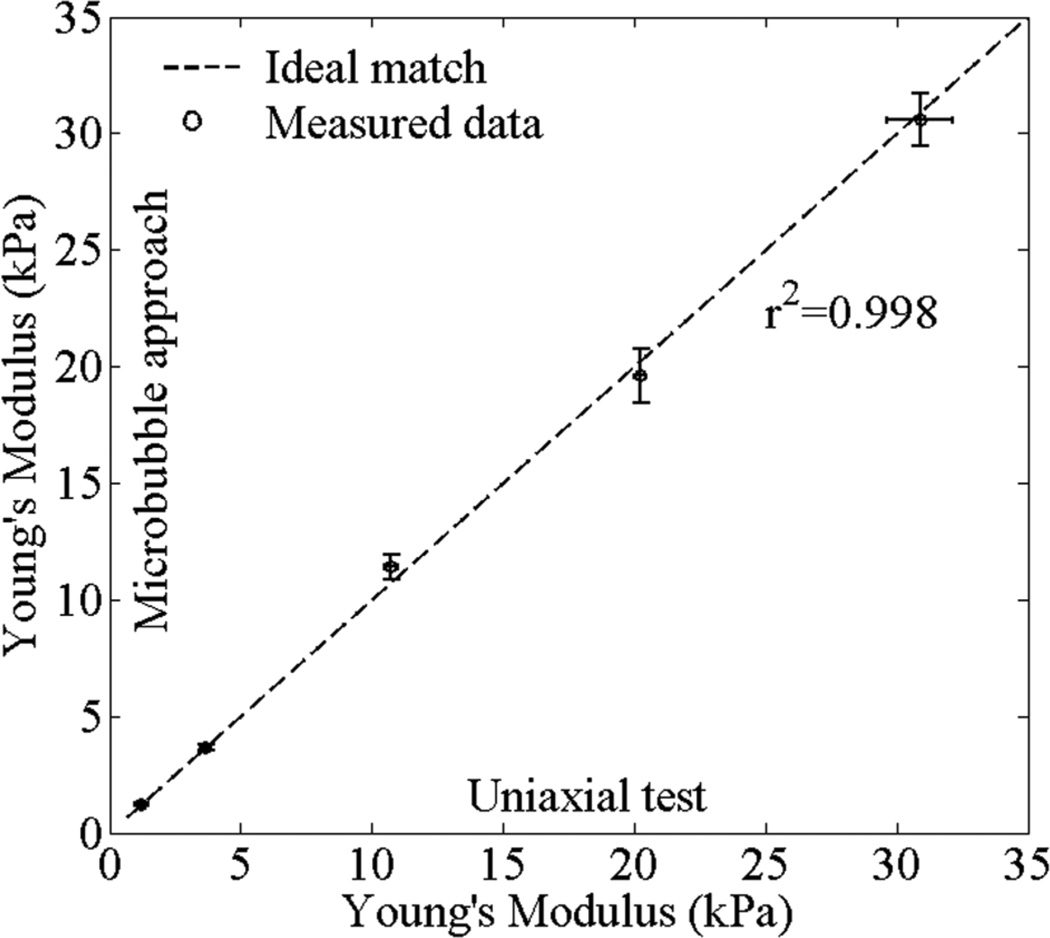
Figure 5 shows the comparison between Young’s moduli obtained using the microbubble approach and the uniaxial test. Error bars in figure 5 were generated from one measurement of five different microbubbles in each gelatin sample. Measurements of Young’s modulus of gelatin phantoms using microbubble approach are in reasonable ranges when comparing to results obtained from the uniaxial test. We can also estimate the shear viscosity of gelatin phantoms by comparing the decaying profiles of the dynamics of a laser-induced microbubble from experiments and theory. The estimated shear viscosity for this phantom study is 0.05 Pa·s which is used in all theoretical calculations. The value corresponds to the results of our previous work. (Aglyamov et al 2007, Karpiouk et al 2009, Yoon et al 2011). In the measured range, Young’s modulus is almost independent from the shear viscosity. The results show that the high PRF ultrasound system has the ability to assess the Young’s modulus of tissue-mimicking phantoms with high accuracy.
Figure 5.
Comparison of Young’s modulus values reconstructed using microbubble approach with the high PRF ultrasound system and measured using the uniaxial load-displacement test. One measurement was performed to five different microbubbles at each case. Error bars are plus/minus one standard deviation.
3.2. Validation of indentation test system
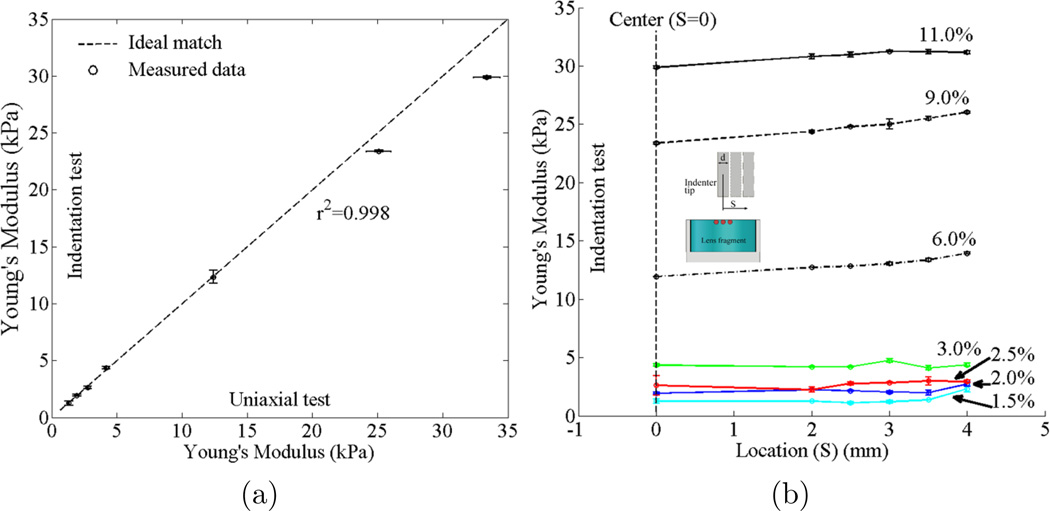
In this section we are comparing Young’s modulus of gelatin samples measured by uniaxial test with Young’s modulus measured by indentation test at the center of gelatin samples in the container (figure 6(a)). Mean and standard deviation values between indentation test and uniaxial test have good agreement. Thus, indentation measurement system can be used to measure local Young’s modulus of ex vivo animal crystalline lens.
Figure 6.
Validation of indentation measurement system. (a) Accuracy test of the indentation test by comparing Young’s modulus obtained by the indentation measurement system with Young’s modulus measured by the uniaxial test. (b) Dependence of the Young’s modulus on the distance from phantom center for different gelatin concentrations.
Because the lens fragment inside the trephine is bounded by trephine (figure 3), the boundary effects should be investigated. To explore the boundary effects, we compared Young’s modulus of six different locations (figure 3(b)) in each gelatin sample measured with indentation measurement system. The results are shown at figure 6(b).
The measured values of Young’s modulus increase close to the boundary because of rigid boundary condition. However, for our study, to avoid the boundary effects, we measured Young’s modulus of animal crystalline lenses near the central region. By doing this, we could dodge the boundary effects.
We also investigated the changes in the mechanical properties of a bovine lens (25–30 months old) in PBS from zero to six hours with two hours intervals. Elastic properties of bovine lenses do not change significantly up to 6 hours. Moreover, the experiments for both the laser-induced microbubble and the indentation experiments took less than one and a half hours after the lens was removed from an eye globe. Thus, during the series of experiments, time effects on the changes of the mechanical properties of bovine lenses can be ignored.
3.3. Reconstruction of Young’s modulus of bovine lenses
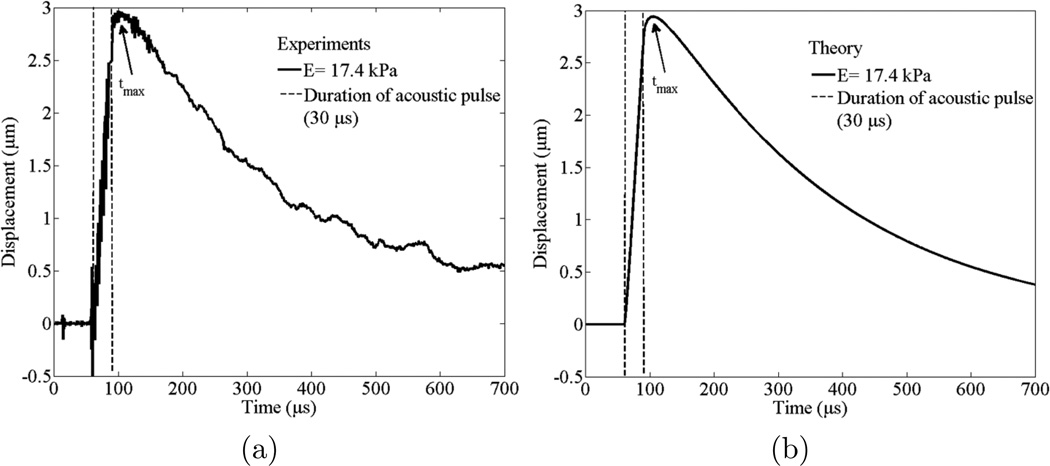
The results of the validation of the high PRF ultrasound system and the results presented in Yoon et al 2011 demonstrate that the developed theoretical model can predict the dynamics of laser-induced microbubbles under acoustic radiation force in a viscoelastic medium with high PRF ultrasound system. Reconstruction, the inverse problem of Young’s modulus of bovine lens, was then considered. Three measurements were performed to each microbubble at the specific location within lenses. Experimentally obtained and theoretically calculated displacements of a laser-induced microbubble with the radius of 63±3 µm are shown in figures 7(a) and 7(b), respectively. Experimentally measured displacement of a microbubble (figure 7(a)) is presented as an averaged value from three trials. The microbubble dynamics presented within figures 7(a) and 7(b) correspond to the experimental points marked by the circle in figure 8. The duration of acoustic pulse was 30 µs. The Young’s modulus of the bovine lens at the specific location was 17.4±0.5 kPa. We can also estimate the shear viscosity of bovine lenses by comparing the decaying profiles of the displacement of a laser-induced microbubble from experiments and theory. The estimated shear viscosity for this case is 1.5 Pa·s (figure 7).
Figure 7.
(a) Experimentally measured and averaged displacement from three trials to one microbubble and (b) theoretically calculated displacement of the microbubble in response to 30 µs acoustic pulse. Average value of Young’s modulus (E) for plots (a) and (b) is 17.4 kPa and the shear viscosity is 1.5 Pa·s. Time of maxiumum displacement of microbubble is indicated as tmax. The dotted vertical lines indicate start and end of acoustic radiation force. The radius of the microbubble is 63±3 µm. Two plots (a) and (b) correspond to the experimental points in figure 8 marked by a circle.
Figure 8.
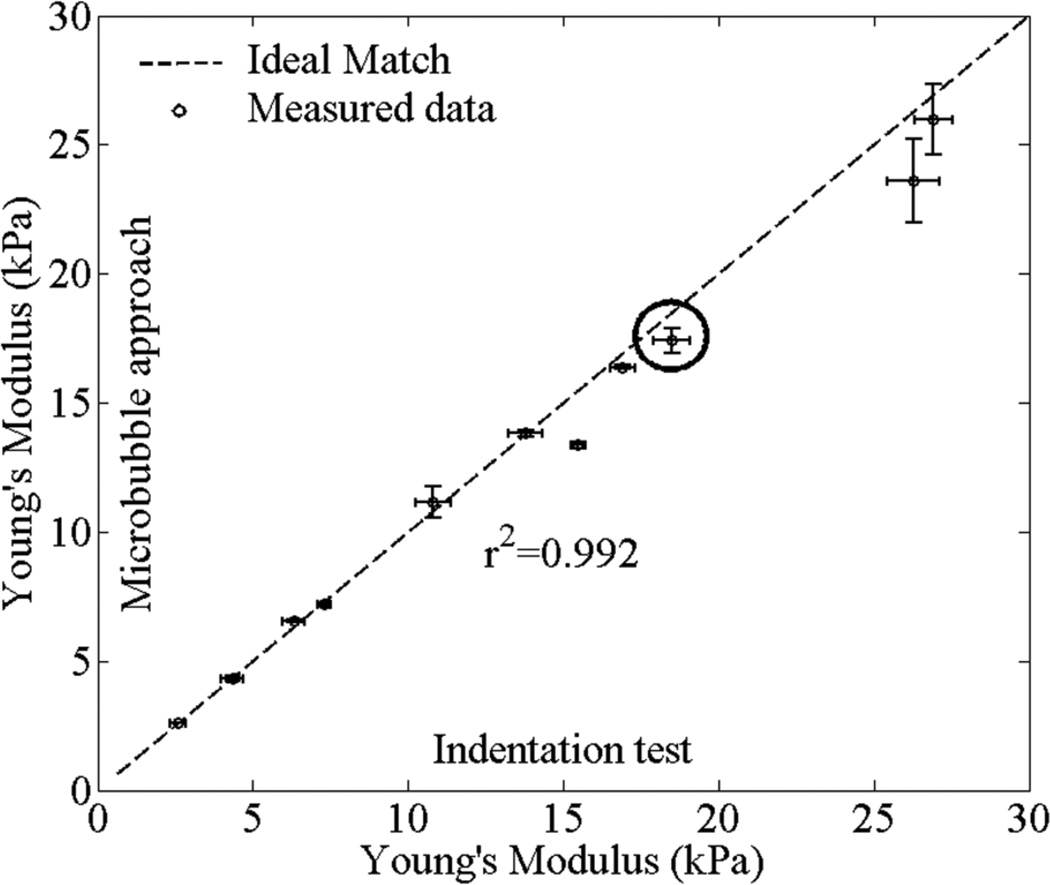
Comparison of Young’s modulus values reconstructed using microbubble-based approach and measured using the indentation test. 11 laser-induced microbubbles created at 4 different bovine lenses were used. Three measurements were performed to each microbubble. Detailed example of the dynamics of the laser-induced microbubble of the experimental point marked by the circle is presented in figure 7. Error bars are plus/minus one standard deviation.
Figure 8 describes the comparison of Young’s modulus (E) reconstructed using the laser-induced microbubble approach and measured by indentation test. The dotted line indicates the ideal match between two measurements. A total of 11 microbubbles were generated in four bovine lenses; the first lens had three microbubbles; the second lens had three microbubbles; the third lens had one microbubble; and the fourth lens had four microbubbles. Table 1 shows Young’s moduli of 11 different points in four bovine lenses measured by microbubble approach and indentation test. The measured Young’s moduli varies from 2.6±0.1 to 26.0±1.4 kPa. The Young’s modulus reconstructed by the laser-induced microbubble technique and that directly measured by indentation test agree well with each other as shown in figure 8. The corresponding shear viscosities of four bovine lenses are 1.5±0.1, 1.6±0.1, 1.3, and 1.5±0.1 Pa·s by considering the decaying profiles of the dynamics of a laser-induced microbubble from theory and experiments. The shear viscosity does not change much within the area of measurements at the same bovine lens. In summary, the proposed approach using the laser-induced microbubble interrogated by impulsive acoustic radiation force with the high PRF ultrasound-based imaging system can be used to estimate the mechanical properties of ex vivo crystalline lens.
Table 1.
Comparison of Young’s moduli of bovine lenses between two different measurement approaches.
| Bovine lens No. |
Young’s Modulus (kPa) |
|
|---|---|---|
| Microbubble approach | Indentation test | |
| Sample 1 | 6.6 ± 0.5 | 6.3 ± 0.3 |
| 13.4 ± 0.1 | 15.5 ± 0.3 | |
| 17.4 ± 0.5 | 18.5 ± 0.6 | |
| Sample 2 | 13.8 ± 0.1 | 13.8 ± 0.5 |
| 16.4 ± 0.1 | 16.9 ± 0.4 | |
| 23.6 ± 1.6 | 26.3 ± 0.9 | |
| Sample 3 | 4.3 ± 0.1 | 4.3 ± 0.4 |
| Sample 4 | 2.6 ± 0.1 | 2.6 ± 0.3 |
| 7.2 ± 0.1 | 7.3 ± 0.2 | |
| 11.1 ± 0.6 | 10.8 ± 0.6 | |
| 26.0 ± 1.4 | 26.9 ± 0.6 | |
4. Discussion
In this paper, we validated our theoretical model and the high PRF ultrasound system in gelatin phantoms and ex vivo bovine crystalline lenses. Using laser-induced microbubble approach Young’s modulus of soft tissues such as the crystalline lenses can be measured with reasonable accuracy and precision compared to the indentation test. In general, the shear viscosity of tissue also can be evaluated based on the measured motion of the microbubble. The estimations of the shear viscosity varied from lens to lens, but did not change much within one lens. A possible explanation is that the measurement area is too small to observe big changes in shear viscosity (usually within 3 mm). Currently, no standard measurement technique is available to measure lens viscosity. Therefore, we have focused on measuring Young’s modulus of crystalline lens.
In general, there are several possible sources of the discrepancy between these measurement techniques. The 2.38 mm diameter indenter is significantly larger compared to the diameter of laser-induced microbubble (80–150 µm). Measurements by indentation test were an averaged value of a circular area, but measurements by the microbubble approach had very localized values. Secondly, locations where the measurements were performed in laser-induced microbubble approach and the indentation test could not match perfectly. Lastly, the equation used to calculate the value of Young’s modulus (Yang, 1998) assumes that the medium is infinite. However, due to the shape of the trephine, the lens fragment was bounded by 14 mm diameter of cylindrical walls. Thus, there is a boundary effect that results in the elasticity overestimation. The solution we took to avoid the boundary effects was that we measured the mechanical properties of lenses near their center (figure 6(b)). However, despite these discrepancies between the two measurement techniques, there is good agreement between the results of microbubble-based measurements and indentation tests demonstrating the applicability of the microbubble-based approach for elasticity measurements (see figure 8). In addition, we can conclude that laser-induced optical breakdown does not produce significant changes in lens elasticity.
For improvement of the estimation of elastic properties of soft tissues, we can modify our theoretical model. The current theoretical model assumes that the surrounding medium of a microbubble is isotropic and homogeneous (Yoon et al 2011). However, the lens is a layered object, formed by adding new cells on top of old cells, making it an anisotropic and non-homogeneous medium. This discrepancy between assumptions and the real object may increase the differences when measuring Young’s modulus of lens. Thus, future work entails creation of a model which includes these factors.
The ability to directly measure the mechanical properties of the lens in vivo could significantly help to develop improved presbyopia treatments. Most potential presbyopia correction techniques currently under development, including laser softening and lens refilling surgery rely on the assumption that presbyopia is due mainly to the stiffening of the lens (Myers and Krueger 1998, Krueger et al 2001, Glasser 2008). For example, in femtosecond lentotomy, the microbubbles created during laser photodisruption are used to increase lens flexure (Ripken et al 2008, Schumacher et al 2009, Lubatschowski et al 2010). Potentially, the methodologies proposed in this paper could be combined with such a surgical treatment for the in vivo measurement of mechanical properties, planning of surgery, and estimation of the outcome.
5. Conclusion
The high PRF ultrasound system to measure the mechanical properties of animal crystalline lens using microbubble-based method was developed and validated. Reconstructed Young’s moduli in different locations for four bovine lenses correlated well with those measured by indentation test. Thus, the proposed laser-induced microbubble approach with the high PRF ultrasound system can be used to measure the mechanical properties of ex vivo animal crystalline lenses.
Acknowledgment
This work was supported in part by National Institutes of Health under grant EY 018081.
References
- Aglyamov S, Karpiouk A, Ilinskii Y, Zabolotskaya E, Emelianov S. Motion of a solid sphere in a viscoelastic medium in response to applied acoustic radiation force: Theoretical analysis and experimental verification. J. Acoust. Soc. Am. 2007;122:1927–1936. doi: 10.1121/1.2774754. [DOI] [PMC free article] [PubMed] [Google Scholar]
- Assia E, Medan I, Rosner M. Correlation between clinical, physical and histopathological characteristics of the cataractous lens. Graef. Arch. Clin. Exp. 1997;235:745–748. doi: 10.1007/BF02332857. [DOI] [PubMed] [Google Scholar]
- Burd H, Wilde G, Judge S. An improved spinning lens test to determine the stiffness of the human lens. Exp. Eye. Res. 2011;92:28–39. doi: 10.1016/j.exer.2010.10.010. [DOI] [PMC free article] [PubMed] [Google Scholar]
- Charman W. The eye in focus: accommodation and presbyopia. Clin. Exp. Optom. 2008;91:207–225. doi: 10.1111/j.1444-0938.2008.00256.x. [DOI] [PubMed] [Google Scholar]
- Erpelding T, Hollman K, O’Donnell M. Bubble-based acoustic radiation force elasticity imaging. IEEE Trans. Ultrason. Ferroelectr. Freq. Control. 2005;52:971–979. doi: 10.1109/tuffc.2005.1504019. [DOI] [PubMed] [Google Scholar]
- Erpelding T, Hollman K, O’Donnell M. Mapping age-related elasticity changes in porcine lenses using bubble-based acoustic radiation force. Exp. Eye. Res. 2007;84:332–341. doi: 10.1016/j.exer.2006.10.007. [DOI] [PMC free article] [PubMed] [Google Scholar]
- Fisher R. The elastic constants of the human lens. J. Physiol. 1971;212:147–180. doi: 10.1113/jphysiol.1971.sp009315. [DOI] [PMC free article] [PubMed] [Google Scholar]
- Fisher R. Presbyopia and the changes with age in the human crystalline lens. J. Physiol. 1973;228:765–779. doi: 10.1113/jphysiol.1973.sp010111. [DOI] [PMC free article] [PubMed] [Google Scholar]
- Glasser A. Restoration of accommodation:surgical options for correction of presbyopia. Clin. Exp. Optom. 2008;91:279–295. doi: 10.1111/j.1444-0938.2008.00260.x. [DOI] [PMC free article] [PubMed] [Google Scholar]
- Glasser A, Croft M, Kaufman P. Aging of the human crystalline lens and presbyopia. Int. Ophthalmol. Clin. 2001;41:1–15. doi: 10.1097/00004397-200104000-00003. [DOI] [PubMed] [Google Scholar]
- Heys K, Cram S, Truscott R. Massive increase in the stiffness of the human lens nucleus with age: the basis for presbyopia? Mol. Vis. 2004;10:956–963. [PubMed] [Google Scholar]
- Heyworth P, Thompson G, Tabandeh H, McGuigan S. The relationship between clinical classification of cataract and lens hardness. Eye(London) 1993;7((Pt 6)):726–730. doi: 10.1038/eye.1993.169. [DOI] [PubMed] [Google Scholar]
- Hollman K, O’Donnell M, Erpelding T. Mapping elasticity in human lenses using bubble-based acoustic radiation force. Exp. Eye Res. 2007;85:890–893. doi: 10.1016/j.exer.2007.09.006. [DOI] [PMC free article] [PubMed] [Google Scholar]
- Ilinskii Y, Meegan G, Zabolotskaya E, Emelianov S. Gas bubble and solid sphere motion in elastic media in response to acoustic radiation force. J. Acoust. Soc. Am. 2005;117:2338–2346. doi: 10.1121/1.1863672. [DOI] [PubMed] [Google Scholar]
- Karpiouk A, Aglyamov S, Ilinskii Y, Zabolotskaya E, Emelianov S. Assessment of shear modulus of tissue using ultrasound radiation force acting on a spherical acoustic inhomogeneity. IEEE Trans. Ultrason. Ferroelectr. Freq. Control. 2009;56:2380–2387. doi: 10.1109/TUFFC.2009.1326. [DOI] [PMC free article] [PubMed] [Google Scholar]
- Kikkawa Y, Sato T. Elastic properties of the lens. Exp. Eye. Res. 1963;2:210–215. doi: 10.1016/s0014-4835(63)80015-9. [DOI] [PubMed] [Google Scholar]
- Krueger R, Sun X, Stroh J, Myers R. Experimental increase in accommodative potential after neodymium:yttrium-aluminum-garnet laser photodisruption of paired cadaver lenses. Ophthalmology. 2001;108:2122–2129. doi: 10.1016/s0161-6420(01)00834-x. [DOI] [PubMed] [Google Scholar]
- Lubatschowski H, Schumacher S, Fromm M, Wegener A, Hoffmann H, Oberheide U, Gerten G. Femtosecond lentotomy: generating gliding planes inside the crystalline lens to regain accommodation ability. J. Biophotonics. 2011;3:265–268. doi: 10.1002/jbio.201000013. [DOI] [PubMed] [Google Scholar]
- Lubinski M, Emelianov S, O’Donnell M. Speckle tracking methods for ultrasonic elasticity imaging using short-time correlation. IEEE Trans. Ultrason. Ferroelectr. Freq. Control. 1999;46:82–96. doi: 10.1109/58.741427. [DOI] [PubMed] [Google Scholar]
- Milas S, Ye J, Norris T, Balogh L, Baker J, Hollman K, Emelianov S, O’Donnell M. Acoustic detection of microbubble formation induced by enhanced optical breakdown of silver/dendrimer nanocomposite. Appl. Phys. Lett. 2003a;82:994–996. [Google Scholar]
- Milas S, Ye J, Norris T, Hollman K, Emelianov S, O’Donnell M. Acoustic characterization of microbubble dynamics in laser-induced optical breakdown. IEEE Trans. Ultrason. Ferroelectr. Freq. Control. 2003b;50:517–522. [Google Scholar]
- Myers R, Krueger R. Novel approaches to correction of presbyopia with laser modification of the crystalline lens. J. Refract. Surg. 1998;14:136–139. doi: 10.3928/1081-597X-19980301-12. [DOI] [PubMed] [Google Scholar]
- Pau H, Kranz J. The increasing sclerosis of the human lens with age and its relevance to accommodation and presbyopia. Graef. Arch. Clin. Exp. 1991;229:294–296. doi: 10.1007/BF00167888. [DOI] [PubMed] [Google Scholar]
- Ripken T, Oberheide U, Fromm M, Schumacher S, Gerten G, Lubatschowski H. fs-Laser induced elasticity changes to improve presbyopic lens accommodation. Graef. Arch. Clin. Exp. 2008;246:897–906. doi: 10.1007/s00417-007-0699-x. [DOI] [PubMed] [Google Scholar]
- Sarvazyan A, Rudenko O, Swanson S, Fowlkes J, Emelianov S. Shear wave elasticity imaging: a new ultrasonic technology of medical diagnostics. Ultrasound Med. Biol. 1998;24:1419–1435. doi: 10.1016/s0301-5629(98)00110-0. [DOI] [PubMed] [Google Scholar]
- Schumacher S, Oberheide U, Fromm M, Ripken T, Ertmer W, Gerten G, Wegener A, Lubatschowski H. Femtosecond laser induced flexibility change of human donor lenses. Vision Res. 2009;49:1853–1859. doi: 10.1016/j.visres.2009.04.028. [DOI] [PubMed] [Google Scholar]
- Sharma P, Busscher H, Terwee T, Koopmans S, van Kooten T. A comparative study on the viscoelastic properties of human and animal lenses. Exp. Eye. Res. 2011;93:681–688. doi: 10.1016/j.exer.2011.08.009. [DOI] [PubMed] [Google Scholar]
- Soergel F, Meyer C, Eckert G, Abele B, Pechhold W. Spectral analysis of viscoelasticity of the human lens. J. Refract. Surg. 1999;15:714–716. doi: 10.3928/1081-597X-19991101-22. [DOI] [PubMed] [Google Scholar]
- Tabandeh H, Wilkins M, Thompson G, Nassiri D, Karim A. Hardness and ultrasonic characteristics of the human crystalline lens. J. Cataract Refract. Surg. 2000;26:838–841. doi: 10.1016/s0886-3350(00)00305-9. [DOI] [PubMed] [Google Scholar]
- Van Alphen G, Graebel W. Elasticity of tissues involved in accommodation. Vision Res. 1991;31:1417–1438. doi: 10.1016/0042-6989(91)90061-9. [DOI] [PubMed] [Google Scholar]
- Vogel A, Noack J, Huttman G, Paltauf G. Mechanisms of femtosecond laser nanosurgery of cells and tissues. Appl. Phys. B-Lasers. 2005;81:1015–1047. [Google Scholar]
- Weeber H, Eckert G, Pechhold W, Van Der Heijde R. Stiffness gradient in the crystalline lens. Graef. Arch. Clin. Exp. 2007;245:1357–1366. doi: 10.1007/s00417-007-0537-1. [DOI] [PubMed] [Google Scholar]
- Yang F. Indentation of an incompressible elastic flim. Mech. Matter. 1998;30:275–286. [Google Scholar]
- Yoon S, Aglyamov S, Karpiouk A, Emelianov S. Estimation of mechanical properties of a viscoelastic medium using a laser-induced microbubble interrogated by an acoustic radiation force. J. Acoust. Soc. Am. 2011;130:2241–2248. doi: 10.1121/1.3628344. [DOI] [PMC free article] [PubMed] [Google Scholar]


