Abstract
The bone marrow is the principal site where HSCs and more mature blood cells lineage progenitors reside and differentiate in an adult organism. HSCs constitute a minute cell population of pluripotent cells capable of generating all blood cell lineages for a life-time1. The molecular dissection of HSCs homeostasis in the bone marrow has important implications in hematopoiesis, oncology and regenerative medicine. We describe the labeling protocol with fluorescent antibodies and the electronic gating procedure in flow cytometry to score hematopoietic progenitor subsets and HSCs distribution in individual mice (Fig. 1). In addition, we describe a method to extensively enrich hematopoietic progenitors as well as long-term (LT) and short term (ST) reconstituting HSCs from pooled bone marrow cell suspensions by magnetic enrichment of cells expressing c-Kit. The resulting cell preparation can be used to sort selected subsets for in vitro and in vivo functional studies (Fig. 2).
Both trabecular osteoblasts2,3 and sinusoidal endothelium4 constitute functional niches supporting HSCs in the bone marrow. Several mechanisms in the osteoblastic niche, including a subset of N-cadherin+ osteoblasts3 and interaction of the receptor tyrosine kinase Tie2 expressed in HSCs with its ligand angiopoietin-15 concur in determining HSCs quiescence. "Hibernation" in the bone marrow is crucial to protect HSCs from replication and eventual exhaustion upon excessive cycling activity6. Exogenous stimuli acting on cells of the innate immune system such as Toll-like receptor ligands7 and interferon-α6 can also induce proliferation and differentiation of HSCs into lineage committed progenitors. Recently, a population of dormant mouse HSCs within the lin- c-Kit+ Sca-1+ CD150+ CD48- CD34- population has been described8. Sorting of cells based on CD34 expression from the hematopoietic progenitors-enriched cell suspension as described here allows the isolation of both quiescent self-renewing LT-HSCs and ST-HSCs9. A similar procedure based on depletion of lineage positive cells and sorting of LT-HSC with CD48 and Flk2 antibodies has been previously described10. In the present report we provide a protocol for the phenotypic characterization and ex vivo cell cycle analysis of hematopoietic progenitors, which can be useful for monitoring hematopoiesis in different physiological and pathological conditions. Moreover, we describe a FACS sorting procedure for HSCs, which can be used to define factors and mechanisms regulating their self-renewal, expansion and differentiation in cell biology and signal transduction assays as well as for transplantation.
Keywords: Stem Cell Biology, Issue 65, Molecular Biology, Medicine, Hematopoiesis, hematopoietic stem cell, hematopoietic progenitors, bone marrow, flow cytometry
Protocol
1. Preparation of Cell Suspension from Bone Marrow
Euthanize the mouse and place the animal in a stainless pan and spray 70% ethanol onto its abdomen and back. Collect femur and tibia from hind legs, and spinal column.
Accurately remove all soft tissue residues from the spinal column with a sharp tip scissors and from legs bones with a gauze. Store bones in a 50 mL Falcon tube with 30 mL of RPMI medium containing 10% heat inactivated fetal bovine serum (FBS), supplemented with 50 μM β-mercaptoethanol, 100 μM MEM Non-Essential Amino Acids, 1 mM MEM Sodium Pyruvate, 2 mM L-glutamine, 100 μg/ml streptomycin and 100 U/ml penicillin.
Cover the bottom of a previously sterilized mortar with sterile filters.
Transfer the bones into the mortar and cover them with a layer of filters in order to assemble a friction surface.
Prepare a 50 mL Falcon tube provided with a Falcon filter.
Smash the bones with the help of a pestle until obtaining a homogeneous cell suspension.
Transfer the suspension into the tube.
Add to the mortar 5 mL of fresh RPMI complete medium to wash and harvest the remaining cells.
Repeat the last two points until the homogenized bones appear clear.
Transfer and filter in a new tube the cell suspension in order to eliminate the remaining tissue debris.
Centrifuge the tube at 1,500 rpm for 5 min and carefully remove the supernatant by aspiration. Make sure not to disturb the cell pellet.
2. Phenotypic Analysis
Resuspend and wash cells of individual mice in 15 mL of PBS and 2% FBS.
Centrifuge the tube at 1,500 rpm for 5 min and carefully remove the supernatant by aspiration. Make sure not to disturb the pellet.
Suspend the pellet in 5 mL PBS and 2% FBS and count cells.
Transfer 1×10⁶ cells/well in a 96 wells round bottom plate.
Centrifuge the plate at 1,500 rpm for 5 min.
- Prepare a mix of mAbs directed against the following surface markers. Dilute them as indicated in PBS and 2% FBS to stain the cells.
- CD4, CD8, CD3, CD45R, CD19, Gr1, Ter119, NK1.1 conjugated to PE-Cy5 1:200
- c-Kit conjugated to APC 1:100
- Sca1 conjugated to biotin 1:50
- CD34 conjugated to FITC 1:50
- FcγR conjugated to PE 1:100
- IL-7R conjugated to PE-Cy7 1:100
Discard the supernatant and add 50 μL of mAbs mix to each well. Dissociate into single cells by pipetting.
Incubate cells for 20 min in the dark at 4 °C.
Wash cells twice with 150 μL of PBS and 2% FBS.
Centrifuge the plate at 1,500 rpm for 5 min and discard the supernatant by inverting the plate.
- Dilute streptavidin in PBS and 2% FBS as indicated to stain the cells.
- Streptavidin conjugated to APC-Cy7 1:300
Add 50 μL of the solution to each well. Dissociate into single cell suspension by pipetting.
Incubate cells for 10 min in the dark at 4 °C.
Wash cells twice with 150 μL of PBS and 2% FBS.
Centrifuge the plate at 1,500 rpm for 5 min and discard the supernatant.
Resuspend cells in 100 μL of PBS and 2% FBS.
Acquire samples at FACS.
3. Magnetic Enrichment of c-Kit+ Cells
Prepare a buffer solution containing PBS, pH 7.2, 0.5% bovine serum albumin (BSA), and 2 mM EDTA.
Resuspend the cell pellet of bone marrows derived from at least 10 mice in 1 mL of buffer solution containing c-Kit mAb conjugated to APC diluted 1:50.
Incubate cells for 20 min in the dark at 4 °C.
Wash two times the cells with 40 mL of buffer solution.
Centrifuge the tube at 1,500 rpm for 5 min and carefully remove the supernatant by aspiration. Make sure not to disturb the pellet.
Resuspend cell pellet and add 50 μl of Anti-APC MicroBeads for each euthanized mouse directly to the pellet.
Mix well and incubate for 20 min in the dark at 4 °C.
Wash cells by adding 40 mL of buffer solution and centrifuge at 1,500 rpm for 5 min. Aspirate supernatant completely.
Resuspend cell pellet in multiple of 4 mL of buffer solution every three mice euthanized.
Place MACS LS columns in the magnetic field of a suitable MACS Separator. Use 1 column every three mice euthanized.
Prepare columns by rinsing with 4 mL of buffer solution.
Apply cell suspension onto the columns.
Collect unlabeled cells that pass through and wash column with 4 mL of buffer solution. Perform washing steps by adding 4 mL of buffer solution three times. Add new buffer when the column reservoir is emptied.
Remove columns from the separator and place each one on top of 15 mL falcon tubes.
Pipette 4 mL of buffer solution onto each column. Immediately flush out the magnetically labeled cells by pushing the plunger into the column.
Centrifuge the tubes at 1,500 rpm for 5 min and carefully remove the supernatant by aspiration.
Resuspend each pellet with 1 mL of buffer solution and group pellets in a single 15 mL falcon tube.
4. Sorting of Hematopoietic Stem Cells and Lineage committed Progenitors
- Prepare a mix of mAbs directed against the following surface markers. Dilute them as indicated in 500 μL PBS and 2% FBS to stain the cells.
- CD4, CD8, CD3, CD45R, CD19, Gr1, Ter119, NK1.1 conjugated to PE-Cy5 1:200
- c-Kit conjugated to APC 1:100
- Sca-1 conjugated to biotin 1:50
- CD34 conjugated to FITC 1:50
- FcγR conjugated to PE 1:100
Centrifuge the tube from the previous section at 1,500 rpm for 5 min and carefully remove the supernatant by aspiration.
Add the mAbs mix to the pellet. Dissociate into single cell suspension by pipetting.
Incubate cells for 20 min in the dark at 4 °C.
Wash two times the cells with 14mL of PBS and 2% FBS.
Centrifuge the tube at 1,500 rpm for 5 min and discard the supernatant.
- Dilute streptavidin as indicated in 500 μL PBS and 2% FBS to stain the cells.
- Streptavidin conjugated to APC-Cy7 1:300
Add the solution to the tube. Dissociate into single cell suspension by pipetting.
Incubate cells for 10 min in the dark at 4 °C.
Wash two times the cells with 14 mL of PBS and 2% FBS.
Centrifuge the tube at 1,500 rpm for 5 min and discard the supernatant.
Resuspend cells in 500 μL of PBS and 2% FBS.
Transfer and filter the cell suspension in a new 5 mL tube in order to eliminate cellular aggregates that can interfere with the sorting procedure.
Add 5 μL of 7-AAD (use it diluted 1:100) to the cell suspension in order to exclude 7-AAD+ dead cells from the sorted populations.
- Sort cells with a BD FACSAria according to the following phenotypes:
- LKS cells: lin- c-Kit+ Sca-1+
- LT-HSCs: LKS CD34-
- ST-HSCs: LKS CD34+
- GMPs: lin- c-Kit+ Sca-1low FcγRhigh CD34+
- MEPs: lin- c-Kit+ Sca-1low FcγRlow CD34-
- CMPs: lin- c-Kit+ Sca-1low FcγRlow CD34+
5. Representative Results
Figure 1 shows and example of the electronic gating procedure to score common lymphoid progenitors (CLPs) as Lin-/c-Kitlo/interleukin (IL)-7R+ cells; Lin-/c-Kit+/Sca-1+ (LKS) and Lin-/c-Kit+/Sca-1lo (c-Kit+) cells; from the c-Kit+ gate, common myeloid progenitors (CMPs) are identified as FcγRloCD34+ cells, granulocyte/monocyte progenitors (GMPs) as FcγRhiCD34+ cells and megakaryocyte/erythrocyte progenitors (MEPs) as FcγRloCD34- cells; from the LKS gate, LT-HSC and ST-HSC are identified as CD34- and CD34+ cells, respectively. This bone marrow cell suspension can be enriched for c-Kit+ cells with magnetic beads (Fig. 2); LT-HSC and ST-HSC can then be sorted according to CD34 expression as well as other progenitors according to the phenotype described above.
HSCs can be analyzed in live imaging confocal microscopy as shown in Figure 4, where CD34- cells were stained with the nucleotide-binding compound quinacrine11 as well as nuclear red (DRAQ5). In HSCs, but not GMPs, quinacrine-positive vesicles are visible in the cytoplasm12. Moreover, sorted HSCs can be used in functional experiments as demonstrated in figure 5, which shows the increase in cytosolic Ca2+ in LT-HSC by activation of purinergic P2 receptors upon exposure to adenosine-triphosphate (ATP) and ionomycin12.
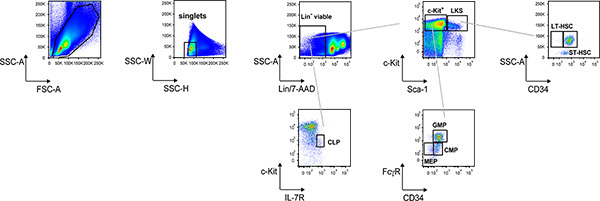 Figure 1. Representative dot plot analysis of Lin- BM cells. Electronic gating procedure at flow cytometer to identify and score hematopoietic progenitors and HSCs from bone marrow cell suspension stained as described in the protocol text.
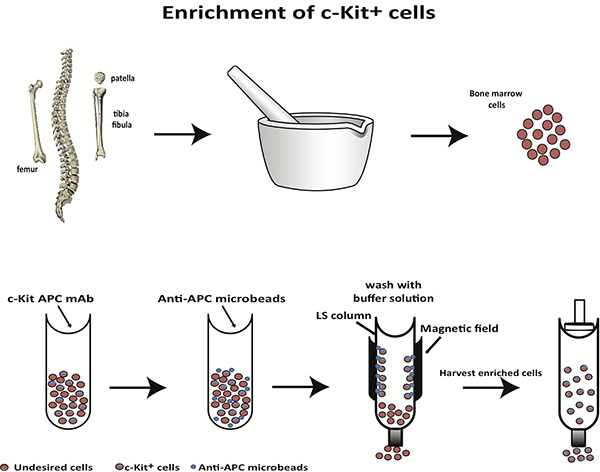 Figure 2. A scheme for selective enrichment of c-Kit+ cells from bone marrow.
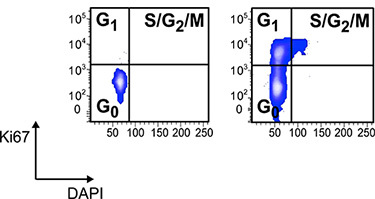 Figure 3. Cell cycle analysis of electronically gated LKS CD34- HSCs in healthy controls and mice with IBD stained with Ki-67 antibody and DAPI. Cells were fixed and permeabilized with Lyse/Fix and Perm buffers followed by staining with FITC conjugated Ki-67 and DAPI at 1 μg/ml. Cycling cells are barely if at all detectable in the LKS CD34- HSCs compartment of healthy controls12.
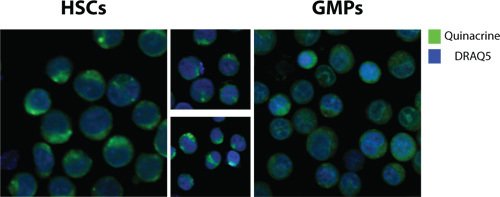 Figure 4. Live imaging confocal microscopy of FACS sorted CD34- HSCs and GMPs stained with the nucleotide-binding compound quinacrine and nuclear red (DRAQ5). The small quadrants show quinacrine positive vesicles detected in the cytoplasm of HSCs but not GMPs.
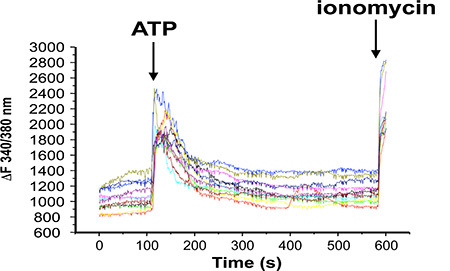 Figure 5. Cytosolic Ca2+ elevations in sorted HSCs loaded with Fura-2 and stimulated with ATP and ionomycin. Traces from single cells are shown. All cells were responsive to extracellular ATP showing prominent increase in cytosolic Ca2+ after addition of ATP.
Discussion
The method described here enables rapid and accurate analysis of hematopoiesis in individual mice (Figure 1). This analysis in various experimental settings, including murine models of inflammation, autoimmunity, immunodeficiency, degenerative diseases, metabolic disorders and cancer, allows addressing the impact of pathological conditions on hematopoiesis. Figure 3 shows the analysis of cell cycling activity on electronically gated LKSCD34- cells from healthy mice and mice with inflammatory bowel disease (IBD)13 by staining with Ki-67 mab and DAPI. The latter displayed a significant increase of cells in S/G2/M phases of the cell cycle. This analysis in flow cytometry demonstrates the impact of T cell mediated inflammation on HSC cycling activity12. Combination of magnetic labeling and enrichment of bone marrow cells expressing c-Kit with cell sorting in flow cytometry allows isolation of highly purified hematopoietic lineage progenitors and HSCs. The obtained cell populations can be used in a number of assays to study cell biology (Figure 4), signal transduction (Figure 5), developmentally regulated gene expression and in vitro as well as in vivo functional potential of distinct cell subsets. Indeed, magnetically enriched c-Kit+ cells were used to successfully engraft non-irradiated hosts to study dynamic variation of HSCs cycling activity in steady state and inflammation14. In our hands the procedure described here allows more efficient and faster recovery of bone marrow cells than bone flushing with an average yield of 200,000 LKS cells per mouse. The very small number of quiescent HSCs that can be isolated from pooled bone marrows of multiple mice constitutes a limit for experimental approaches requiring more cells. To obviate to this limitation, in many cases preliminary studies can be performed on more abundant LKS cells to envisage more focused and punctual analyses to be performed in CD34- quiescent HSCs.
Disclosures
No conflicts of interest declared.
Acknowledgments
We thank Nobuyuki Onai, Hitoshi Takizawa and Markus Manz for precious advice. This work was funded by Swiss National Science Foundation, Swiss Cancer League and Fondazione Ticinese per la RIcerca sul Cancro.
References
- Weissman IL. Stem cells: units of development, units of regeneration, and units in evolution. Cell. 2000;100:157–168. doi: 10.1016/s0092-8674(00)81692-x. [DOI] [PubMed] [Google Scholar]
- Calvi LM. Osteoblastic cells regulate the haematopoietic stem cell niche. Nature. 2003;425:841–846. doi: 10.1038/nature02040. [DOI] [PubMed] [Google Scholar]
- Zhang J. Identification of the haematopoietic stem cell niche and control of the niche size. Nature. 2003;425:836–841. doi: 10.1038/nature02041. [DOI] [PubMed] [Google Scholar]
- Kiel MJ, Yilmaz OH, Iwashita T, Terhorst C, Morrison SJ. SLAM family receptors distinguish hematopoietic stem and progenitor cells and reveal endothelial niches for stem cells. Cell. 2005;121:1109–1121. doi: 10.1016/j.cell.2005.05.026. [DOI] [PubMed] [Google Scholar]
- Arai F. Tie2/angiopoietin-1 signaling regulates hematopoietic stem cell quiescence in the bone marrow niche. Cell. 2004;118:149–161. doi: 10.1016/j.cell.2004.07.004. [DOI] [PubMed] [Google Scholar]
- Essers MA. IFNalpha activates dormant haematopoietic stem cells in vivo. Nature. 2009;458:904–908. doi: 10.1038/nature07815. [DOI] [PubMed] [Google Scholar]
- Nagai Y. Toll-like receptors on hematopoietic progenitor cells stimulate innate immune system replenishment. Immunity. 2006;24:801–812. doi: 10.1016/j.immuni.2006.04.008. [DOI] [PMC free article] [PubMed] [Google Scholar]
- Wilson A. Hematopoietic stem cells reversibly switch from dormancy to self-renewal during homeostasis and repair. Cell. 2008;135:1118–1129. doi: 10.1016/j.cell.2008.10.048. [DOI] [PubMed] [Google Scholar]
- Osawa M, Hanada K, Hamada H, Nakauchi H. Long-term lymphohematopoietic reconstitution by a single CD34-low/negative hematopoietic stem cell. Science. 1996;273:242–245. doi: 10.1126/science.273.5272.242. [DOI] [PubMed] [Google Scholar]
- Lo Celso C, Scadden D, D Isolation and Transplantation of Hematopoietic Stem Cells (HSCs. J. Vis. Exp. 2007. p. e157. [DOI] [PMC free article] [PubMed]
- Romanello M. Autocrine/paracrine stimulation of purinergic receptors in osteoblasts: contribution of vesicular ATP release. Biochem. Biophys. Res. Commun. 2005;331:1429–1438. doi: 10.1016/j.bbrc.2005.03.246. [DOI] [PubMed] [Google Scholar]
- Casati A. Cell-autonomous regulation of hematopoietic stem cell cycling activity by ATP. Cell Death Differ. 2011;18:396–404. doi: 10.1038/cdd.2010.107. [DOI] [PMC free article] [PubMed] [Google Scholar]
- Bouma G, Strober W. The immunological and genetic basis of inflammatory bowel disease. Nat. Rev. Immunol. 2003;3:521–533. doi: 10.1038/nri1132. [DOI] [PubMed] [Google Scholar]
- Takizawa H, Regoes RR, Boddupalli CS, Bonhoeffer S, Manz MG. Dynamic variation in cycling of hematopoietic stem cells in steady state and inflammation. J. Exp. Med. 2011;208:273–284. doi: 10.1084/jem.20101643. [DOI] [PMC free article] [PubMed] [Google Scholar]


