

Abstract
Recent epidemiologic studies have noted that risk factors for atherosclerosis (for example, diabetes mellitus, hypertension, and hyperlipidemia) are associated with increased risk of incident Alzheimer's disease (AD). In this evidence-based review, we frame the proposition as a question: are vascular risk factors also risk factors for plaques and tangles or just for concomitant vascular pathology that increases the likelihood of dementia? To date, no representative, prospective studies with autopsy (evidence level A) show significant positive associations between diabetes mellitus, hypertension, or intracranial atherosclerosis and plaques or tangles. Some prospective, representative, epidemiologic studies (evidence level B) show associations between diabetes, hypertension, hyperlipidemia, and aggregated risk factors with clinically diagnosed incident AD. However, the strength of association diminishes in the following order: vascular dementia (VaD) > AD + VaD > AD. This pattern is arguably more consistent with the hypothesis that atherosclerosis promotes subclinical vascular brain injury, thereby increasing the likelihood of dementia and in some cases making symptoms present earlier. Several autopsy studies from AD brain banks (evidence level C) have observed positive associations between intracranial atherosclerosis and severity of plaques and tangles. However, these studies may reflect selection bias; these associations are not confirmed when cases are drawn from non-dementia settings. We conclude that, at the present time, there is no consistent body of evidence to show that vascular risk factors increase AD pathology.
Framing the question
Neurodegenerative and cerebrovascular diseases are the most common causes of disabling cognitive impairment in late life. Alzheimer's disease (AD), defined by wide-spread amyloid/neuritic plaques (NPs) and neurofibrillary tangles (NFTs), is the prototypical neurodegenerative disorder. Atherosclerosis leading to cerebral infarction and stroke is the prototypical cerebrovascular disease. Historically, these were considered two common but parallel and independent pathways leading to cognitive decline.
Recently, the concept that risk factors for atherosclerosis are also risk factors for AD has gained traction. This hypothesis has been driven largely by some [1,2], but not all [3], epidemiologic studies wherein recognized risk factors for atherosclerosis (for example, diabetes mellitus, hypertension, hyperlipidemia, and aggregate risk) are associated with increased risk of incident clinically diagnosed AD. This, in turn, has given rise to the proposition that 'vascular risk factors are also risk factors for AD'.
In this paper, we step back to frame the proposition as a question: are vascular risk factors also risk factors for plaques and tangles or just for concomitant vascular pathology that increases the likelihood of dementia (Figure 1)? In our minds, this question remains open, although data from a growing number of prospective community-based autopsy studies indicate the latter. Our objective is to critically review the literature, highlighting current methodological limitations in diagnosis, sampling, and measurement. We emphasize the need for pathological information, representative sampling, and prospective study design to optimally address the question. We focus on atherosclerosis and three of its major risk factors - diabetes mellitus, hypertension, and hyperlipidemia - as the independent measures. Because of space limitations, we do not cover other common risk factors for atherosclerosis, including smoking, hyper-homocysteinemia, or inflammatory factors. In this review, we also leave aside cerebral amyloid angiopathy, a type of cerebrovascular disease closely associated with the cerebral hallmarks of AD as well as the mutual risk factor apolipoprotein E (APOE) ε4.
Figure 1.
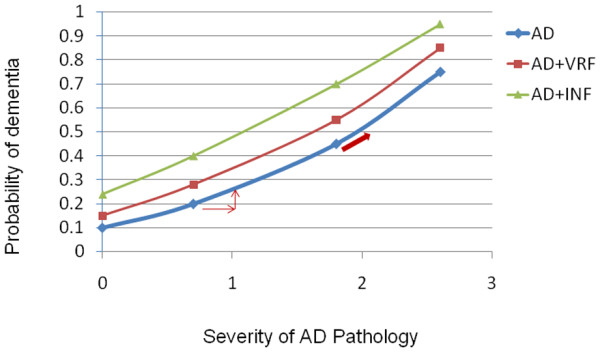
Graph showing two alternative explanations. Do vascular risk factors (VRF) increase the probability of dementia by increasing plaques and tangles (arrows) or through subclinical infarcts (INF) (red line)? AD, Alzheimer's disease.
Quality of evidence
Quality of evidence is determined by study design, sampling method, and accuracy of diagnosis (Table 1). Since AD is currently defined as a clinical-pathological entity, the ideal methodology for the question posed in this review is a population-based cohort, established in midlife and followed prospectively to autopsy. In this review, we group the literature related to vascular risk factors and AD into three methodological categories: 1) representative and non-representative prospective longitudinal cohort studies including autopsy (level A); 2) representative and non-representative prospective longitudinal studies without autopsy (level B); and 3) cross-sectional neuropathological studies (level C). Cross-sectional clinical studies without autopsy are not included in this review (level D).
Table 1.
Grading system for quality of evidence
| Grade of evidence | Sampling | Design | Information |
|---|---|---|---|
| A1 | Representative | Longitudinal prospective | Clinical and autopsy |
| A2 | Non-representative | Longitudinal prospective | Clinical and autopsy |
| B1 | Representative | Longitudinal prospective | Clinical only |
| B2 | Non-representative | Longitudinal prospective | Clinical only |
| C1 | Representative | Cross-sectional | Clinical and autopsy |
| C2 | Non-representative | Cross-sectional | Clinical and autopsy |
| D1 | Representative | Cross-sectional | Clinical only |
| D2 | Non representative | Cross-sectional | Clinical only |
The quality of ascertaining vascular risk factors, the criteria for diagnosis of dementia, and the method of rating distribution and severity of neuropathology vary considerably. Information about vascular risk factors ranges from self-report, proxy informants, medical records, to direct clinical and laboratory measures that are ascertained cross-sectionally or longitudinally. Differential misclassification of risk factors by self-report (for example, over-reported in AD group and under-reported in control group) will bias the associations between vascular risk factors and AD positively. In addition, temporality of risk factor assessment (for example, midlife versus late life) may affect the associations observed since neurodegenerative brain changes begin by middle age and exposure to risk factors changes over time. Besides the simple presence versus absence of a risk factor, the duration and magnitude of exposure to a risk factor should also be ideally considered. Epidemiological studies have diagnostic limitations since cases are usually defined based on a predetermined cutoff. Consequently, there is a possibility that 'mild dementia' cases are included in the normal group, which may attenuate the association between dementia and its risk factors.
A pathological diagnosis of AD, based on severity and distribution of NFTs and NPs [4], remains the gold standard for diagnosis. Using the Consortium to Establish a Registry for Alzheimer's Disease (CERAD) criteria as the reference standard, a clinical diagnosis of AD, based on typical clinical presentation and the exclusion of other causes of dementia [5], showed 93% sensitivity but only 55% specificity [6]. An evidenced-based review of the literature in 2002 [7] showed small positive likelihood ratios for the diagnosis of dementia subtype (that is, 2 to 5) compared to the generic diagnosis of dementia (that is, >10). It is even more difficult to diagnose dementia due to mixed pathologies, yet in community-based studies, over half of older subjects with dementia harbor mixed pathologies at autopsy [8-10], often showing infarcts up to half of which were not detected during life [11]. In the absence of a true association between vascular risk factors and AD, misclassification of mixed AD/vascular dementia (VaD) cases as clinical AD would positively bias the associations between vascular risk factors and AD. Cerebrospinal fluid markers of amyloid-beta (Aβ) and phospho-tau and amyloid PET imaging have recently been incorporated into clinical research criteria [12] and promise to improve specificity of the clinical diagnosis in the future.
While autopsy studies minimize errors in diagnosis, neuropathological data may be limited in many important ways. Neuropathological data are themselves cross-sectional (that is, can only be collected once); it is difficult, therefore, to determine sequence and causality based on neuropathological findings. At autopsy, severity of atherosclerosis, NFTs, NPs, and number of infarcts are often limited to semi-ordinal measures of severity, which may limit the power to detect small associations. Autopsy samples of convenience are likely to include significant selection bias (level of evidence = C). When a participant is selected from hospitals, memory clinics, or tertiary referral centers, the underlying population is usually not definable. Vascular pathology is relatively under-represented in autopsy studies drawn from memory clinics versus the community [13]. Figure 2 illustrates highly overlapping atherosclerosis, stroke, and AD pathologies in an older population. Figure 2 also shows how retrospective selection of cases may lead to a comparison between AD cases and super healthy controls (CN1) that have neither AD nor vascular disease, leading to a spurious association between vascular risk factors and AD.
Figure 2.
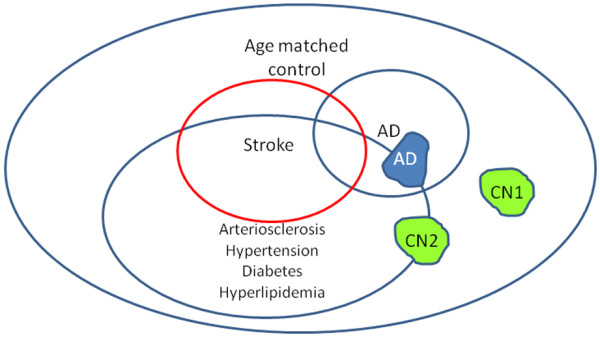
Sampling frame for convenience sample of Alzheimer's disease subjects and normal controls. Green shows two samples of normal controls (CN): CN1 is highly selected and CN2 is randomly sampled. In a cohort of Alzheimer's disease subjects (AD) and CN1, an association will be found between arteriosclerosis and Alzheimer's disease. In a cohort of AD and CN2, no such association will be found.
A much stronger study design would be a population-based sample, followed prospectively from midlife to autopsy (level of evidence = A1). In such a cohort, the distribution of vascular risk factors of the cohort should be representative of the population (Figure 3). Establishment of the cohort in midlife, well before the expression of disease, eliminates important aspects of selection bias. If the cohort is established later in life, when subjects at highest risk have already died, associations may be weakened and even reverse direction. If the cohort is assembled later in life and followed prospectively, comparable diagnostic thresholds can be used to first identify and remove prevalent cases and then prospectively identify incident cases (Figures 4 and 5). This prospective design strengthens the etiological significance of associations between risk factors and incident disease (level of evidence = B). Ideally, prospective longitudinal studies will include autopsy to confirm associations between risk factors and neuropathologically defined disease (level of evidence = A).
Figure 3.
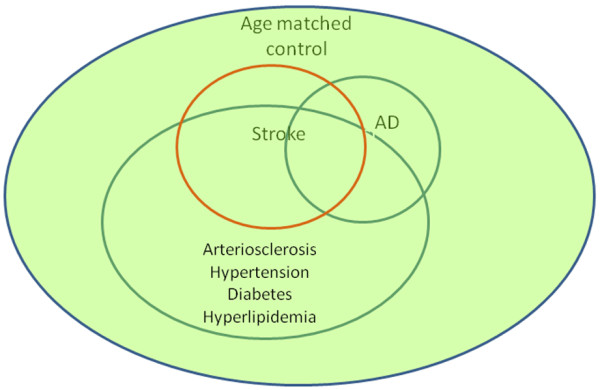
Sampling frame for a longitudinal aging cohort. An aging cohort study includes normal controls and subjects with Alzheimer's disease (AD) and stroke. The severity of arteriosclerosis and vascular risk factors are randomly sampled and representative for each group.
Figure 4.
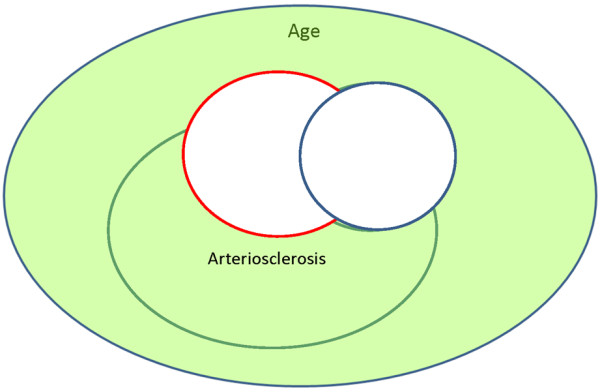
Sampling frame for a longitudinal aging cohort. At baseline examination, prevalent cases of stroke and Alzheimer's disease (AD) are identified and excluded from longitudinal follow-up.
Figure 5.
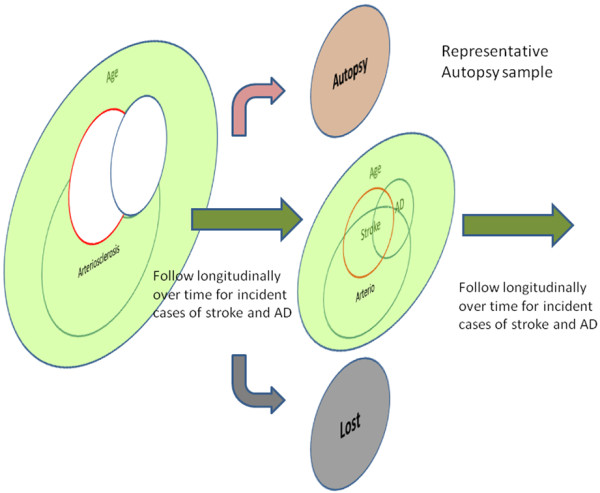
Sampling frame for a longitudinal aging cohort. Prospective longitudinal follow-up allows estimation of new incident cases of stroke and Alzheimer's disease (AD). In ideal circumstances, it also allows the collection of a representative autopsy sample.
Level A evidence
A summary of level A evidence is provided in Table 2. In a 2006 review [14], six studies were identified as true population-based autopsy studies of dementia (grade A1). Three of these studies have published data relevant to our question: 1) the Hisayama study (Japan); 2) the Honolulu Asia Aging Study (HAAS; Hawaii, USA); and 3) the Vantaa 85+ study (Finland). There are also several longitudinal, neuropathological studies drawn from special but non-representative cohorts (grade A2): 1) the Baltimore Longitudinal Study on Aging; 2) the Religious Orders Study (ROS); and 3) the Adult Changes in Thought study.
Table 2.
Longitudinal aging cohort with autopsy
| Grade | Study | Original sample | Autopsy sample | AD pathology | Cerebral infarcts |
|---|---|---|---|---|---|
| A1 | Peila et al. 2002 [15]; Honolulu Asia Aging Study 1991 | Community-based Japanese-American males (n = 3,734) | 216/521 deaths (42.5%) | Negative: type 2 diabetes was not associated with cortical neuritic plaques (RR 0.8, 95% CI 0.5 to 1.4) or tangles (RR 1.0, 95% CI 0.6 to 2.4) | Positive: type 2 diabetes was associated with higher risk of large infarcts (RR 1.8, 95% CI 1.1 to 3.0) |
| A2 | Arvanitakis et al. 2006 [18]; Religious Orders Study | Older Catholic nuns, priests, or brothers (n = 1,060) | 233 autopsies (94%) | Negative: diabetes was not related to global AD pathology score, or to specific measures of neuritic plaques, diffuse plaques or tangles, or to amyloid burden or tangle density | Positive: diabetes (present in 15% subjects) was associated with an increased odds of infarction (OR 2.47, 95% CI 1.16 to 5.24) |
| A2 | Wang et al. 2009 [19]; Adult Changes in Thought | Health Maintenance Organization (n = 2,581) | 250/1,167 deaths (21.4%) | Negative: hypertension in midlife was not associated with plaques and tangles | Positive: among persons aged <80 years, each 10 mmHg increase in systolic blood pressure was associated with 1.15 (95% CI 1.0 to 1.33) increased risk of ≥ 2 microinfarcts |
| A1 | Ahtilouoto et al. 2010 [16]; Vantaa 85%+ Study | Community-based, elderly longitudinal study (n = 553) | n = 291 (48% of total cohort; age = 92+ years) | Negative: history of diabetes mellitus was less likely to have Aβ (OR 0.48, 95% CI 0.23 to 0.98) and tangles (OR 0.72, 95% CI 0.39 to 1.33) | Positive: history of diabetes mellitus was more likely to have cerebral infarcts (OR 1.88, 95% CI 1.06 to 3.34) |
| A2 | Dolan et al. 2010 [20]; Baltimore Longitudinal Study on Aging | Longitudinal cohort study with autopsy; number of incident dementia cohort = 1,236 (Kawas et al. 2000 [48]) | n = 200 (16% of incident cohort; 87.6 ± 7.1 years) | Negative: no relationship between the degree of atherosclerosis in intracranial, aorta, or heart and the degree of AD-type brain pathology | Positive: intracranial atherosclerosis significantly increased the odds of infarcts (OR = 1.8, 95% CI 1.2 to 2.7) and for dementia, independent of cerebral infarction |
Aβ, amyloid-beta; AD, Alzheimer's disease; CI, confidence interval; OR, odds ratio; RR, relative risk.
Among 216 autopsied cases of Japanese-American men enrolled in HAAS [15], diabetes was associated with increased risk of large cerebral infarcts (relative risk (RR) = 1.8, 95% confidence interval (CI) 1.1 to 3.0), but not with NPs or NFTs. Strengths in the HAAS study design included a representative autopsy sample (high 42% autopsy rate for an epidemiological study), ascertainment of diabetes in midlife by history, fasting, and 2 hour postprandial glucose, and adjustment for potential confounders (that is, age, education, APOE4 ε4 status, and other vascular risk factors).
The Vantaa 85+ study focused on diabetes among 553 residents of Vantaa, Finland aged ≥85 years [16]. Autopsies were performed in nearly half (48%; n = 291) of the total population. Diabetes at baseline doubled the incidence of clinically defined dementia, AD, and VaD. However, at autopsy, subjects with diabetes were less likely to have Aβ (odds ratio (OR) = 0.48, 95% CI 0.23 to 0.98) and tangles (OR = 0.72, 95% CI 0.39 to 1.33), but more likely to have cerebral infarcts (OR = 1.88, 95% CI 1.06 to 3.34), after adjustment for age, education, APOE ε4 status, and other vascular risk factors. The investigators concluded that older patients with diabetes develop more extensive vascular, but not AD, pathology, proposing that vascular pathology, alone or together with AD, could explain the elevated risk of all-cause dementia associated with diabetes.
In the ROS, diabetes was associated with elevated risk for incident AD (hazard ratio = 1.65, 95% CI 1.10 to 2.47) [17]. In an autopsy study (n = 233) from the same cohort, diabetes was associated with cerebral infarcts (OR = 2.47, 95% CI 1.16 to 5.24), but not with global AD pathology or specific measures of NPs, diffuse plaques, amyloid burden, tangles or tangle densities [18]. These ROS findings strongly suggest that the relationship between diabetes and incident AD may be mediated by the additive effects on dementia of subclinical cerebral infarction.
In the Adult Changes in Thought study, blood pressure measured later in life was associated with cortical microinfarcts, but not with plaques or tangles [19]. Since microinfarcts are too small to be detected by clinical exam or neuroimaging, these dementia cases may be clinically diagnosed as AD.
Among 200 autopsy cases in the prospective Baltimore Longitudinal Study on Aging, quantitative measures of atherosclerosis in the aorta, heart, and intracranial vessels were not associated with the degree of AD-type brain pathology [20]. However, intracranial atherosclerosis significantly increased the odds of dementia within 18 months of death, independent of cerebral infarction, through still unclear pathways.
In summary, no level A evidence supports the hypothesis that diabetes, hypertension or atherosclerosis increases plaques and tangles, although these factors all increase the risk of vascular lesions and dementia. Increased risk of dementia appears to be mediated, at least in part, through subclinical ischemic brain injury, including microinfarcts that escape clinical detection.
Level B evidence
The concept that risk factors for atherosclerosis and stroke (for example, diabetes mellitus, hypertension, hyperlipidemia) are also risk factors for AD stems largely from epidemiologic studies conducted over the past 20 years. The fundamental limitation to interpreting these studies is that disease state is clinically defined. While it is highly likely that AD pathology is present in clinically diagnosed dementia, it is also likely that vascular pathology is also present. In the absence of symptomatic stroke, however, the default etiologic diagnosis is often AD. With respect to the clinical diagnosis of VaD, the sensitivity, specificity and degree to which 'pure' vascular cases are identified varies widely depending upon choice of criteria and the availability of neuroimaging studies [21]. Thus, one cannot assume that 'clinical AD' means that vascular brain injury is absent, or that 'clinical VaD' means that AD is absent, or that an association between vascular risk factors and incident dementia is necessarily reflected in an association between risk factors and AD pathology.
Diabetes mellitus
A systematic overview of 25 prospective studies with clinical outcomes [22] concluded that people with diabetes have: 1) a greater rate of decline in cognitive function; 2) a 1.5-fold greater risk of cognitive decline; and 3) a 1.6-fold greater risk of future dementia, especially vascular cognitive impairment and dementia, relative to persons without diabetes. Below we discuss several particularly important population- or community-based studies (Table 3).
Table 3.
Diabetes and relative risk of incident dementia
| Number of subjects | RR (95% CI) | |||||||||
|---|---|---|---|---|---|---|---|---|---|---|
| Grade | Study | Age (years) | Follow-up (years) | Definition | DM | No DM | All dementia | VaD | AD + VaD | AD |
| B1 | Yoshitake et al. 1995 [11]; Hisayama 1985 to 1992 (n = 828) | >65 | 7 | Hx | 70 | 756 | 2.8 (2.6, 3.0)a | 2.2 (0.97, 4.9)a | ||
| B1 | Ott et al. 1999 [23]; Rotterdam 1990 to 1994 (n = 6,370) | >55 | 2.1 | Hx: Glu >11 mmol/L | 692 | 5,678 | 1.9 (1.3, 2.8)b | 2.0 (0.7, 5.6)b | 3.0 (1.0, 9.3)b | 1.8 (1.1, 3.0)b |
| B1 | Luchsinger et al. 2001 [49]; WHICAP 1992 to 1997 (n = 1,262) | ≥65, mean 75.6 (SD 5.9) | 4.3 | Hx | 255 | 1,007 | 3.4 (1.7, 6.9)c | 1.3 (0.8, 1.9)d | ||
| B1 | MacKnight et al. 2002 [26]; CSHA (n = 5,574) | ≥65 | 4-6 | Hx: Glu >11.1 mmol/L | 503 | 5,071 | 1.26 (0.9, 1.7)e | 2.03 (1.15, 3.5)e | 1.3 (0.83, 2.1)e | |
| B1 | Peila et al. 2002 [15]; HAAS 1991 to 1996 (n = 2,574) | 72-93 | 2.9 | Hx DM: FBS >120 mg/dl | 900 | 1,674 | 1.5 (1.0, 2.2)f | 2.3 (1.1, 5.0)f | 1.8 (1.1, 2.9)f | 1.6 (0.9, 3.0)f |
| B1 | Cheng et al. 2011 [25]; WHICAP 1999 to 2001 (n = 1,488) | >65 | Hx | 1.7 (1.4, 2.90)g | 1.6 (1.0, 2.6)g | 1.3 (0.8, 2.2)g | ||||
| B2 | Arvanitakis et al. 2004 [17]; Religious Orders Study (n = 990) | 75 | 5.5 | Hx | 127 | 697 | 1.6 (1.1, 2.5)h | |||
| B2 | Ahtilouoto et al. 2010 [16]; Vantaa 85+ (n = 588) | >85 | Hx | 87 | 268 | 2.09 (1.34, 3.25) No APOE4: 1.68 (0.99, 2.83) With APOE4: 3.80 (1.69, 8.53) | ||||
aAdjusted for age. bAdjusted for age and sex. cAdjusted for gender, history of hypertension, history of heart disease, low density lipoprotein cholesterol level, ethnic group, education, and smoking. dAdjusted for gender, ethnic group, education, and presence of the APOE ε4 allele. eAdjusted for demographics and vascular disease. fAdjusted for age, education, APOE ε4 status, diabetes medications, alcohol, smoking status, midlife systolic blood pressure, cholesterol, body mass index, ankle brachial index, stroke, and coronary heart disease. gAdjusted for age, sex, education, ethnic group and APOE ε4. hAdjusted for age, sex, and education. Entries in bold indicate significant RR ratios. AD, Alzheimer's disease; APOE, apolipoprotein E; CI, confidence interval; CSHA, Canadian Study of Health and Aging; DM, diabetes mellitus; FBS, fasting blood sugar; Hx, history; OR, odds ratio; RR, relative risk; SD, standard deviation; VaD, vascular dementia; WHICAP, Washington Heights-Inwood Columbia Aging Project.
In the Rotterdam Study, diabetes increased the risk of dementia, mostly for VaD, followed by AD + VaD, then AD [23]. The investigators proposed either that diabetes contributes to AD pathology or that silent cerebral infarcts may uncover imminent AD. In two cohorts recruited successively in the multi-ethnic Washington Heights-Inwood Columbia Aging Project (WHICAP) study, history of diabetes mellitus significantly increased the risk of AD [24], but the association weakened when cases with mixed AD/cerebrovascular disease were removed [25]. In the HAAS [15], diabetes was defined by laboratory testing, and showed progressively diminishing risk with VaD (RR = 2.3, 95% CI 1.1 to 5.0), AD with VaD (RR = 1.8, 95% CI 1.1 to 2.9), and AD without VaD (RR = 1.6, 95% CI 0.9 to 3.0), controlling for age, education, APOE e4 status, and other vascular risk factors. In the ROS, diabetes was associated with a 65% increase in the risk of developing AD (hazard ratio = 1.65, 95% CI 1.10 to 2.47) [17]. In findings that deviate somewhat from the pattern above, subjects with diabetes in the Canadian Study on Health and Aging had a higher risk of incident vascular cognitive impairment (RR = 1.62, 95% CI 1.12 to 2.33) and its subtypes, VaD (RR = 2.03, 95% CI 1.15 to 3.57), and vascular cognitive impairment-no dementia (vascular CIND; RR = 1.68, 95% CI 1.01 to 2.78), but not AD or mixed AD/VaD [26]. In the Hisayama Study (done without neuroimaging), diabetes doubled the risk for VaD, but not AD [11].
In sum, there is robust evidence that diabetes increases cerebral infarcts and cognitive decline; the evidence that diabetes specifically increases AD pathology is mixed at best. Associations between diabetes and clinical AD could reflect additive effects of subclinical vascular disease (elevated by diabetes) and AD pathology (that is perhaps independent of diabetes).
Hypertension
Measurement of blood pressure is complex: parameters relevant to dementia outcomes include the stage of life during which blood pressure is measured, modeling of diastolic versus systolic measures, and whether or not blood pressure is treated. Systolic blood pressure increases, while diastolic blood pressure decreases with age. Measures such as blood pressure variability and reactivity have also been considered. Here we summarize studies of systolic or diastolic blood pressure in longitudinal population or community studies with incident clinical dementia outcomes (Table 4).
Table 4.
Hypertension and relative risk of incident dementia
| Age (mean ± SD) | Mean follow-up (years) | Number of subjects | RR (95% CI) | |||||||
|---|---|---|---|---|---|---|---|---|---|---|
| Grade | Study | Definition | HTN | NL | All dementia | VaD | AD + VaD | AD | ||
| B1 | Yoshitake et al. 1995 [11]; Hisayama (n = 828) | 73.6 ± 5.9a | 7 | Per 1 SD increase (23 mmHg) | 1.6 (1.2, 2.2)b | 1.0 (0.7, 1.4)b | ||||
| B1 | Launer et al. 2000 [27]; HAAS (n = 3,734) | 52.7 ± 4.7 (men) | 27 | Untreated SBP ≥160 | 227 | 2,295 | 4.85 (1.99, 11.83)c | 10.68 (3.49, 32.64)c | 1.75 (0.58, 5.29)c | - |
| Untreated DBP ≥90 | 132 | 1,128 | 4.32 (1.72, 10.85)c | 4.61 (1.61, 13.19)c | 2.78 (0.54, 14.25)c | 6.6 (2.0, 21.4)c | ||||
| B1 | Kivipelto et al. 2002 [35] (n = 2,293) | 50.2 ± 6.0 | 21 | SBP 140-159 | - | - | 1.9 (0.8, 4.8)d | 1.6 (0.7, 4.2)d | ||
| SBP = 160 | - | - | 2.8 (1.1, 7.2)d | 2.6 (1.1, 7.2)d | ||||||
| DBP 90-94 | - | - | 1.4 (0.5, 3.6)d | 1.2 (0.4, 3.3)d | ||||||
| DBP ≥ 90 | - | - | 2.3 (1.1, 5.1)d | 2.0 (0.9, 4.6)d | ||||||
| B1 | Qiu et al. 2010 [2]; Kungsholmen (n = 1,270) | 81.5 ± 5.0 | 5.1 | SBP 140-159 | 127 | 278 | 1.22 (0.89, 1.68)e | 1.47 (1.02, 2.12)e | ||
| SBP ≥ 160 | 127 | 351 | 1.49 (0.94, 2.37)e | 1.84 (1.06, 3.18)e | ||||||
| B1 | Rönnemaa et al. 2011 [3]; Uppsala (n = 2,268) | 49.6 ± 0.6 | 29 | Per 1 SD increase (18 mmHg) | 1.2 (1.0, 1.3)f | 1.3 (1.1, 1.6)f | 1.1 (1.0, 1.2)f | 1.0 (0.8, 1.2)f | ||
| 71.0 ± 0.6 | 13 | Per 1 SD increase (19 mmHg) | 1.2 (1.0, 1.3)f | 1.6 (1.2, 2.1)f | 1.1 (1.0, 1.3)f | 1.0 (0.8, 1.2)f | ||||
| B2 | Shah et al. 2006 [28]; ROS (n = 824) | 75 ± 7 | 6.0 | Per 1 mmHg increase in SBP | 0.995 (0.986, 1.004)g | |||||
| Per 1 mmHg increase in SBP | 1.000 (0.985, 1.015)g | |||||||||
aSample mean age and pooled standard deviation (SD) calculated based on mean age ± SD of the male and female groups provided in the paper. bAdjusted for age. cAdjusted for age, education, APOE ε4 status, smoking and alcohol consumption. dAdjusted for age, APOE ε4 status, education, gender, smoking and alcohol consumption. eAdjusted for age, gender, education, APOE ε4 status, follow-up survival status, baseline Mini-Mental State Examination, body mass index, coronary heart disease, and use of blood pressure lowering drugs. fAdjusted for age and education. gAdjusted for age, gender, and education. Entries in bold indicate significant relative risk (RR) ratios. AD, Alzheimer's disease; DBP, diastolic blood pressure; HAAS, Honolulu Asia Aging Study; HTN, hypertension; NL, normal; ROS, Religious Orders Study; SBP, systolic blood pressure; SD, standard deviation; VaD, vascular dementia.
In an initial report from HAAS, untreated, elevated systolic or diastolic midlife blood pressure predicted higher rates of all cause dementia and, specifically, AD dementia in late life [27]. This finding has not been clearly replicated. In the Uppsala study, midlife systolic blood pressure in men was positively associated with vascular and mixed dementias, but not AD [3]. The ROS found no effects of late-life blood pressure on dementia incidence [28]. A recent report from the Kungholmen project showed positive associations between late-life systolic blood pressure and AD as well as all-cause dementia [2]. In the Hisayama study [11], every 1 standard deviation (23 mmHg) increase in systolic blood pressure was associated with a 53% increase in the risk of VaD (RR = 1.53, 95% CI 1.16 to 2.01), but was not associated with AD risk. Studies have shown additive effects on cognitive decline related to hypertension alone and combined with other risk factors, including diabetes [29] and APOE ε4 [30].
The literature on blood pressure effects is often interpreted as showing that midlife, but not late life, elevations are associated with dementia and AD. However, the evidence does not entirely support that conclusion; the epidemiological literature is inconsistent with respect to both late-life and midlife blood pressure effects. The limited data from longitudinal autopsy studies do not clarify the picture.
Hyperlipidemia
APOE is associated with cholesterol transport. The ε4 allele is the strongest known genetic risk factor for AD [31], and is also associated with dyslipidemia and coronary heart disease [32]. Cholesterol levels decrease with increasing age [33,34]. Therefore, in seeking associations between cholesterol and risk of AD, it is important to control for apoE genotype and to consider age at the time cholesterol was measured as well as the use of lipid-lowering medications.
The literature regarding cholesterol and risk of AD is inconsistent and difficult to interpret (Table 5). Regarding midlife cholesterol, studies from two community cohorts reported positive associations between elevated total cholesterol and development of dementia and AD [33,35]; a third study showed a similar trend [36]. In contrast, measured cholesterol later in life tends to show either no association [37] or an inverse association [38-40]. Interestingly, analysis of longitudinal cholesterol data from Finland [33] showed that, compared to men who remained dementia free, men who developed AD had higher cholesterol levels in midlife but greater declines in total cholesterol levels over 30 years, and thus lower cholesterol levels in late life. This trajectory would explain the reversal of associations depending on the age at which cholesterol levels were determined. However, in the Framingham study neither midlife cholesterol averaged over 30 years nor late-life cholesterol were associated with AD risk [34]. Inverse associations are found in more recent studies that adjusted for cerebrovascular disease and APOE genotype [38,39]. Thus, the relationship between cholesterol and risk of AD remains far from clear.
Table 5.
Cholesterol and relative risk of subsequent dementia
| Number of subjects | RR (95% CI) | |||||||||
|---|---|---|---|---|---|---|---|---|---|---|
| Grade | Study | Age@Chol (years) | Follow-up (years) | Definition (mmol/L) | High | NL | All dementia | VaD | AD + VaD | AD |
| Mid-life cholesterol and relative risk of subsequent dementia | ||||||||||
| B1 | Notkola et al. 1998 [33]; Finnish cohorts (n = 444) | 40-59 (men) | 30 | Chol ≥6.5 mmol/L averaged over 4 visits | 184 | 260 | 3.1 (1.2, 8.5)a | |||
| B1 | Kalmijn et al. 2000 [36]; HAAS (n = 3,734) | 52.7 ± 4.7 (men) | 27 | Per 1 SD = 0.92 | 1.10 (0.95, 1.26) | |||||
| B1 | Kivipelto et al. 2002 [35]; FIN-MONICA (n = 2,293) | 50.2 ± 6.0 | 21 | Chol ≥6.5 mmol/L | NA | NA | 2.6 (1.2, 6.0)b | 2.8 (1.2, 6.7)b | ||
| Late-life cholesterol and relative risk of subsequent dementia | ||||||||||
| B1 | Tan et al. 2003 [34]; 1988 Framingham (n = 1,026) | 76.1 | 12 | Per 0.3 mmol/L average chol over previous 15 visits (1950-1980) | 0.95 (0.87, 1.04)c | |||||
| Per 0.3 mmol/L cholesterol at visit 20 (1988) | 0.97 (0.90, 1.05)c | |||||||||
| B1 | Reitz et al. 2004 [38]; 1992 WHICAP - prospective (n = 1,168) | 78.4 ± 6.2 | 4.8 ± 2.9 | Chol ≥5.9 mmol/L | 291 | 877 | 1.61 (0.7, 3.74)d 1.05 (0.42, 2.60)e |
0.55 (0.32, 0.95)d 0.48 (0.26, 0.86)e |
||
| LDLc ≥3.67 mmol/L | 2.45 (1.05, 5.7)d | 0.88 (0.51, 1.51)d | ||||||||
| 2.07 (0.85, 5.06)e | 0.80 (0.46, 1.40)e | |||||||||
| B2 | Li et al. 2005 [37]; Group Health Cooperative (n = 2,141) | ≥65 | 5.6 ± 1.8 | Triglyceride >254 mg/dL HDLc <1.2 mmol/L |
1.16 (0.81,1.67)f 1.04 (0.69, 1.55)f |
1.0 (0.71, 2.15)f 1.23 (0.71, 2.15)f |
||||
| B1 | Mielke et al. 2005 [40]; Göteborg (n = 973) | 70 | 18 | Chol >8.0 mmol/L | 56 | 326 | 0.31 (0.11, 0.85)g | |||
| B1 | Reitz et al. 2010 [39]; 1999 WHICAP (n = 1,130) | 75.7 ± 6.3 | 3.96 | HDLc >1.42 mmol/L | 284 | 846 | 0.4 (0.2, 0.9)h | |||
| 3.1 < LDLc < 3.7 mmol/L | 283 | 847 | 0.5 (0.2, 0.9)h | |||||||
Note that 1 mmol/L cholesterol = 38.6 mg/dl cholesterol. aAdjusted for age and APOE4. bAdjusted for age and APOE4, education, sex, smoking, alcohol. cAdjusted for age, sex, APOE4, coronary artery disease, body mass index, and lipid-lowering medication. dAdjusted for sex, age, education and race. eAdjusted for body mass index, APOE4, diabetes, heart disease, hyperten sion. fAdusted for age, sex, education, Cognitice Abilities Screening Instrument, body mass index, hypertension, coronary artery disease, cerebrovascular disease, diabetes mellitus. gAdjusted for body mass index, diastolic blood pressure, sex, education, smoking. hAdjusted for age, sex, education, ethnic group APOE ε4 genotype, diabetes, hypertension, heart disease, body mass index, lipid-lowering treatment. Entries in bold indicate significant relative risk (RR) ratios. Age@Chol, age of subject when cholesterol was measured; AD, Alzheimer's disease; Chol, cholesterol; FIN-MONICA, Finnish part of Multinational Monitoring of Trends and Determinants in Cardiovascular Disease; HAAS, Honolulu Asia Aging Study; HDLc, high-density lipoprotein cholesterol; LDLc, low-density lipoprotein cholesterol; NA, not available; NL, normal; SD, standard deviation; VaD, vascular dementia; WHICAP, Washington Heights-Inwood Columbia Aging Project.
Aggregate risk factors
Because vascular risk factors frequently, but variably, cluster and because they may modify dementia risk through a common pathogenic pathway, examination of single risk factors may fail to identify true associations. A small number of epidemiological studies have examined the effects of aggregate vascular risk (Table 6). In WHICAP, the risk of incident AD increased in a dose-related fashion in relation to the number of vascular risk factors [24]. Qiu and colleagues [2] defined two distinct risk profiles, one for atherosclerotic risk, the other for hypoperfusion risk; both risk profiles were associated with elevated risk of incident dementia and AD. However, findings from the Uppsala Longitudinal Study of Adult Men found a graded association between number of vascular risk factors and all-cause dementia, mixed AD/VaD, and VaD, but no association with AD alone [3]. Thus, although the data are not entirely consistent, the preponderance of evidence suggests that higher aggregate levels of vascular risk raise the risk of clinically diagnosed incident AD.
Table 6.
Aggregate vascular risk for incident dementia
| Grade | Study | Age (years) | Mean follow-up (years) | Definition | Number of risk factors | Aggregate risk (95% CI) | |||
|---|---|---|---|---|---|---|---|---|---|
| All dementia | VaD | AD + VaD | AD | ||||||
| B1 | Kalmijn et al. 2000 [36]; HAAS | 52.7 ± 4.7 | 27 | Random postload glucose, SBP, DBP, BMI, subscapular skinfold thickness, total cholesterol, and triglycerides | Per 1-unit increase in z-score | 1.06 (1.02, 1.10)a | 1.11 (1.05, 1.18)a | 1.06 (0.97, 1.15)a | 1.0 (0.94, 1.06)a |
| 1.04 (1.00, 1.08)b | 1.09 (1.01, 1.15)b | 1.04 (0.96, 1.14)b | 1.00 (0.94, 1.05)b | ||||||
| 1.05 (1.01, 1.09)c | 1.10 (1.04, 1.17)c | 1.03 (0.94, 1.13)c | 1.00 (0.95, 1.06)c | ||||||
| 1.03 (0.99, 1.07)d | 1.08 (1.01, 1.15)d | 1.03 (0.94, 1.13)d | 0.99 (0.94, 1.06)d | ||||||
| B1 | Luchsinger et al. 2005 [24]; WHICAP | 76.2 ± 5.9 | 5.5 | Self-report history of diabetes, or hypertension, or heart disease, or current smoking | 1 | 1.7 (1.1, 2.6)e | |||
| 2 | 2.5 (1.6, 3.9)e | ||||||||
| ≥3 | 3.4 (2.1, 5.7)e | ||||||||
| B1 | Qiu et al. 2010 [2]; Kungsholmen | 81.5 ± 5.0 | 5.1 | Vascular risk profile: SBP ≥160, DBP <70, pulse pressure <70, diabetes, stroke, heart failure | 1 | 1.11 (0.79, 1.58)f | 1.09 (0.75, 1.60)f | ||
| 2 | 1.65 (1.12, 2.42)f | 1.77 (1.16, 2.71)f | |||||||
| ≥3 | 2.48 (1.46, 4.20)f | 2.66 (1.39, 5.08)f | |||||||
| Atherosclerosis risk profile: SBP ≥160, diabetes, stroke | 1 | 1.28 (1.00, 1.64)f | 1.33 (1.00, 1.78)f | ||||||
| ≥2 | 2.13 (1.46, 3.11)f | 2.09 (1.31, 3.34)f | |||||||
| Hypoperfusion risk profile: DBP <70, pulse pressure <70, heart failure | 1 | 1.15 (0.90, 1.47)f | 1.27 (0.96, 1.69)f | ||||||
| ≥2 | 1.88 (1.30, 2.70)f | 2.06 (1.31, 3.34)f | |||||||
| B2 | Ronnemaa et al. 2011 [3]; Uppsala | 49.6 ± 0.6 | 29 | SBP >140 mmHg, BMI >28, fasting glucose >7 mmol/L, cholesterol >7mmol/L, current smoking | 1 | 1.4 (1.0, 1.9)g | 2.1 (0.9, 4.6)g | 1.3 (0.9, 1.9)g | 0.9 (0.6, 1.5)g |
| 2 | 1.7 (1.2, 2.3)g | 2.8 (1.3, 6.2)g | 1.5 (1.0, 2.2)g | 1.2 (0.8, 2.0)g | |||||
| ≥3 | 2.1 (1.5, 3.2)g | 5.1 (2.2, 11.9)g | 1.4 (0.9, 1.4)g | 0.5 (0.2, 1.2)g | |||||
| 71.0 ± 0.6 | 13 | SBP >140 mmHg, BMI >28, fasting glucose >7mmol/L, cholesterol >7mmol/L, current smoking | 1 | 1.8 (1.2, 2.6)g | 4.1 (1.0, 17.7)g | 1.6 (1.1, 2.5)g | 1.3 (0.8, 2.3)g | ||
| 2 | 1.7 (1.1, 2.6)g | 6.8 (1.6, 29.2)g | 1.4 (0.9, 2.2)g | 1.0 (0.6, 1.9)g | |||||
| ≥3 | 1.7 (1.0, 2.9)g | 7.7 (1.6, 37.1)g | 1.1 (0.5, 2.1)g | 0.4 (0.1, 1.3)g | |||||
aAdjusted for age and education. bAdjusted for age, education, and history of stroke. cAdjusted for age, education, and coronary heart disease. dAdjusted for age, education, and adult brachial index. eAdjusted for age, gender, education, APOE ε4 status, and ethnicity. fAdjusted for age, gender, education, APOE ε4 status, follow-up survival status, baseline Mini-Mental State Examination, body mass index, coronary heart disease, and use of blood pressure lowering drugs and, if applicable, for atherosclerosis profile and hypoperfusion profile. gAdjusted for age and education. AD, Alzheimer's disease; BMI, body mass index; DBP, diastolic blood pressure; HAAS, Honolulu Asia Aging Study; SBP, systolic blood pressure; VaD, vascular dementia; WHICAP, Washington Heights-Inwood Columbia Aging Project.
In summary, diabetes, hypertension, and hyperlipidemia in midlife, as well as aggregate risk factors for atherosclerosis, are associated with increased risk for incident dementia; first for VaD, but also for AD + VaD, and to a lesser extent for AD alone. When relative risk was reported by subgroup, the strength of association diminished in the following order: VaD > AD + VaD > AD (five of five studies for diabetes mellitus; four of four studies for HTN; one study for high cholesterol and one study of aggregate risk). The trends across dementia subgroups is consistent with the hypothesis that vascular risk factors increase atherosclerosis, which promotes subclinical vascular brain injury that exerts an additive effect with AD pathology to symptomatically unmask dementia. These data cannot prove or disprove the alternative hypothesis that vascular risk factors or atherosclerosis increase AD pathology. The advent of biochemical markers for AD (for example, amyloid imaging and cerebrospinal fluid Aβ and phospho-tau) may allow this question to be revisited in the future with improved specificity for the diagnosis of AD in clinical settings.
Level C evidence
Several sources of selection bias may occur in convenience autopsy samples, including why the patient presented to medical attention, reasons for providing autopsy consent, and criteria for including the autopsy cases for study. In general, limited information regarding vascular risk factors is available on autopsy samples, and the focus of these studies is on cross-sectional pathology measures of atherosclerosis and AD (Table 7). The methods of assessing atherosclerosis severity vary widely among studies, including gross visual inspection of the Circle of Willis [41], cross-sectional measurements of arterial lumen narrowing [42], and microscopic evaluation of major branches of the Circle of Willis [20].
Table 7.
Cross-sectional autopsy studies examining stroke risk factors and Alzheimer's disease pathology
| N (mean age at death ± SD) | |||||
|---|---|---|---|---|---|
| Grade | Study | Clinical AD | Control | Association | Conclusions |
| C2 | Heitner et al. 1997 [47]; USA | 49 DM, 52 non-DM | Negative | No differences between diabetic and age-matched non-diabetic cases in severity of AD pathology | |
| C2 | Itoh et al. 1999 [45]; Japan | 48 (84.7 ± 7.3) | 99 (85.9 ± 7.9) | Negative | No association between cerebral atherosclerosis and density of NPs (r = -0.1, P = 0.23) |
| C2 | Roher et al. 2004 [42]; USA | 10 (87.9 ± 5.9) | 10 (86.7 ± 4.1) | Positive | Atherosclerosis score was correlated with NPs (r = 0.71, P-value not provided) and NFTs (r = 0.63, P-value not provided). |
| C2 | Honig et al. 2005 [44]; USA | 921 dementia (78.8 ± 8.8) | 133 non-dementia (82.9 ± 10.0) | Positive | Severe atherosclerosis was associated with NPs (OR = 5.7, 95% CI 1.3 to 25.5) after adjustment for age, sex, and cerebral infarct, not Braak stage |
| C2 | Beeri et al. 2006 [43]; USA | 57 definite (88.9 ± 7.2); 12 probable (87.6 ± 9.3); 12 possible (85.4 ± 10.6) |
18 (85.7 ± 10.6) | Positive | Coronary artery disease was significantly associated with all NPs and NFTs in the hippocampus (r ranging from 0.22 to 0.29), especially for APOE ε4 allele carriers (r = 0.34 to 0.47). Aortic atherosclerosis was not associated with either NPs or NFTs |
| C2 | Beach et al. 2007 [41]; USA | 215 (82.6 ± 8.2) | 92 (84.3 ± 6.8) | Positive | Severe atherosclerosis was associated with higher risk of AD (OR 1.31, 95% CI 1.04 to 1.69) after adjustment for age, gender, and APOE ε4 |
| C2 | Aho et al. 2006 [50]; Finland | - | 541 (484 with CVL, 68 ± 1; 57 without CVL, 71 ± 2) | Negative | No association between atherosclerosis and frequency of Aβ positivity after adjustment for age and Braak stage (no details provided) |
| C2 | Luoto et al. 2009 [46]; Finland | - | 466 (70.8 ± 11.5) | Negative | Neither NPs (r = 0.19, P = 0.70) nor NFTs (r = 0.18, P = 0.36) were associated with cerebral atherosclerosis after adjustment for age |
Aβ, amyloid-beta; AD, Alzheimer's disease; CI, confidence interval; CVL, cerebrovascular lesion; DM, diabetes mellitus; NFT, neurofibrillary tangle; NP, neuritic plaque; OR, odds ratio; SD, standard deviation.
Three groups of investigators have reported associations between atherosclerosis and AD pathology (either NPs or NFTs) among cases drawn from AD brain banks. In a study from Sun Health Research Institute, which focuses on cognitive impairment in late life, Roher and colleagues [42] first called attention to correlations between atherosclerosis in the Circle of Willis and tangle and plaque scores in a sample composed of ten AD and ten normal controls. In this small sample, the correlations between atherosclerosis and AD pathology appear to be driven by the absence of either type of pathology in the normal controls. In a larger and more heterogeneous sample from the same center (n = 397) [41], atherosclerosis was significantly greater in VaD (n = 30) and AD (n = 215), compared to non-AD (n = 60) and normal controls (n = 92). In a logistic regression analysis, adjusted for age, gender and APOE ε4 genotype, the odds ratios for increasing severity of AD pathology per unit increase in atherosclerosis were significantly elevated: NP score >1 (OR = 1.30, 95% CI 1.07 to 1.57); Braak Stage >4 (OR = 1.27, 95% CI 1.06 to 1.52). In a study of 99 cases drawn from the Mount Sinai Dementia Brain Bank [43] (81 AD and 18 controls), atherosclerosis in coronary arteries and the aorta were correlated with NP and NFT scores, particularly among APOE ε4 carriers. In a large convenience autopsy sample from the National Alzheimer's Coordinating Center, severity of atherosclerosis was associated with frequency of NP, but not Braak and Braak Stage, among 921 AD and 133 neuropathologically normal controls [44].
On the other hand, other autopsy studies drawn from non-dementia settings have not shown positive associations between atherosclerosis and AD pathology. From cases autopsied at a Geriatric Hospital in Japan, Itoh and colleagues [45] noted lower atherosclerosis scores in AD (n = 48) than non-AD patients (n = 99) (P < 0.05). No significant associations were noted between severities of atherosclerosis in the aorta, coronary, or cerebral arteries and hippocampal plaques or tangles. In a study of medico-legal (coroner) cases over age 50 years (n = 466) unselected for either atherosclerosis or AD [46], amyloid plaque percentage area in the frontal lobe was associated with age (P < 0.0001) and APOE ε4 allele (P < 0.0001), but not with atherosclerosis in the Circle of Willis. Similarly, hippocampal tangle counts were associated with age, but not cerebral atherosclerosis score. In a study focused on patients with stroke, Aβ load, Aβ40, and Aβ42 aggregates in the cortex and thalamus increased with age, but not with atherosclerosis in the Circle of Willis. Finally, in a retrospective autopsy study, no differences in severity of AD pathology were found among 49 cases with diabetes compared to 52 age-matched normal controls [47].
Thus, in autopsy studies drawn from convenience samples, the relationship between atherosclerosis and AD pathology differs depending on the settings from which the sample is drawn. Associations between intracranial atherosclerosis and severity of plaques and sometimes tangles are reported from AD brain banks, but not from stroke banks, or from cases unselected for atherosclerosis or AD. These level C findings are inconclusive, due to sample selection, relative crudeness of the pathology measures, and to a variable sample size.
Conclusion
A few representative, prospective studies with autopsy (evidence level A) fail to show a positive association between vascular risk factors and AD pathology. Not surprisingly, vascular risk factors increased the likelihood of cerebral infarcts. No associations have been demonstrated between diabetes and AD pathology or between intracranial atherosclerosis and AD pathology. Some prospective, representative, epidemiologic studies (evidence level B) show associations between diabetes, hypertension, hyperlipidemia, and aggregate vascular risk factors and incident AD; these studies have attracted considerable attention in the literature. However, when relative risk has been reported by subgroup, the strength of association diminished in the following order: VaD > AD + VaD > AD. The declining trends across dementia subgroups is more consistent with the hypothesis that atherosclerosis promotes subclinical vascular brain injury that increases the likelihood of dementia. Convenience autopsy studies from AD brain banks (evidence level C) report positive associations between intracranial atherosclerosis and severity of plaques and sometimes tangles. However, these associations are not confirmed when samples are drawn from other non-dementia brain bank settings. We conclude that, at the present time, there is no level A or B evidence that the vascular risk factors reviewed here increase AD pathology.
Abbreviations
Aβ: amyloid-beta; AD: Alzheimer's disease; APOE: apolipoprotein E; CI: confidence interval; HAAS: Honolulu Asia Aging Study; NFT: neurofibrillary tangle; NP: neuritic plaque; OR: odds ratio; ROS: Religious Orders Study; RR: relative risk; VaD: vascular dementia; WHICAP: Washington Heights-Inwood Columbia Aging Project.
Competing interests
The authors declare that they have no competing interests.
Contributor Information
Helena C Chui, Email: chui@usc.edu.
Ling Zheng, Email: lzheng@usc.edu.
Bruce R Reed, Email: brreed@ucdavis.edu.
Harry V Vinters, Email: hvinters@mednet.ucla.edu.
Wendy J Mack, Email: wmack@usc.edu.
Acknowledgements
This work was supported by the National Institute on Aging 1P01AG12435, 1P50AG05142.
References
- Reitz C, Tang MX, Schupf N, Manly JJ, Mayeux R, Luchsinger JA. A summary risk score for the prediction of Alzheimer disease in elderly persons. Arch Neurol. 2010;67:835–841. doi: 10.1001/archneurol.2010.136. [DOI] [PMC free article] [PubMed] [Google Scholar]
- Qiu C, Xu W, Winblad B, Fratiglioni L. Vascular risk profiles for dementia and Alzheimer's disease in very old people: a population-based longitudinal study. J Alzheimer's Dis. 2010;20:293–300. doi: 10.3233/JAD-2010-1361. [DOI] [PubMed] [Google Scholar]
- Rönnemaa E, Zethelius B, Lannfelt L, Kilander L. Vascular risk factors and dementia: 40-year follow-up of a population-based cohort. Dement Geriatr Cogn Disord. 2011;31:460–466. doi: 10.1159/000330020. [DOI] [PubMed] [Google Scholar]
- Consensus recommendations for the postmortem diagnosis of Alzheimer's disease. The National Institute on Aging, and Reagan Institute Working Group on Diagnostic Criteria for the Neuropathological Assessment of Alzheimer's Disease. Neurobiol Aging. 1997;18(4 Suppl):S1–2. [PubMed] [Google Scholar]
- McKhann G, Drachman D, Folstein M, Katzman R, Price D, Stadlan EM. Clinical diagnosis of Alzheimer's disease: report of the NINCDS-ADRDA Work Group under the auspices of Department of Health and Human Services Task Force on Alzheimer's Disease. Neurology. 1984;34:939–944. doi: 10.1212/wnl.34.7.939. [DOI] [PubMed] [Google Scholar]
- Mayeux R, Saunders AM, Shea S, Mirra S, Evans D, Roses AD, Hyman BT, Crain B, Tang MX, Phelps CH. Utility of the apolipoprotein E genotype in the diagnosis of Alzheimer's disease. Alzheimer's Disease Centers Consortium on Apolipoprotein E and Alzheimer's Disease. N Engl J Med. 1998;338:506–511. doi: 10.1056/NEJM199802193380804. [DOI] [PubMed] [Google Scholar]
- Chui HC. In: Evidence-Based Dementia: A Practical Guide to Diagnosis and Management. Qizilbash N, Schneider L, Chui H, Tariot P, Brodaty H, Kaye J, Erkinjuntti T, editor. Oxford: Blackwell Science; 2002. Evidence-based Diagnosis of Dementia. [Google Scholar]
- White L, Petrovitch H, Hardman J, Nelson J, Davis DG, Ross GW, Masaki K, Launer L, Markesbery WR. Cerebrovascular pathology and dementia in autopsied Honolulu-Asia Aging Study participants. Ann N Y Acad Sci. 2002;977:9–23. doi: 10.1111/j.1749-6632.2002.tb04794.x. [DOI] [PubMed] [Google Scholar]
- Schneider JA, Arvanitakis Z, Bang W, Bennett DA. Mixed brain pathologies account for most dementia cases in community-dwelling older persons. Neurology. 2007;69:2197–2204. doi: 10.1212/01.wnl.0000271090.28148.24. [DOI] [PubMed] [Google Scholar]
- Pathological correlates of late-onset dementia in a multicentre, community-based population in England and Wales. Neuropathology Group of the Medical Research Council Cognitive Function and Ageing Study (MRC CFAS) Lancet. 2001;357:169–175. doi: 10.1016/s0140-6736(00)03589-3. [DOI] [PubMed] [Google Scholar]
- Yoshitake T, Kiyohara Y, Kato I, Ohmura T, Iwamoto H, Nakayama K, Ohmori S, Nomiyama K, Kawano H, Ueda K. et al. Incidence and risk factors of vascular dementia and Alzheimer's disease in a defined elderly Japanese population: the Hisayama Study. Neurology. 1995;45:1161–1168. doi: 10.1212/wnl.45.6.1161. [DOI] [PubMed] [Google Scholar]
- McKhann GM, Knopman DS, Chertkow H, Hyman BT, Jack CR Jr, Kawas CH, Klunk WE, Koroshetz WJ, Manly JJ, Mayeux R. et al. The diagnosis of dementia due to Alzheimer's disease: Recommendations from the National Institute on Aging-Alzheimer's Association workgroups on diagnostic guidelines for Alzheimer's disease. Alzheimers Dement. 2011;7:263–269. doi: 10.1016/j.jalz.2011.03.005. [DOI] [PMC free article] [PubMed] [Google Scholar]
- Schneider JA, Aggarwal NT, Barnes L, Boyle P, Bennett DA. The neuropathology of older persons with and without dementia from community versus clinic cohorts. J Alzheimers Dis. 2009;18:691–701. doi: 10.3233/JAD-2009-1227. [DOI] [PMC free article] [PubMed] [Google Scholar]
- Zaccai J, Ince P, Brayne C. Population-based neuropathological studies of dementia: design, methods and areas of investigation - a systematic review. BMC Neurol. 2006;6:2. doi: 10.1186/1471-2377-6-2. [DOI] [PMC free article] [PubMed] [Google Scholar]
- Peila R, Rodriguez BL, Launer LJ. Type 2 diabetes, APOE gene, and the risk for dementia and related pathologies: The Honolulu-Asia Aging Study. Diabetes. 2002;51:1256–1262. doi: 10.2337/diabetes.51.4.1256. [DOI] [PubMed] [Google Scholar]
- Ahtiluoto S, Polvikoski T, Peltonen M, Solomon A, Tuomilehto J, Winblad B, Sulkava R, Kivipelto M. Diabetes, Alzheimer disease, and vascular dementia. A population-based neuropathologic study. Neurology. 2010;75:1195–1202. doi: 10.1212/WNL.0b013e3181f4d7f8. [DOI] [PubMed] [Google Scholar]
- Arvanitakis Z, Wilson RS, Bienias JL, Evans DA, Bennett DA. Diabetes mellitus and risk of Alzheimer disease and decline in cognitive function. Arch Neurol. 2004;61:661–666. doi: 10.1001/archneur.61.5.661. [DOI] [PubMed] [Google Scholar]
- Arvanitakis Z, Schneider JA, Wilson RS, Li Y, Arnold SE, Wang Z, Bennett DA. Diabetes is related to cerebral infarction but not to AD pathology in older persons. Neurology. 2006;67:1960–1965. doi: 10.1212/01.wnl.0000247053.45483.4e. [DOI] [PubMed] [Google Scholar]
- Wang LY, Larson EB, Sonnen JA, Shofer JB, McCormick W, Bowen JD, Montine TJ, Li G. Blood pressure and brain injury in older adults: findings from a community-based autopsy study. J Am Geriatr Soc. 2009;57:1975–1981. doi: 10.1111/j.1532-5415.2009.02493.x. [DOI] [PMC free article] [PubMed] [Google Scholar]
- Dolan H, Crain B, Troncoso J, Resnick SM, Zonderman AB, Obrien RJ. Atherosclerosis, dementia, and Alzheimer disease in the Baltimore Longitudinal Study of Aging cohort. Ann Neurol. 2010;68:231–240. doi: 10.1002/ana.22055. [DOI] [PMC free article] [PubMed] [Google Scholar]
- Lopez OL, Kuller LH, Becker JT, Jagust WJ, DeKosky ST, Fitzpatrick A, Breitner J, Lyketsos C, Kawas C, Carlson M. Classification of vascular dementia in the Cardiovascular Health Study Cognition Study. Neurology. 2005;64:1539–1547. doi: 10.1212/01.WNL.0000159860.19413.C4. [DOI] [PubMed] [Google Scholar]
- Cukierman T, Gerstein HC, Williamson JD. Cognitive decline and dementia in diabetes - systematic overview of prospective observational studies. Diabetologia. 2005;48:2460–2469. doi: 10.1007/s00125-005-0023-4. [DOI] [PubMed] [Google Scholar]
- Ott A, Stolk RP, van Harskamp F, Pols HA, Hofman A, Breteler MM. Diabetes mellitus and the risk of dementia: The Rotterdam Study. Neurology. 1999;53:1937–1942. doi: 10.1212/wnl.53.9.1937. [DOI] [PubMed] [Google Scholar]
- Luchsinger JA, Reitz C, Honig LS, Tang MX, Shea S, Mayeux R. Aggregation of vascular risk factors and risk of incident Alzheimer disease. Neurology. 2005;65:545–551. doi: 10.1212/01.wnl.0000172914.08967.dc. [DOI] [PMC free article] [PubMed] [Google Scholar]
- Cheng D, Noble J, Tang MX, Schupf N, Mayeux R, Luchsinger JA. Type 2 diabetes and late-onset Alzheimer's disease. Dement Geriatr Cogn Disord. 2011;31:424–430. doi: 10.1159/000324134. [DOI] [PMC free article] [PubMed] [Google Scholar]
- MacKnight C, Rockwood K, Awalt E, McDowell I. Diabetes mellitus and the risk of dementia, Alzheimer's disease and vascular cognitive impairment in the Canadian Study of Health and Aging. Dement Geriatr Cogn Disord. 2002;14:77–83. doi: 10.1159/000064928. [DOI] [PubMed] [Google Scholar]
- Launer LJ, Ross GW, Petrovitch H, Masaki K, Foley D, White LR, Havlik RJ. Midlife blood pressure and dementia: the Honolulu-Asia aging study. Neurobiol Aging. 2000;21:49–55. doi: 10.1016/s0197-4580(00)00096-8. [DOI] [PubMed] [Google Scholar]
- Shah RC, Wilson RS, Bienias JL, Arvanitakis Z, Evans DA, Bennett DA. Relation of blood pressure to risk of incident Alzheimer's disease and change in global cognitive function in older persons. Neuroepidemiology. 2006;26:30–36. doi: 10.1159/000089235. [DOI] [PubMed] [Google Scholar]
- Elias PK, Elias MF, D'Agostino RB, Cupples LA, Wilson PW, Silbershatz H, Wolf PA. NIDDM and blood pressure as risk factors for poor cognitive performance. The Framingham Study. Diabetes Care. 1997;20:1388–1395. doi: 10.2337/diacare.20.9.1388. [DOI] [PubMed] [Google Scholar]
- Peila R, White LR, Petrovich H, Masaki K, Ross GW, Havlik RJ, Launer LJ. Joint effect of the APOE gene and midlife systolic blood pressure on late-life cognitive impairment: the Honolulu-Asia aging study. Stroke. 2001;32:2882–2889. doi: 10.1161/hs1201.100392. [DOI] [PubMed] [Google Scholar]
- Slooter AJ, Cruts M, Kalmijn S, Hofman A, Breteler MM, Van Broeckhoven C, van Duijn CM. Risk estimates of dementia by apolipoprotein E genotypes from a population-based incidence study: the Rotterdam Study. Arch Neurol. 1998;55:964–968. doi: 10.1001/archneur.55.7.964. [DOI] [PubMed] [Google Scholar]
- Wilson PW, Myers RH, Larson MG, Ordovas JM, Wolf PA, Schaefer EJ. Apolipoprotein E alleles, dyslipidemia, and coronary heart disease. The Framingham Offspring Study. JAMA. 1994;272:1666–1671. doi: 10.1001/jama.1994.03520210050031. [DOI] [PubMed] [Google Scholar]
- Notkola IL, Sulkava R, Pekkanen J, Erkinjuntti T, Ehnholm C, Kivinen P, Tuomilehto J, Nissinen A. Serum total cholesterol, apolipoprotein E epsilon 4 allele, and Alzheimer's disease. Neuroepidemiology. 1998;17:14–20. doi: 10.1159/000026149. [DOI] [PubMed] [Google Scholar]
- Tan ZS, Seshadri S, Beiser A, Wilson PW, Kiel DP, Tocco M, D'Agostino RB, Wolf PA. Plasma total cholesterol level as a risk factor for Alzheimer disease: the Framingham Study. Arch Intern Med. 2003;163:1053–1057. doi: 10.1001/archinte.163.9.1053. [DOI] [PubMed] [Google Scholar]
- Kivipelto M, Helkala EL, Laakso MP, Hänninen T, Hallikainen M, Alhainen K, Iivonen S, Mannermaa A, Tuomilehto J, Nissinen A, Soininen H. Apolipoprotein E epsilon4 allele, elevated midlife total cholesterol level, and high midlife systolic blood pressure are independent risk factors for late-life Alzheimer disease. Ann Intern Med. 2002;137:149–155. doi: 10.7326/0003-4819-137-3-200208060-00006. [DOI] [PubMed] [Google Scholar]
- Kalmijn S, Foley D, White L, Burchfiel CM, Curb JD, Petrovitch H, Ross GW, Havlik RJ, Launer LJ. Metabolic cardiovascular syndrome and risk of dementia in Japanese-American elderly men. The Honolulu-Asia aging study. Arterioscler Thromb Vasc Biol. 2000;20:2255–2260. doi: 10.1161/01.ATV.20.10.2255. [DOI] [PubMed] [Google Scholar]
- Li G, Shofer JB, Kukull WA, Peskind ER, Tsuang DW, Breitner JC, McCormick W, Bowen JD, Teri L, Schellenberg GD, Larson EB. Serum cholesterol and risk of Alzheimer disease: a community-based cohort study. Neurology. 2005;65:1045–1050. doi: 10.1212/01.wnl.0000178989.87072.11. [DOI] [PubMed] [Google Scholar]
- Reitz C, Tang MX, Luchsinger J, Mayeux R. Relation of plasma lipids to Alzheimer disease and vascular dementia. Arch Neurol. 2004;61:705–714. doi: 10.1001/archneur.61.5.705. [DOI] [PMC free article] [PubMed] [Google Scholar]
- Reitz C, Tang MX, Schupf N, Manly JJ, Mayeux R, Luchsinger JA. Association of higher levels of high-density lipoprotein cholesterol in elderly individuals and lower risk of late-onset Alzheimer disease. Arch Neurol. 2010;67:1491–1497. doi: 10.1001/archneurol.2010.297. [DOI] [PMC free article] [PubMed] [Google Scholar]
- Mielke MM, Zandi PP, Sjogren M, Gustafson D, Ostling S, Steen B, Skoog I. High total cholesterol levels in late life associated with a reduced risk of dementia. Neurology. 2005;64:1689–1695. doi: 10.1212/01.WNL.0000161870.78572.A5. [DOI] [PubMed] [Google Scholar]
- Beach TG, Wilson JR, Sue LI, Newell A, Poston M, Cisneros R, Pandya Y, Esh C, Connor DJ, Sabbagh M, Walker DG, Roher AE. Circle of Willis atherosclerosis: association with Alzheimer's disease, neuritic plaques and neurofibrillary tangles. Acta Neuropathol. 2007;113:13–21. doi: 10.1007/s00401-006-0136-y. [DOI] [PubMed] [Google Scholar]
- Roher AE, Esh C, Rahman A, Kokjohn TA, Beach TG. Atherosclerosis of cerebral arteries in Alzheimer disease. Stroke. 2004;35(11 Suppl 1):2623–2627. doi: 10.1161/01.STR.0000143317.70478.b3. [DOI] [PubMed] [Google Scholar]
- Beeri MS, Rapp M, Silverman JM, Schmeidler J, Grossman HT, Fallon JT, Purohit DP, Perl DP, Siddiqui A, Lesser G, Rosendorff C, Haroutunian V. Coronary artery disease is associated with Alzheimer disease neuropathology in APOE4 carriers. Neurology. 2006;66:1399–1404. doi: 10.1212/01.wnl.0000210447.19748.0b. [DOI] [PMC free article] [PubMed] [Google Scholar]
- Honig LS, Kukull W, Mayeux R. Atherosclerosis and AD: analysis of data from the US National Alzheimer's Coordinating Center. Neurology. 2005;64:494–500. doi: 10.1212/01.WNL.0000150886.50187.30. [DOI] [PubMed] [Google Scholar]
- Itoh Y, Yamada M, Sodeyama N, Suematsu N, Matsushita M, Otomo E, Mizusawa H. Atherosclerosis is not implicated in association of APOE epsilon4 with AD. Neurology. 1999;53:236–237. doi: 10.1212/wnl.53.1.236. [DOI] [PubMed] [Google Scholar]
- Luoto TM, Haikonen S, Haapasalo H, Goebeler S, Huhtala H, Erkinjuntti T, Karhunen PJ. Large vessel cerebral atherosclerosis is not in direct association with neuropathological lesions of Alzheimer's disease. Eur Neurol. 2009;62:93–98. doi: 10.1159/000222779. [DOI] [PubMed] [Google Scholar]
- Heitner J, Dickson D. Diabetics do not have increased Alzheimer-type pathology compared with age-matched control subjects. A retrospective postmortem immunocytochemical and histofluorescent study. Neurology. 1997;49:1306–1311. doi: 10.1212/wnl.49.5.1306. [DOI] [PubMed] [Google Scholar]
- Kawas C, Gray S, Brookmeyer R, Fozard J, Zonderman A. Age-specific incidence rates of Alzheimer's disease: the Baltimore Longitudinal Study of Aging. Neurology. 2000;54:2072–2077. doi: 10.1212/wnl.54.11.2072. [DOI] [PubMed] [Google Scholar]
- Luchsinger JA, Tang MX, Stern Y, Shea S, Mayeux R. Diabetes mellitus and risk of Alzheimer's disease and dementia with stroke in a multiethnic cohort. Am J Epidemiol. 2001;154:635–641. doi: 10.1093/aje/154.7.635. [DOI] [PubMed] [Google Scholar]
- Aho L, Jolkkonen J, Alafuzoff I. Beta-amyloid aggregation in human brains with cerebrovascular lesions. Stroke. 2006;37:2940–2945. doi: 10.1161/01.STR.0000248777.44128.93. [DOI] [PubMed] [Google Scholar]