

Abstract
Ras is a central regulator of cellular signaling pathways. It is mutated in 20–30% of human tumors. To perform its function, Ras has to be bound to a membrane by a posttranslationally attached lipid anchor. Surprisingly, we identified here dimerization of membrane anchored Ras by combining attenuated total reflectance Fourier transform infrared spectroscopy, biomolecular simulations, and Förster resonance energy transfer experiments. By analyzing x-ray structural models and molecular-dynamics simulations, we propose a dimerization interface between α-helices 4 and 5 and the loop between β2 and β3. This seems to explain why the residues D47, E49, R135, R161, and R164 of this interface are influencing Ras signaling in cellular physiological experiments, although they are not positioned in the catalytic site. Dimerization could catalyze nanoclustering, which is well accepted for membrane-bound Ras. The interface could provide a new target for a seemingly novel type of small molecule interfering with signal transduction in oncogenic Ras mutants.
Introduction
More than 150 different small GTPases regulate a great variety of cellular processes (1). They all share a common G domain that usually exists in a signaling (GTP-bound) state or an inactive (GDP-bound) state. Small GTPases are switched on by exchanging GDP for GTP, a process catalyzed by guanine nucleotide exchange factors, and are switched off by GTP hydrolysis, which is catalyzed by GTPase-activating proteins. The molecular reaction mechanism of small GTPases, especially Ras, has been analyzed in detail using a large variety of experimental techniques such as x-ray structure analysis (reviewed recently in Wittinghofer and Vetter (2)), NMR (3), Fourier transform infrared (FTIR) spectroscopy (reviewed recently in Kötting et al. (4)), and other biophysical techniques (5,6). To complement these studies, the molecular reaction mechanism has also been theoretically studied using biomolecular simulations (7–9). These provide significant insight into the switch mechanism and its catalysis by effector proteins.
However, for GTPases to perform their functional roles within the living cell, membrane targeting plays an additional and important role. Most small GTPases are membrane-anchored. In the case of Ras, the various attached lipid anchors at the C-terminus of different isoforms (H-, N-, and K-Ras) lead to specific compartmentalization of the molecule, and the dynamics of this compartmentalization is influenced by enzymes that reverse the anchorage by cleaving certain lipid moieties (10). The availability of lipidated Ras proteins (11–13) has triggered many studies of Ras-membrane interactions. It has been shown that the structure of the G domain and its molecular switch mechanism is conserved even when Ras is membrane-bound (4,14). N-Ras containing one farnesyl and one palmitoyl group is shown to cluster at the boundary of lipid rafts (15), and pressure-driven conformational substate selection was found to be influenced by the membrane (16).
Additionally, molecular-mechanics (MM) simulations of an N-Ras peptide (17), H-Ras (18), and K-Ras (19) were performed. The H-Ras and K-Ras simulations show possible orientation changes of the G domain between the GDP- and GTP-bound states, which might be relevant to the activation of signaling pathways. This movement results in different membrane interactions of the amino acids R128, R135, R169, and K170 in H-Ras. These residues are therefore believed to be functionally important for the activation mechanism. In vivo experiments confirm that mutations at these residues affect signal transduction (19,20).
In this study, we have extended our attenuated total reflectance Fourier transform infrared (ATR-FTIR) experiments on membrane-anchored Ras. We analyzed the orientation of a lipidated Ras molecule bound to a single membrane bilayer using polarized light with a novel experimental setup (4). This setup allows simultaneous Förster resonance energy transfer (FRET) measurements in addition to the infrared measurements. Furthermore, FRET provides spatial resolution because it enables distance measurements between neighboring Ras proteins. The study is complemented by the analyses of the orientation of membrane-anchored Ras during MM simulations. All three applied techniques are in full agreement and indicate that Ras is bound to the lipid bilayer as a dimer or oligomer, in an orientation perpendicular to the membrane, in contrast to an earlier proposal (18). Mutations in the amino acids D47, E49, R135, R161, and R164 that affect signaling seem to influence Ras dimerization, but not the interaction of Ras with the membrane. This is an alternative explanation for previous in vivo experimental observations (19,20). Interestingly, membrane-driven dimerization of Ras was proposed more than a decade ago (21). Dimerization could catalyze nanoclustering, which is well accepted for membrane-bound Ras. These nanoclusters enable strong signal bursts that lead to high-fidelity signal transmission (22).
Materials and Methods
Materials
We purchased 1-palmitoyl-2-oleoyl-sn-glycero-3-phosphocholine (POPC; Lipoid, Ludwigshafen, Germany). Lipid solutions were prepared to a concentration of 32 mM in chloroform. Lipid vesicle solutions were prepared in buffer (10 mM Tris/HCl, pH 7.4, 5 mM MgCl2). A 9.5 g/L protein stock solution was used for the injection of N-Ras protein into the binding buffer solution (20 mM Tris/HCl, pH 7.4, 5 mM MgCl2, 1 mM DTT, 0.1 mM GDP) that bathed the adsorbed POPC model membrane. The nucleotide exchange was performed in buffer E (50 mM 2-(n-morpholino)ethanesulfonic acid, 100 mM NaCl, 1 mM Tris(2-carboxyethyl)phosphine, pH 6.5). The semisynthetic N-Ras protein used in these experiments was prepared as described elsewhere (11,13,14,23).
The FRET donor used in our experiments was 2′-/3′-O-(n′-methylanthraniloyl)-guanosine-5′-O-diphosphate (Mant-GDP), and 2′/3′-O-Trinitrophenyl-guanosine-5′-O-diphosphate (TNP-GDP) was used as the FRET-acceptor (both by Jena Bioscience, Jena, Germany) (24).
Preparation of ATR crystals
Before each measurement, both sides of the germanium internal reflection element (IRE) were polished for ∼10 min by machine (Logitech CP50; Logitech, Old Kilpatrick, Scotland) with a diamond-polishing suspension (0.1 μm, Logitech) on a hard cloth (Microtex 500 HC-W; Logitech) that rotated at 40 rpm. After rinsing the IRE with Milli-Q water (Millipore, Billerica, MA), the hydrophilic character of the IRE surfaces was attained by dipping the IRE for 10 min into a concentrated sulfuric acid solution, followed by rinsing, and then drying under a nitrogen gas flow. To further enhance the hydrophilic character of the IRE and to remove small traces of organic compounds, we finally treated the IRE for 15 min with an air plasma (Harrick Scientific, Pleasantville, NY).
Bilayer preparation and protein immobilization
The solid-supported-lipid bilayer was prepared by spreading vesicles onto hydrophilic IRE surfaces. After solid-supported-lipid-bilayer preparation and the subsequent washing steps, the lipid-anchored N-Ras was added to the circulating flow-through system. This resulted in a slow immobilization of the protein. Both procedures have been described in detail previously (4,14).
ATR measurements and spectra analyses
ATR-FTIR measurements were performed with a Vertex 80V-spectrometer (Bruker Optik, Ettlingen, Germany) at 293 K, with a spectral resolution of 2 cm−1 and a scanner velocity of 80 kHz; scans were performed in the double-sided forward-backward mode. The resulting interferograms were apodized with the Blackman-Harris three-term function and with a zero filling factor of 4. The IRE was a 52 mm × 20 mm × 2 mm trapezoidal germanium ATR plate with an aperture angle of 45°. Only one side of the IRE was used, which resulted in 13 active reflections.
Nucleotide exchange
Before the nucleotide exchange, the binding buffer in the cuvette was replaced by the exchange buffer E, we took the following steps:
Step 1. The system was washed with buffer E supplemented with 5 mM MgCl2 and 0.1 mM GDP. After 10 min, the entire binding buffer in the cuvette was replaced, and a reference spectrum was recorded.
Step 2. The surface was incubated with buffer E supplemented with 1 mM EDTA + 0.1 mM of the desired nucleotides (Mant-GDP, TNP-GDP, or GDP) for 30 min. This lowered the nucleotide affinity of Ras, because Mg2+ was chelated by EDTA (25). Due to the excess of available nucleotides, the former bound nucleotides are exchanged for the desired nucleotides.
Step 3. The cuvette was flushed with buffer E supplemented with 5 mM MgCl2 and the used nucleotides for 6 min. This ensured strong binding of the nucleotides.
Step 4. The buffer was exchanged with the same buffer used for the reference spectra in Step 1, and time-correlated single-photon counting (TCSPC) measurements were performed in parallel to the ATR-FTIR measurements.
MM simulations
MM simulations were performed with GROMACS 4.0.7 (26,27) and the optimized-potentials-for-liquid-simulations all-atom force field (28). Quantum mechanics (QM) simulations were performed with Gaussian03 (29), and QM/MM simulations with the GROMACS/Gaussian interface (30) and the normal QM/MM scheme (31). The simulation system consisted of a full-length N-Ras protein attached to a POPC membrane in a triclinic box filled with TIP4P water and physiological sodium chloride concentration.
Further details about the theoretical methods can be found in the Supporting Material.
TCSPC measurements and analysis
Lifetime measurements were carried out by means of TCSPC. Data acquisition was established with a setup from PicoQuant (Berlin, Germany) consisting of a pulsed laser-diode, emitting at 375 nm (LDH-P-C-470B; pulse-width at full width at half-height <70 ps) driven by a PDL 800-D laser driver, a photomultiplier detector module (PMA 182-N-M) equipped with a filter-holder, and a Pico Harp 300 Photon-Counting System. To avoid pile-up effects, the excitation rate (10 kHz) and the applied laser intensity were coordinated such that the detected photon count rate did not exceed 1% of the excitation rate during the measurements. Photon events were stored in histogram bins of 32-ps width and the integration time for each histogram was 10 s. A fiber-bundle (Reflection Probe FCR-7-UV-400-2 Meter; Avantes, Apeldoorn, Netherlands) exhibiting 6+1 fibers, two FC/APC-terminations, and one probe-end was used. The sample was excited via the single-fiber-channel; photon detection was utilized by the six-fiber channel. The probe-end was fed through the side-plate of the spectrometer and fixed tightly above the sample surface, facing it at ∼45°. Thereby, sample excitement and fluorescence detection could be achieved simultaneously.
To avoid internal back-reflection artifacts, all three endings of the fiber-bundle were ground by 8°. A proper bandpass-filter (ET450/50m; AHF Analysetechnik, Tübingen, Germany) was used to ensure the detection of the donor fluorescence without disturbance from acceptor fluorescence, scattered light, or autofluorescence.
Because the quantum-yield of TNP is approximately three orders-of-magnitude lower than that of Mant, the FRET efficiency was obtained solely by detecting the lifetime of donor fluorescence in both the presence (τDA) and absence (τD) of the acceptor without any observations of the fluorescence lifetime of the acceptor.
Fluorescence measurements were performed for three different nucleotide-bound states of Ras that were produced by nucleotide exchange, described above. A reference-state G (GDP), a donor-state MxG (Mant-GDP and GDP), and a FRET-state MxT (Mant-GDP and TNP-GDP) were measured in buffer E supplemented with 5 mM MgCl2. Histograms (10 s integration time, 20 min recording time) of the respective sample states (reference, donor, and FRET) were averaged, yielding a single histogram for each state. Measurements were performed twice in sequence, resulting in the following experiment chronology:
In this way, two consecutive MxG and MxT measurements were preceded and followed by two G reference measurements. The G steps were linearly interpolated to approximate reference histograms at the time when MxG and MxT were measured.
Reference histograms were subtracted from the histograms of MxG and MxT to compensate for autofluorescence and scatter-light. Data were analyzed using FluoFit Pro software (PicoQuant). Reference-corrected histograms were iteratively reconvoluted, using an instrument response function (IRF), and fitted biexponentially using Eq. 1,
| (1) |
where t is the time [ns], Ai is the amplitude of the respective exponential term, and τi is the corresponding lifetime.
The IRF was obtained by TCSPC by illuminating a diluted Ludox solution (Ludox PX 30 Kieselsol; Deffner & Johann, Röthlein, Germany) at 10 MHz in an absolutely dark environment. IRF measurements were performed with similar laser driver settings and the same fiber as used in the remaining FRET experiments presented here, but without filters.
For all states, biexponential fitting yielded good agreement with the data. The two obtained lifetimes of ∼3 ns and 8 ns were averaged using amplitude weighting as determined by Eq. 2:
| (2) |
The FRET efficiency, E, was calculated using the amplitude-weighted lifetimes with (state MxT, τDA) and without (state MxG, τD) the acceptor, according to Eq. 3:
| (3) |
Measurements were performed twice in sequence and averaged. The differences of the efficiencies in between single measurements are <1.5%.
Determination of the Förster radius R0
The radius is given as
| (4) |
Here, κ2 is the orientation factor of the transition dipoles, Q0 is the quantum yield of donor fluorescence in the absence of FRET, J is the integral spectral overlap of the normalized donor emission and the molar acceptor absorption, and n is the refractive index of the medium between donor and acceptor, which was set to 1.4.
Q0 and J were derived experimentally whereas κ2 was obtained by MD simulations. Details are given in the Supporting Material.
Results and Discussion
Dichroitic-ATR FTIR experiments on lipidated Ras
Dichroitic ATR-FTIR spectroscopy is an excellent technique to determine the orientation of lipid-anchored Ras. A single POPC bilayer is immobilized at a germanium surface and subsequently N-Ras is bound via a semisynthetic anchor (4,14) (see Fig. S1 A in the Supporting Material). The monolayer of membrane-bound Ras proteins is stable for several days. To determine the orientation of lipid-bound Ras, we used polarized infrared light. The amide I mode of an α-helix (C=O) is almost parallel to the helix, whereas the amide II mode (NH) is almost perpendicular to the helix (32). Therefore, if an α-helix is oriented perpendicular to the membrane, parallel-polarized light interacts more strongly with the amide I mode than vertical polarized light, resulting in a positive dichroic difference D∗ (see Fig. S1 B in the Supporting Material). Just the opposite effect is expected for the amide II mode, because it is almost perpendicular to the amide I mode (32–34). The resulting dichroic difference spectrum D∗ of amide I and amide II has a characteristic pattern that clearly indicates the orientation of the α-helix.
Polarized absorption spectra and the dichroic difference spectrum D∗ for the amide I and amide II bands of N-Ras were recorded (Fig. 1). The amide I band at 1661 cm−1, typical for an α-helix, is positive, and the amide II at 1545 cm−1, also typical for an α-helix (32), is negative. This pattern clearly indicates that the majority of the helical content of Ras is oriented perpendicular to the membrane.
Figure 1.
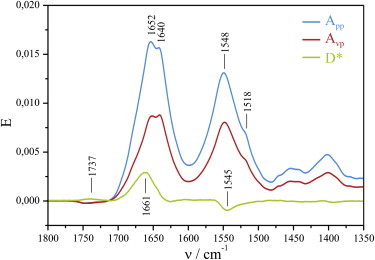
Binding of lipidated Ras to a solid supported POPC bilayer. Calculating the dichroitic difference spectra D∗ allows the determination of the orientation of the absorbing groups, e.g., α-helices. The calculation of D∗ of Ras shows a positive band in the amide I and a negative band in the amide II regions; these band positions are indicative of α-helices. Therefore, the average of all Ras α-helices is oriented more perpendicular to the membrane.
Seventy-percent of the helical content of Ras is found in helices 3, 4, and 5, all of which have the same orientation. To find an overall measure for the average orientation of Ras relative to the membrane, we defined the angle α (Fig. 2). It is the angle between the membrane normal and a vector that represents the mean orientation of all helices. The latter is obtained by the simple addition of the vectors for each helix. The length of each vector corresponds to the length of the helix, while the direction is obtained by a regression line through the backbone atoms along the helix. A perpendicular orientation with a small angle α (Fig. 2 A (I)) represents our experimental result. Unfortunately, an orientation with a large angle α (Fig. 2 A (II)) as proposed by Gorfe et al. (17) does not agree with our experimental results.
Figure 2.

Orientation of N-Ras·GDP at a POPC membrane. The angle α between the α-helix vector (red arrow) and the normal of the membrane (black arrow) defines the orientation. The α-helix vector is the vector sum of the regression line through the backbone atoms of each helix of the protein. According to our MM simulations, a Ras monomer (A) always orients with a large α as shown in orientation (II). Only a Ras dimer (B) is stable with a small angle α, which is in accordance with our dichroic FTIR measurements.
Molecular-mechanics simulations of Ras monomers
The proposal of a parallel-oriented Ras results from MM simulations of H-Ras (18) and K-Ras (19) bound to a DMPC membrane with a maximum simulation time of 40 ns. Here, we extended the approach of Gorfe et al. (18) and Abankwa et al. (19) and performed several longer (200 ns) MM simulations of the full-length N-Ras bound to a POPC membrane which matches the conditions of our experimental setup. We analyze the angle α of our simulations, which is revealing the orientation of the protein regarding to the membrane. This orientation is the only available observable, which can be compared directly to experimental results. To create independent simulations runs, we started our simulations with three different orientations (α = 12°, 36°, or 82°) of the N-Ras G domain including the structures I and II (Fig. 2 A). In the start structures, there are no contacts between the G domain and the membrane. We deleted one lipid from the membrane. Close to this missing membrane lipid, we positioned the free ends of the side chains of the two lipid moieties of the protein anchor. The last carbon atom of each lipid protein anchor is placed directly above the plane through the phosphatidylcholines of the membrane. Thus, the penetration depth of the anchor side chains is zero. This is necessary because it is impossible to achieve a spontaneous peptide insertion within the accessible timescales (i.e., those available as of this writing) of MM simulations (17). After 50 ns, the protein is stably attached to the membrane (see Fig. S2 in the Supporting Material). This attachment process is artificial but essential to prevent any predetermined attachment to the membrane.
The orientation of Ras monomers during the simulation can be followed by the angle α (Fig. 2 A). Independent of differences in the starting structure, the orientation becomes stable after ∼50 ns and results in all cases in a G domain orientation of ∼80°, thus parallel to the membrane. The N-Ras monomer shows an orientation parallel to the POPC membrane, in agreement with the earlier simulations of K-Ras and H-Ras attached to a DMPC membrane by Gorfe et al. (18) and Abankwa et al. (19). This is still in sharp contrast to the experimental value of (23 ± 2)° from the dichroic ATR-FTIR experiments (gray bar in Fig. 2), which indicate a perpendicular orientation. How can this contradiction between simulations and experiments be resolved?
Molecular-mechanics simulations of Ras dimers
An evaluation of all published x-ray structural models of Ras showed that Ras forms dimers in 50 out of the 71 structures. Even among crystals with four different space groups, the same Ras dimer is formed (see Fig. S3 in the Supporting Material). Can Ras dimerization resolve the contradiction?
To elucidate the influence of dimerization on the orientation of membrane-bound Ras, MM simulations with Ras dimers based on the crystal structure PDB:1QRA were performed (Fig. 2 B). We set up the simulation system for the Ras dimer by following the same protocol as for the Ras monomer. But, due to dimerization, there are four lipid moieties that have to be positioned close to the membrane. Therefore, the range of possible starting structures without direct G domain membrane contact is smaller for the dimer than for the more flexible monomer. The simulations were started with α-values of 3°, 5°, and 17° and run for 200 ns each. After 50 ns, a stable attachment (see Fig. S2 in the Supporting Material) and orientation at the membrane were obtained. The last 150 ns of the simulation trajectories were used to analyze the dimer structure. Independent of the start orientation, the Ras dimer has an averaged angle α of 21°, in full agreement with the experimentally observed value of (23 ± 2)° meaning a perpendicular orientation (structure III in Fig. 2). Dimerization resolves the contradiction; now our MM simulations and dichroitic IR measurements are in full agreement.
Dimerization measured by FRET experiments
To provide additional independent experimental evidence for dimerization, FRET experiments were performed. In FRET experiments, the distance between two neighboring Ras proteins is determined, by measuring the energy transfer between two fluorescence labels attached to individual Ras monomers (Fig. 3). In these experiments, we used the same setup for membrane-anchored Ras as was previously used for dichroitic ATR-FTIR measurements. For FRET analysis, the fluorescence lifetimes were measured by the mentioned time-correlated single-photon counting setup. The fluorescence lifetimes of Ras·Mant-GDP in the presence (τDA) and absence (τD) of the acceptor (Ras·TNP-GDP) were determined. From these values, the FRET efficiency E was determined according to
| (5) |
Figure 3.
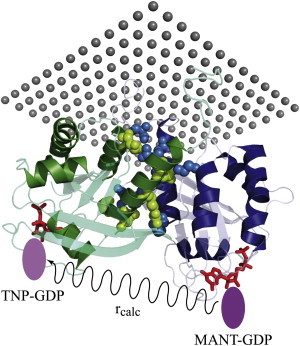
Proposed Ras dimer with a FRET donor (Mant-GDP) and a FRET acceptor (TNP-GDP). MM simulations resulted in an rcalc of 46 ± 3 Å, consistent with the experimental rexp of 46 ± 6 Å.
The obtained histograms (Fig. 4) clearly show that the lifetime is reduced in the presence of the acceptor. For a quantification of the FRET effect, the histograms were analyzed as described above (Eqs. 1 and 2). The average lifetime decreased in the presence of an acceptor from 5.5 ns to 4.9 ns. This corresponds to a measured FRET efficiency of ∼11%. Assuming a dimer, the actual FRET effect is even larger than that measured. Due to the statistical distribution of the nucleotides, only a certain fraction of the Ras dimers carry both a Mant- and a TNP-GDP (Fig. 3), whereas others carry two Mant or two TNP nucleotides. Therefore, the measured FRET efficiency is reduced by a factor of 2.57. Taking this into account, the FRET efficiency in the actual Mant-TNP-dimers is calculated to be 28% (see the Supporting Material for a detailed analysis). The observed FRET effect can only be explained by a neighboring Ras in a dimer or oligomer, thereby confirming our experimental and theoretical observation of perpendicularly oriented Ras dimers.
Figure 4.
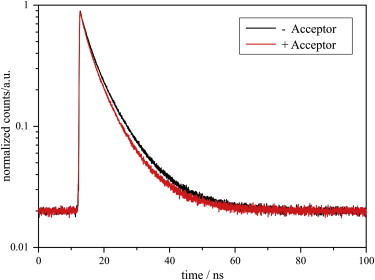
FRET leads to a decrease in the lifetime of Mant-GDP fluorescence. Histograms of Mant emission of membrane-bound Ras loaded with a Mant-GDP/GDP mixture (−Acceptor, black) and loaded with a Mant-GDP/TNP-GDP mixture (+Acceptor, red), respectively. Histograms were referenced against Ras bound to GDP to subtract the background signal and were normalized.
In contrast to membrane-bound lipidated Ras, Ras without lipid anchor in solution (10 μM) exhibits a FRET efficiency of only 3.5%. Therefore, dimerization in solution can be excluded under physiological concentrations. The results in solution point to a low-affinity complex. Dimerization clearly depends on the high local concentrations created due to membrane binding. To exclude surface concentration effects under our experimental conditions, dichroitic binding kinetics (see Fig. S4 in the Supporting Material) were measured. They showed that D∗ is independent of surface loading, and therefore the perpendicular orientation is not a nonspecific effect of molecular crowding. Additionally, in the FRET measurements, we used only 8% surface loading to avoid FRET due to crowding. However, even a random distribution of this surface concentration may induce a FRET signal. A theoretical FRET efficiency analysis according to Wolber and Hudson (35) for a random distribution at the experimental surface concentration of Ras (see the Supporting Material) results in a 6% FRET efficiency. This is much smaller than the observed efficiency of 11%, confirming that the observed FRET effect is caused by Ras dimerization and not by randomly concentrated Ras on the ATR surface.
The Ras-Ras distance
From the Förster efficiency, we can calculate the FRET distance rexp according to Eq. 6,
| (6) |
where R0 is the Förster radius and rexp is the distance between donor and acceptor (Fig. 3). R0 is calculated by applying Eq. 4.
Here, κ2 is determined by the overlap of the fluorescence labels and depends on their dynamics (36). Often a value of 2/3, which is the value for isotropic distribution, is assumed for κ2. Under the experimental conditions, the dynamics of the labels might be restricted at the surface. Therefore, we performed MM simulations using the experimental conditions and arrived at a lower κ2 of 0.41. The corresponding standard deviation of 0.31 indicates orientational flexibility, but the mean value is slightly smaller than the commonly used value of 2/3, which shows that a small part of the configuration space is not populated. Further details on the calculation of κ2 and R0, including the quantum yield Q0 and the overlap integral J, are explained in detail in the Supporting Material. The Förster radius is calculated to be 40 Å. For the measured FRET efficiency of 28%, this translates to a FRET distance of 46 ± 6 Å. The MM simulation of the proposed dimer results in an rcalc of 46 ± 3 Å (average of three dimer simulations). This result confirms the presence of lipid-anchored Ras dimers and agrees nicely with the structural dimer model (Fig. 3), as observed in most x-ray structures.
The Ras dimer interaction surface
The last 150 ns of the simulation trajectories (Fig. 2 B) were used to analyze the dimer structure. The interaction surface of the dimer is mainly composed of α-helices 4 and 5 and the loop between β2 and β3. A scheme of stable amino-acid interactions of the equilibrated dimer at the membrane was acquired (Fig. 5). The salt bridge between Arg161 and Asp154 remains stable during our simulations. Some additional interactions that are not observed in the x-ray structural models are formed (Fig. 3), namely interactions of Lys135 with Glu49 and the π-π interaction between Glu49 and His131. The interface containing both salt bridges is stabilized by an intramolecular connection between β2, β3 loop and α-Helix 5 through the salt bridge of Asp47 with Arg164 and Arg161 of the same Ras protein. The dimer is further stabilized by van der Waals interaction between Met168 and Gly138. The surface representation of the interface is given (see Fig. S10 in the Supporting Material). While His131 is found only in N-Ras, all the other residues are not isoform-specific. Thus, a similar interaction surface should exist in H-Ras and K-Ras. Mutations in a neighboring residue, Asn153, are related to the Noonan (K-Ras) and Costello (H-Ras) syndromes (37). In summary, the residues in helices α4, α5 and the loop between β2 and β3 form a stable interaction network, which results in a stable interface. Mutations of the crucial amino acids should destroy the dimer and lead to a parallel Ras orientation.
Figure 5.
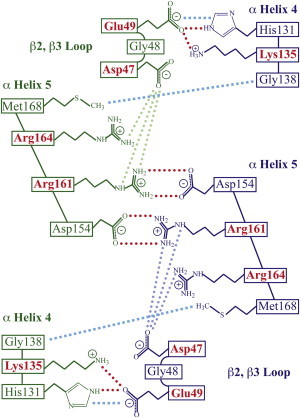
Ras dimerization interface. Stable amino-acid interactions include the salt bridges (magenta circles) between Arg161 and Asp154 and between Lys135 and Glu49. Arg164 further participates via π-π interactions with His131, and Met168 and Gly138 by van der Waals interactions (cyan squares). Intramolecular interactions stabilizing the network are found between Glu47 and Arg161 and Arg164 (light blue and light green circles). Amino acids that show impact in cell experiments (red).
Impact of dimer mutants on the situation in the cell
In principle, the experimental result shows a dimer, but oligomerization of Ras cannot be excluded. However, the crystal contacts and the results of the MM simulations clearly favor a dimer. Although the observation of Ras dimers in highly concentrated x-ray crystals does not automatically imply that dimer formation occurs in vivo, it has to be taken into account that the local protein concentration at the membrane in vivo may be comparable to crystallization conditions. Considering the height of Ras (∼5 nm height) as the third dimension and thereby approximating the accessible diffusion volume of membrane-bound Ras, the local concentration of Ras is roughly 1–5 mM within nanoclusters and 10–50 μM in average for the whole plasma membrane in vivo (38). These values are in the same region as the protein concentration of 0.7 mM used for crystallization of Ras (39). Interestingly, residues that are known to have an impact on Ras signaling are located in the proposed dimer interface. These residues, located in α-helices 4 and 5 and in the loop between β2 and β3, have been proposed to interact with the lipid membrane by acting in a nucleotide-dependent membrane interaction as the so-called switch III (20). However, in light of our findings we now put forth an alternative explanation. The residues at positions 135 and 161 are crucial for dimerization due to electrostatic interactions (Fig. 5). Therefore, mutations at these positions to alanine result in decreased signaling in cell-based assays (20).
Dimer effects on interacting signaling proteins
The dimer might influence the activation state in several ways. One possibility is that Ras dimers facilitate the binding of other proteins, such as guanine nucleotide exchange factor. Ras activation by Son of Sevenless (SOS), which possesses two binding sites for Ras, one catalytic and one allosteric binding site, could be enforced. To explore whether the dimer influences effector proteins, molecular modeling of the Ras dimer in complex with the Ras-binding domain of Raf-1, the GTPase-activating protein Neurofibromin 1 (NF1(1–333)), and the catalytic domain of SOS (SOScat) was performed. In all cases, interaction with at least one Ras is possible.
Furthermore, it is known that nucleotide loading and the type of lipid mixture can influence the partition and orientation of Ras at the membrane. Here, we have used Ras·GDP and a POPC membrane. It is obvious that the experiments have to be expanded to mimic in vivo conditions for GDP and GTP. Most interesting is the question of whether the orientation is affected by GTP/GDP exchange as proposed. Interestingly, Inouye et al. (21) have found evidence for Ras dimerization upon lipid interaction using a bifunctional amine-reactive cross-linker. Using lipid-modified H-Ras purified from SF9 cells in a Raf-1 activation assay, they found that Ras forms dimers in liposomes and also in intact cells, which is essential for Raf-1 activation.
Potential in vivo role of the Ras dimer
Ras dimerization could contribute to nanoclustering. Small clusters of ∼6 Ras proteins have been found (40). Their size and occurrence vary depending on the isoform and activation state. Whereas several scaffolding proteins are known to influence these clusters (41), the driving forces of such clustering are, to our understanding, still not known. Transient dimerization of Ras could also drive such a clustering. It is known that reversible dimerization alone can cause membrane proteins to cluster into oligomer-like structures (42). This is caused by diffusion-limited partner switching of the dimerizing molecules, and the cluster size depends on the lateral diffusion rate and the stability of the dimers.
Conclusion
Lipidated Ras·GDP bound to a POPC bilayer shows a perpendicular orientation relative to the membrane as revealed by dichroitic ATR-FTIR experiments. This perpendicular orientation is only stable when Ras dimerizes, as revealed by MM simulations. The presence of Ras dimers, as observed in numerous x-ray crystals, was confirmed by FRET experiments. The FRET results are in agreement with the MM simulations of these Ras dimers, yielding an intermolecular distance of 46 Å. The residues identified as crucial for dimer formation are also crucial in Ras signaling in cellular physiological experiments, as indicated by their respective mutations to alanine (20). The dimerization should be confirmed in future experiments at a physiological membrane. The proposed dimer interface might open an avenue for influencing signal transduction by a seemingly novel type of small molecule that inhibits dimer formation.
Acknowledgments
The authors thank Oliver Theissen for performing some of the MM simulations and Mathias Massarczyk for programming analytical tools. We thank Jürgen Schlitter for fruitful discussions.
This work was supported by the Deutsche Forschungsgemeinschaft under grant No. SFB 642 and the Center for Vibrational Microscopy (cofinanced by the European Union and the state North Rhine-Westphalia).
Footnotes
This is an Open Access article distributed under the terms of the Creative Commons-Attribution Noncommercial License (http://creativecommons.org/licenses/by-nc/2.0/), which permits unrestricted noncommercial use, distribution, and reproduction in any medium, provided the original work is properly cited.
Contributor Information
Carsten Kötting, Email: carsten.koetting@rub.de.
Klaus Gerwert, Email: gerwert@bph.rub.de.
Supporting Material
References
- 1.Vetter I.R., Wittinghofer A. The guanine nucleotide-binding switch in three dimensions. Science. 2001;294:1299–1304. doi: 10.1126/science.1062023. [DOI] [PubMed] [Google Scholar]
- 2.Wittinghofer A., Vetter I.R. Structure-function relationships of the G domain, a canonical switch motif. Annu. Rev. Biochem. 2011;80:943–971. doi: 10.1146/annurev-biochem-062708-134043. [DOI] [PubMed] [Google Scholar]
- 3.Thapar R., Williams J.G., Campbell S.L. NMR characterization of full-length farnesylated and non-farnesylated H-Ras and its implications for Raf activation. J. Mol. Biol. 2004;343:1391–1408. doi: 10.1016/j.jmb.2004.08.106. [DOI] [PubMed] [Google Scholar]
- 4.Kötting C., Güldenhaupt J., Gerwert K. Time-resolved FTIR spectroscopy for monitoring protein dynamics exemplified by functional studies of Ras protein bound to a lipid bilayer. Chem. Phys. 2012;396:72–83. [Google Scholar]
- 5.Spoerner M., Prisner T.F., Kalbitzer H.R. Conformational states of human H-Ras detected by high-field EPR, ENDOR, and 31P NMR spectroscopy. Magn. Reson. Chem. 2005;43:S74–S83. doi: 10.1002/mrc.1693. [DOI] [PubMed] [Google Scholar]
- 6.He H.-T., Marguet D. Detecting nanodomains in living cell membrane by fluorescence correlation spectroscopy. Annu. Rev. Phys. Chem. 2011;62:417–436. doi: 10.1146/annurev-physchem-032210-103402. [DOI] [PubMed] [Google Scholar]
- 7.Klähn M., Rosta E., Warshel A. On the mechanism of hydrolysis of phosphate monoesters dianions in solutions and proteins. J. Am. Chem. Soc. 2006;128:15310–15323. doi: 10.1021/ja065470t. [DOI] [PubMed] [Google Scholar]
- 8.Topol I.A., Cachau R.E., Burt S.K. Quantum chemical modeling of the GTP hydrolysis by the RAS-GAP protein complex. Biochim. Biophys. Acta. 2004;1700:125–136. doi: 10.1016/j.bbapap.2004.04.007. [DOI] [PubMed] [Google Scholar]
- 9.te Heesen H., Gerwert K., Schlitter J. Role of the arginine finger in Ras·RasGAP revealed by QM/MM calculations. FEBS Lett. 2007;581:5677–5684. doi: 10.1016/j.febslet.2007.11.026. [DOI] [PubMed] [Google Scholar]
- 10.Rocks O., Peyker A., Bastiaens P.I. An acylation cycle regulates localization and activity of palmitoylated Ras isoforms. Science. 2005;307:1746–1752. doi: 10.1126/science.1105654. [DOI] [PubMed] [Google Scholar]
- 11.Nagele E., Schelhaas M., Waldmann H. Chemoenzymatic synthesis of N-Ras lipopeptides. J. Am. Chem. Soc. 1998;120:6889–6902. [Google Scholar]
- 12.Bader B., Kuhn K., Kuhlmann J. Bioorganic synthesis of lipid-modified proteins for the study of signal transduction. Nature. 2000;403:223–226. doi: 10.1038/35003249. [DOI] [PubMed] [Google Scholar]
- 13.Brunsveld L., Kuhlmann J., Waldmann H. Lipidated Ras and Rab peptides and proteins—synthesis, structure, and function. Angew. Chem. Int. Ed. Engl. 2006;45:6622–6646. doi: 10.1002/anie.200600855. [DOI] [PubMed] [Google Scholar]
- 14.Güldenhaupt J., Adigüzel Y., Gerwert K. Secondary structure of lipidated Ras bound to a lipid bilayer. FEBS J. 2008;275:5910–5918. doi: 10.1111/j.1742-4658.2008.06720.x. [DOI] [PubMed] [Google Scholar]
- 15.Weise K., Triola G., Winter R. Influence of the lipidation motif on the partitioning and association of N-Ras in model membrane subdomains. J. Am. Chem. Soc. 2009;131:1557–1564. doi: 10.1021/ja808691r. [DOI] [PubMed] [Google Scholar]
- 16.Kapoor S., Triola G., Winter R. Revealing conformational substates of lipidated N-Ras protein by pressure modulation. Proc. Natl. Acad. Sci. USA. 2012;109:460–465. doi: 10.1073/pnas.1110553109. [DOI] [PMC free article] [PubMed] [Google Scholar]
- 17.Gorfe A.A., Pellarin R., Caflisch A. Membrane localization and flexibility of a lipidated Ras peptide studied by molecular dynamics simulations. J. Am. Chem. Soc. 2004;126:15277–15286. doi: 10.1021/ja046607n. [DOI] [PubMed] [Google Scholar]
- 18.Gorfe A.A., Hanzal-Bayer M., McCammon J.A. Structure and dynamics of the full-length lipid-modified H-Ras protein in a 1,2-dimyristoylglycero-3-phosphocholine bilayer. J. Med. Chem. 2007;50:674–684. doi: 10.1021/jm061053f. [DOI] [PubMed] [Google Scholar]
- 19.Abankwa D., Gorfe A.A., Hancock J.F. Ras membrane orientation and nanodomain localization generate isoform diversity. Proc. Natl. Acad. Sci. USA. 2010;107:1130–1135. doi: 10.1073/pnas.0903907107. [DOI] [PMC free article] [PubMed] [Google Scholar]
- 20.Abankwa D., Hanzal-Bayer M., Hancock J.F. A novel switch region regulates H-Ras membrane orientation and signal output. EMBO J. 2008;27:727–735. doi: 10.1038/emboj.2008.10. [DOI] [PMC free article] [PubMed] [Google Scholar]
- 21.Inouye K., Mizutani S., Kaziro Y. Formation of the Ras dimer is essential for Raf-1 activation. J. Biol. Chem. 2000;275:3737–3740. doi: 10.1074/jbc.275.6.3737. [DOI] [PubMed] [Google Scholar]
- 22.Harding A., Hancock J.F. Ras nanoclusters: combining digital and analog signaling. Cell Cycle. 2008;7:127–134. doi: 10.4161/cc.7.2.5237. [DOI] [PMC free article] [PubMed] [Google Scholar]
- 23.Kuhn K., Owen D.J., Waldmann H. Synthesis of functional Ras lipoproteins and fluorescent derivatives. J. Am. Chem. Soc. 2001;123:1023–1035. doi: 10.1021/ja002723o. [DOI] [PubMed] [Google Scholar]
- 24.Hiratsuka T. New ribose-modified fluorescent analogs of adenine and guanine nucleotides available as substrates for various enzymes. Biochim. Biophys. Acta. 1983;742:496–508. doi: 10.1016/0167-4838(83)90267-4. [DOI] [PubMed] [Google Scholar]
- 25.Lenzen C., Cool R.H., Wittinghofer A. Kinetic analysis by fluorescence of the interaction between Ras and the catalytic domain of the guanine nucleotide exchange factor Cdc25Mm. Biochemistry. 1998;37:7420–7430. doi: 10.1021/bi972621j. [DOI] [PubMed] [Google Scholar]
- 26.Hess B., Kutzner C., Lindahl E. GROMACS 4: algorithms for highly efficient, load-balanced, and scalable molecular simulation. J. Chem. Theory Comput. 2008;4:435–447. doi: 10.1021/ct700301q. [DOI] [PubMed] [Google Scholar]
- 27.van der Spoel D., Lindahl E., Berendsen H.J. GROMACS: fast, flexible, and free. J. Comput. Chem. 2005;26:1701–1718. doi: 10.1002/jcc.20291. [DOI] [PubMed] [Google Scholar]
- 28.Jorgensen W.L., Maxwell D.S., Tirado-Rives J. Development and testing of the OPLS all-atom force field on conformational energetics and properties of organic liquids. J. Am. Chem. Soc. 1996;118:11225–11236. [Google Scholar]
- 29.Frisch M.J., Trucks G.W., Pople A. Gaussian; Pittsburgh, PA: 2003. Gaussian 03. [Google Scholar]
- 30.Groenhof G., Bouxin-Cademartory M., Robb M.A. Photoactivation of the photoactive yellow protein: why photon absorption triggers a trans-to-cis isomerization of the chromophore in the protein. J. Am. Chem. Soc. 2004;126:4228–4233. doi: 10.1021/ja039557f. [DOI] [PubMed] [Google Scholar]
- 31.Warshel A., Levitt M. Theoretical studies of enzymic reactions: dielectric, electrostatic and steric stabilization of the carbonium ion in the reaction of lysozyme. J. Mol. Biol. 1976;103:227–249. doi: 10.1016/0022-2836(76)90311-9. [DOI] [PubMed] [Google Scholar]
- 32.Goormaghtigh E., Cabiaux V., Ruysschaert J.M. Determination of soluble and membrane protein structure by Fourier transform infrared spectroscopy. II. Experimental aspects, side chain structure, and H/D exchange. Subcell. Biochem. 1994;23:363–403. doi: 10.1007/978-1-4615-1863-1_9. [DOI] [PubMed] [Google Scholar]
- 33.Lórenz-Fonfría V.A., Granell M., Padrós E. In-plane and out-of-plane infrared difference spectroscopy unravels tilting of helices and structural changes in a membrane protein upon substrate binding. J. Am. Chem. Soc. 2009;131:15094–15095. doi: 10.1021/ja906324z. [DOI] [PubMed] [Google Scholar]
- 34.Marsh D., Müller M., Schmitt F.J. Orientation of the infrared transition moments for an α-helix. Biophys. J. 2000;78:2499–2510. doi: 10.1016/S0006-3495(00)76795-6. [DOI] [PMC free article] [PubMed] [Google Scholar]
- 35.Wolber P.K., Hudson B.S. An analytic solution to the Förster energy transfer problem in two dimensions. Biophys. J. 1979;28:197–210. doi: 10.1016/S0006-3495(79)85171-1. [DOI] [PMC free article] [PubMed] [Google Scholar]
- 36.Hoefling M., Lima N., Grubmüller H. Structural heterogeneity and quantitative FRET efficiency distributions of polyprolines through a hybrid atomistic simulation and Monte Carlo approach. PLoS ONE. 2011;6:e19791. doi: 10.1371/journal.pone.0019791. [DOI] [PMC free article] [PubMed] [Google Scholar]
- 37.Gelb B.D., Tartaglia M. Noonan syndrome and related disorders: dysregulated RAS-mitogen activated protein kinase signal transduction. Hum. Mol. Genet. 2006;15:R220–R226. doi: 10.1093/hmg/ddl197. [DOI] [PubMed] [Google Scholar]
- 38.Gureasko J., Galush W.J., Kuriyan J. Membrane-dependent signal integration by the Ras activator Son of Sevenless. Nat. Struct. Mol. Biol. 2008;15:452–461. doi: 10.1038/nsmb.1418. [DOI] [PMC free article] [PubMed] [Google Scholar]
- 39.Scheidig A.J., Burmester C., Goody R.S. The pre-hydrolysis state of p21(Ras) in complex with GTP: new insights into the role of water molecules in the GTP hydrolysis reaction of Ras-like proteins. Structure. 1999;7:1311–1324. doi: 10.1016/s0969-2126(00)80021-0. [DOI] [PubMed] [Google Scholar]
- 40.Henis Y.I., Hancock J.F., Prior I.A. Ras acylation, compartmentalization and signaling nanoclusters (Review) Mol. Membr. Biol. 2009;26:80–92. doi: 10.1080/09687680802649582. [DOI] [PMC free article] [PubMed] [Google Scholar]
- 41.Belanis L., Plowman S.J., Kloog Y. Galectin-1 is a novel structural component and a major regulator of H-Ras nanoclusters. Mol. Biol. Cell. 2008;19:1404–1414. doi: 10.1091/mbc.E07-10-1053. [DOI] [PMC free article] [PubMed] [Google Scholar]
- 42.Woolf P.J., Linderman J.J. Self-organization of membrane proteins via dimerization. Biophys. Chem. 2003;104:217–227. doi: 10.1016/s0301-4622(02)00369-1. [DOI] [PubMed] [Google Scholar]
- 43.Jorgensen W.L., Madura J.D. Temperature and size dependence for Monte Carlo simulations of TIP4P water. Mol. Phys. 1985;56:1381–1392. [Google Scholar]
- 44.Ulmschneider J.P., Ulmschneider M.B. United atom lipid parameters for combination with the optimized potentials for liquid simulations all-atom force field. J. Chem. Theory Comput. 2009;5:1803–1813. doi: 10.1021/ct900086b. [DOI] [PubMed] [Google Scholar]
- 45.Darden T., York D., Pedersen L. Particle mesh Ewald: an N·log(N) method for Ewald sums in large systems. J. Chem. Phys. 1993;98:10089. [Google Scholar]
- 46.Berendsen H.J.C., Postma J.P.M., Haak J.R. Molecular dynamics with coupling to an external bath. J. Chem. Phys. 1984;81:5648–5652. [Google Scholar]
- 47.Hess B., Bekker H., Fraaije J.G.E.M. LINCS: a linear constraint solver for molecular simulations. J. Comput. Chem. 1997;18:1463–1472. [Google Scholar]
- 48.Becke A.D. Density-functional thermochemistry. III. The role of exact exchange. J. Chem. Phys. 1993;98:5648–5652. [Google Scholar]
- 49.Lee C., Yang W., Parr R.G. Development of the Colle-Salvetti correlation-energy formula into a functional of the electron density. Phys. Rev. B Condens. Matter. 1988;37:785–789. doi: 10.1103/physrevb.37.785. [DOI] [PubMed] [Google Scholar]
- 50.Canutescu A.A., Shelenkov A.A., Dunbrack R.L., Jr. A graph-theory algorithm for rapid protein side-chain prediction. Protein Sci. 2003;12:2001–2014. doi: 10.1110/ps.03154503. [DOI] [PMC free article] [PubMed] [Google Scholar]
- 51.Kouranov A., Xie L., Berman H.M. The RCSB PDB information portal for structural genomics. Nucleic Acids Res. 2006;34(Database issue):D302–D305. doi: 10.1093/nar/gkj120. [DOI] [PMC free article] [PubMed] [Google Scholar]
- 52.Reuther G., Tan K.-T., Huster D. Structural model of the membrane-bound C terminus of lipid-modified human N-Ras protein. Angew. Chem. Int. Ed. Engl. 2006;45:5387–5390. doi: 10.1002/anie.200504266. [DOI] [PubMed] [Google Scholar]
- 53.Höweler U. CHEOPS Molecular Modeling; Altenberge, Germany: 2007. MAXIMOBY. [Google Scholar]
- 54.Stieglitz B., Bee C., Herrmann C. Novel type of Ras effector interaction established between tumor suppressor NORE1A and Ras switch II. EMBO J. 2008;27:1995–2005. doi: 10.1038/emboj.2008.125. [DOI] [PMC free article] [PubMed] [Google Scholar]
- 55.Scheidig A.J., Franken S.M., Goody R.S. X-ray crystal structure analysis of the catalytic domain of the oncogene product p21H-Ras complexed with caged GTP and Mant dGppNHp. J. Mol. Biol. 1995;253:132–150. doi: 10.1006/jmbi.1995.0541. [DOI] [PubMed] [Google Scholar]
- 56.Dewey T.G., Datta M.M. Determination of the fractal dimension of membrane protein aggregates using fluorescence energy transfer. Biophys. J. 1989;56:415–420. doi: 10.1016/S0006-3495(89)82687-6. [DOI] [PMC free article] [PubMed] [Google Scholar]
Associated Data
This section collects any data citations, data availability statements, or supplementary materials included in this article.