

Abstract
We tested what to our knowledge is a new computational model for fibrin fiber mechanical behavior. The model is composed of three distinct elements: the folded fibrinogen core as seen in the crystal structure, the unstructured α-C connector, and the partially folded α-C domain. Previous studies have highlighted the importance of all three regions and how they may contribute to fibrin fiber stress-strain behavior. Yet no molecular model has been computationally tested that takes into account the individual contributions of all these regions. Constant velocity, steered molecular dynamics studies at 0.025 Å/ps were conducted on the folded fibrinogen core and the α-C domain to determine their force-displacement behavior. A wormlike chain model with a persistence length of 0.8 nm (Kuhn length = 1.6 nm) was used to model the mechanical behavior of the unfolded α-C connector. The three components were combined to calculate the total stress-strain response, which was then compared to experimental data. The results show that the three-component model successfully captures the experimentally determined stress-strain behavior of fibrin fibers. The model evinces the key contribution of the α-C domains to fibrin fiber stress-strain behavior. However, conversion of the α-helical coiled coils to β-strands, and partial unfolding of the protein, may also contribute.
Introduction
Blood clots form in response to vascular injury, thereby stopping the flow of blood in the injured vessel to prevent blood loss and to maintain homeostasis. Blood clots can also occur in undesired locations, or be shed from the vascular wall, causing such diseases as deep vein thrombosis, heart attacks, and ischemic strokes. In an embolism, a blood clot ruptures and the fragments can travel to distal sites in the body, resulting in occluded blood vessels and damaged tissue. Stopping the flow of blood is, in essence, a mechanical task. The mechanical strain experienced by fibrin fibers in vivo depends on the overall magnitude of the forces to which a fibrin clot is exposed. Platelet contraction, fluid shear, and mechanical stress at the wound site produce strain on the fibrin clot. Platelet retraction forces have been reported in the literature on the order of 0.4 N (1,2) and in vitro AFM experimental studies on single fibrin fibers have reported a breaking strain over 200% for un-cross-linked fibrin fibers (3–5). Thus, understanding blood clot mechanical properties—in addition to understanding their structural, biochemical, and dynamic properties—will advance our understanding of hemostasis and clot-associated pathologies, and may aid in the development of more effective treatment options for managing hemorrhage and aberrant coagulation.
Blood clots are multiscale structures, and fully understanding clot mechanical behavior will require understanding the mechanical properties at each scale (6). The major structural and mechanical component of a blood clot is a mesh of fibrin fibers. These fibers have a diameter of ∼100 nm. The building blocks of fibrin fibers are single fibrin molecules, which are ∼46 nm in length and 4.5 nm in diameter; thus there are typically hundreds of fibrin molecules in a fibrin fiber cross-section. The precursor of fibrin is fibrinogen, present at a concentration of ∼2.5 g/L in human blood plasma. Clotting cascade-activated thrombin removes fibrinopeptides A and B from fibrinogen, thus converting it to fibrin (7). Fibrin then spontaneously assembles into two-stranded, half-staggered protofibrils; the key interaction that directs this assembly is the A:a knob:hole interaction, between the two A-knobs located in the central E-domain of fibrin, and the a-holes located in the D-end domains of fibrin (8). The protofibrils then assemble laterally and longitudinally into the mature ∼100-nm-thick fibrin fibers (9). The molecular interactions underlying this lateral assembly are not fully identified; however, the B:b interaction and interactions between the partially unfolded and flexible α-C region appear to play an important role (10,11). It is known that the α-C region consists of a long, unfolded α-C connector and the weakly folded α-C domain.
Because fibrin fibers provide the structural and mechanical backbone of thrombi, the mechanical behavior of fibrin(ogen) and fibrin fibers has become the subject of significant modeling (3,6,12,13) and experimental (3,4,6,13–21) research efforts over the past years. Fibrin fibers are extraordinarily extensible and elastic (5) and have a Young’s modulus of ∼10 MPa (4,15). Fibrin fibers show strain hardening—their modulus increases by a factor of 2–3, when strained beyond twice their original length (3,4). A variety of mechanisms for how various regions of fibrinogen react to mechanical stress have been proposed in both experimental and computational studies; however, there is no clear consensus on whether the majority of fibrinogen’s compliance arises from its highly ordered, or its highly disordered domains (22).
The origin of this elastic extensibility has been a topic of debate over the past few years, and experimental and computational studies implicate the following possible sources:1), unfolding of the α-helical coiled-coils into β-strands (4,12–14), 2), unfolding of the γ-nodules (4,23), and 3), unfolding of the α-C region (3,19). Of recent interest to the field of fibrin mechanics has been the focus on the α-C region of the fibrinogen molecule in clot formation and as the main contributor to elasticity in the system (3,15,19,24). The α-C region is composed of two different structural entities—a partially folded α-domain (Aα392-610, human numbering) and an unstructured α-connector (Aα221-391), at the C-terminal of each fibrinogen Aα chain (25). Tsurupa et al. (25) have demonstrated that the α-C domain is highly unstructured but contains an ordered unique type-I′ β-hairpin, which is restricted at the base by a C423-C453 disulfide linkage and a short turn preceding C423. There is substantial variation in amino-acid sequences of the α-C domains from different vertebrate species; however, they all preserve a disulfide-linked loop, which consists of 31 residues (including two cysteine residues) and has a relatively high conservation of ∼60% identical residues.
This may suggest an important role for the α-C domain in providing structure and stability for the entire α-C region, and thus contributing to the elasticity of the fibrin fiber. To predict the role that the α-C domain plays in providing strain and elastic contribution for fibrin fibers relative to the fibrinogen core, we perform in this study molecular dynamics (MD) simulations of the recently solved structure of the α-C domain, and contrast it to simulations of the fibrinogen core. From the simulations, we then derived parameters to build a mathematical model for the behavior of fibrin fibers, which demonstrate that the α-C domains do indeed play a crucial and previously unknown role in modulating the elasticity of blood clots.
Materials and Methods
AFM fibrin fiber experiments
The fibrin fiber experiments were performed, as described in Liu et al. (5). Briefly, fibrin fibers were formed on a transparent, striated substrate molded from optical glue (NOA-81; Norland Products, Cranbury, NJ) on a No. 1.5 microscope cover slide (VWR International, West Chester, PA). The substrate had 7-μm-wide ridges and 6-μm-deep by 13-μm-wide trenches. Fibers were formed in fibrin buffer (10 mM HEPES at pH 7.4, 5 mM CaCl2, and 140 mM NaCl) with a final concentration of 0.5 mg/mL Fgn, 0.23 units/ml thrombin (and 55 Loewy units/mL FXIII, for cross-linked fibers only). Fibrin was allowed to polymerize for 1 h before being rinsed, labeled with fluorescent beads, and stored in fibrin buffer. Fibrin fibers were fluorescently labeled with 24 nm, yellow-green carboxyl fluorescent beads (Fluospheres; Invitrogen, Carlsbad, CA) diluted 1/10,000 in calcium-free fibrin buffer. To label the fibers, 200 μL of diluted beads were placed on the sample for 10 min, before being rinsed with fibrin buffer. The fibrin fiber stress-strain curves were collected as previously reported in Liu et al. (4) and Carlisle et al. (26).
The atomic force microscope (AFM) (Topometrix Explorer; Veeco Instruments, Woodbury, NY) was set on top of a custom-made inverted optical microscope stage (Zeiss Axiovert 200, Göttingen, Germany). The stage allowed independent control of the AFM cantilever, sample, and microscope objective. The AFM cantilever (model No. CSC38, force constant 14 N/m, length 90 μm, width 35 μm, tip height 15 μm; MikroMasch, Wilsonville, OR) was controlled by nanoManipulator software (3rd Tech, Chapel Hill, NC), allowing nanometer-sized steps in all directions. The nanoManipulator software recorded elapsed time, distance traveled by the AFM tip, and lateral laser shift due to torsion of the cantilever. The force applied to the fiber, Fl, can be calculated by Hooke’s law; Fl = KC ⋅ Il, where KC is the force constant and Il is the lateral shift of the laser (left-right photocurrent). Assuming that the photodiode is rotationally symmetric, the force constant can be obtained from
where E, w, t, l, and Sn are the Young’s modulus of silicon (1.69 × 10¹¹ N/m2)—i.e., the width, the thickness, the length, and the normal sensor response of the cantilever—and h is the height of the tip. The dimensions of the cantilever were determined by optical microscopy. The radius of the fiber was determined by imaging the fiber on top of the ridge with the AFM. For calculating the stress, we then assumed that this diameter remains the same for the length of the fiber across the groove. The optical microscope was used to observe and record movies of the manipulation and to verify the fiber was firmly attached to the ridge. The optical image was also used to measure the initial length of the fiber and visually check the strain of the fiber in comparison to the strain calculated from the travel of the cantilever tip. Force-versus-elongation data were recorded and these data were used to compare to model results.
Molecular dynamics simulations
Two sets of molecular dynamics (MD) simulations were performed: 1), MD simulations for the α-C domains, and 2), MD simulations for the fibrinogen structure.
α-C domain
For the α-C domain, simulations were performed at the Georgia Institute of Technology, Partnership for an Advanced Computing Environment (PACE), Atlanta, GA. The bovine α-C domain structure was obtained from the NMR data deposited to the Protein DataBank (PDB: 2BAF) containing residues Aα374-538 by Burton et al. (27). The domain was then solvated in a water box that accommodated the domain after stretching. The entire system (359,910 atoms) was then minimized for 10 ps and equilibrated for another 10 ps using an NPT ensemble with a 2-fs timestep. This procedure was repeated to produce 10 independent equilibrated structures.
After determining that the 10 separate structures were approximately equivalent, a structure was arbitrarily chosen for the steered molecular dynamics (SMD) simulation (the seventh conformation state was chosen). The Cα atom of G374 was fixed, and a spring (k = 3 kcal/(mol·Å2) = 2 N/m) was attached to the center of the Cα atom of F538. The spring was then pulled at a constant velocity (CV) of 0.025 Å/ps in an NV ensemble. The SMD data and system coordinates were recorded 1/ps for a total of 10 ns. The collected data were then used to create a force-extension curve and RMSD surface map for further analysis. All MD simulations were performed by NAMD (28), and visualization and analysis was performed in VMD (29). End-to-end distance from which the force-extension curve was calculated represents the distance between the residues Aα374-538 of the α-C domain.
Fibrinogen core
MD simulations on the fibrinogen core were performed at the University of Illinois-Urbana Champaign, Beckman Institute for Advanced Science and Technology, Champaign, IL, as described in Lim et al. (12). The simB2/fibh simulation was utilized, which consisted of equilibration for 10 ns and a SMD simulation under CV conditions at 0.025 Å/ps. Again, a spring constant of 3 kcal/(mol·Å2) was used for the simulations. Neutralizing counterions were added to achieve an ionic concentration of 150 mM NaCl. Side chains of residues Asp, Glu, Arg, and Lys were modeled in their charged species, and the protonation states of His residues were chosen to favor the formation of evident hydrogen bonds.
Disulfide bonds were explicitly modeled for each cysteine pair in such an interaction that would be geometrically favorable. These included pairing between all adjacent pairs of cysteines in the central E-region of the fibrinogen heterohexamer. The MD simulations on the fibrinogen molecule were executed using NAMD (28) and visualization analysis was performed using VMD. The end-to-end distance from which the force extension curve was calculated as defined in Eq. 4 represents the distance between the center of mass of the C-terminal helical region, e.g., α-carbons around the cysteines of the α-β-γ chains (residues 164–167, 198–200, and 135–137 respectively), and the corresponding N-terminal cysteine α-carbons (residues 50, 85, and 23, respectively), which had their center of mass fixed in position.
Wormlike-chain model—α-C connector
To determine the free energy of the α-C region connector, it is necessary to sum over all possible conformations of the chain, utilizing the partition function as the basis for this calculation:
For the α-C connector, the partition function is described as
| (1) |
In Eq. 1, U represents the free energy of the individual chain, T represents temperature, f is force, k is the Boltzmann constant, and Rz represents the z component of the end-to-end vector, represented as the sum of the projections of all bond vectors on the z axis,
| (2) |
After simplification, the expression in Eq. 1 becomes
| (3) |
In Eq. 1, the partition function has been expanded to account for all states of the α-C connector, by integrating over all possible orientations of all bond vectors.
Further simplification leads to
| (4) |
The Gibbs free energy of the α-C connector was calculated from the sum of the individual contributions from the unfolded chains of the partition function by
| (5) |
| (6) |
In Eqs. 4–6, bu represents the Kuhn length of the α-C connector. The average end-to-end distance 〈R〉 that the α-C connector contributed to the fibrin fiber network was obtained by differentiating the Gibbs free energy with respect to the applied force. Using the formulary in Brown et al. (6), the end-to-end distance for a freely joined chain is computed as
| (7) |
Utilizing the formulation according to Marko and Siggia (30) under small and large extensions, the force extension expression in Eq. 7 was modified to the wormlike-chain (WLC) model as
| (8) |
Results and Discussion
Modeling of fibrinogen molecule components
The fibrin molecule was split into three regions to model the force extension behavior. The model consists of an elastic two-state α-C region as depicted in Fig. 1 and a fibrinogen core. Several researchers have attempted to elucidate the role of the α-C regions and their potential contributions to fibrin fiber elasticity (3,15,24,25,27). Though still elusive, from these studies it is known that the region itself has an unstructured connector (α-C connector) and a partially unstructured domain (α-C domain). With this structure in mind, a mathematical framework for modeling the fibrin fiber system was constructed. The first section (α-C connector) is composed of a wormlike chain that is modeled using polymer physics. The second section (α-C domain) is constructed of an unstructured/structured domain, where modeling of the force-extension behavior was achieved using SMD and the third section (fibrinogen core) is a structured core, modeled using SMD.
Figure 1.

Idealized representation of α-C region under applied force where the α-connector portion of the region is modeled using a wormlike chain (WLC) and the α-domain is modeled using results from SMD simulations of the bovine α-C domain fragment (PDB: 2BAF). The ribbon represents the β-hairpin that exists on the α-C domain structure. The disulfide bond is located between cysteine residues 423 and 453.
Model of the α-C regions
The α-C domain, mathematically and mechanically, was modeled as a separate entity from the α-C connector. The α-C connector was modeled using the force extension equation (Eq. 8), described in Materials and Methods. The α-C domain, due to the nature and interatomic potentials in its native conformation, contains an energy barrier that prevents unfolding. This energy barrier is primarily due to a disulfide bond that exists within the hairpin structure of the domain. In this work, steered molecular dynamics (SMD) simulations were performed to determine the mechanical response of the α-C domain. The results showed that high forces (exceeding 200 pN) were generated during the simulation and that movement of the residues in the hydrophobic and collapsed region of R420–G454 was significantly restricted (see the Supporting Material). This was due to the presence of a disulfide bond between R420 and G454, which greatly restricted the movement of the domain (Fig. 1).
To further test the rigidity and structure of the α-C domain, the simulation velocity was increased to 0.25 Å/ps (from 0.025 Å/ps) in an effort to engage the rigidity of the compact ordered structure (R420–G454). The force-versus-time results are shown in Fig. 2, where, at ∼400 ps (10 nm), an increase in rigidity is observed and the force increased linearly. The results obtained from the SMD simulation of the α-C domain were modeled as a spring function, κd(ε). Although the domain itself is intrinsically unstable, results from this work and Burton et al. (27) support the methodology that under force, the α-C domain itself increases its stability. These results showed that the spring function of this domain is best represented by a piecewise function with an initial spring function very close to 0 pN/nm (indicating a plastic response of the α-C domain under very low force). After the extension of the regions adjacent to the hairpin loop, the spring stiffens and the spring constant becomes 1290 pN/nm (1.29 nN/nm). These results are displayed in Fig. 2 as well.
Figure 2.

Force-displacement response of the α-C domain (R420–G454) obtained using SMD (constant velocity, 0.25 Å/ps; NV ensemble).
Model of the fibrinogen core
The fibrinogen core was modeled using SMD simulations, obtained from Lim et al. (12). Fig. 3 shows a portion of the force-extension response of the molecule under uniaxial tension conditions, using the parameters described in Materials and Methods. The data were filtered, and a spring function, κf(ε), that represented the entire structural behavior of the fibrinogen molecule, was implemented into the three-component model. The mathematical function used to represent the structural behavior of the fibrinogen molecule was created using MATLAB code (MATLAB; The MathWorks, Natick, MA), in which force applied to the fibrin fiber was used in conjunction with MD data (Fig. 3) to ascertain corresponding displacement values of the molecule. The results showed that the fibrinogen structure was initially stiff, then exhibited a plasticlike behavior where a plateau in the force was experienced. In actuality, although all data from Lim et al. (12) were used as an input for the entire fibrin fiber model, only a small portion of the force was exerted on each fibrinogen monomer during extension for the fibrin fiber system (maximum force per fibrinogen monomer ∼15 pN).
Figure 3.

Force-elongation response of fibrinogen structure (NV ensemble; constant velocity, 0.025 Å/ps).
Model of the entire fibrin system and discussion
Fig. 4 provides a schematic of an idealized fibrin fiber network, composed of core fibrinogen monomers, and the two-state α-C region. Individual fibrin monomers were connected by rigid D:D and A:a/B:b interactions. When stress was applied to the network, it was assumed that there were three main contributions to the output strain on of the fiber: the fibrinogen structure, the α-C connector, and the α-C domain.
Figure 4.

Depiction of fibrin fiber network model, incorporating the effects of the fibrinogen structure (black springs), α-C connector (lines), and the α-C domains (coiled structures).
As stated in the aforementioned, SMD simulation results were used to represent the fibrinogen structure, wormlike chains (WLCs) were used to represent the α-C connector, and SMD results were used to represent the α-C domain. It was assumed that the entire α-C region (connector and domain) was affixed to the network at an angle β with respect to the z axis, and were randomly distributed about the network at various angles, as denoted in Fig. 4. Because of this random orientation, when force was applied to the fibrin fiber network, the chains contributed elongations equivalent to only a fraction of the applied force (in the case of forces applied in the uniaxially in the z direction, the force variable in Eq. 9 would be equivalent to f cos β, contributing to the end-to-end distance 〈R〉 of all of the α-C domains in the network).
Considering that there were ηs fibrinogen springs, ηu α-C connectors, and ηd α-C domains in series for the fibrin fiber, this led to an expression for the total elongation of the network, Δ, as
| (9) |
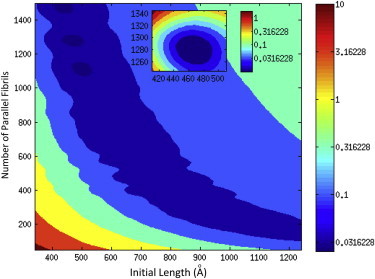
In Eq. 9, κf(ε) and κd(ε) represent the spring function of the fibrinogen monomer and α-C domain, respectively. In the model, there were two α-C regions (connector and domain) per fibrinogen monomer. A value of 0.8 nm was used for the persistence length of the WLC component in Hantgan and Hermans (9). To determine the number of monomers in each fiber cross section, a fiber diameter of 100 nm was used (4) and a 30% volume occupancy of fibrin was assumed (31–33). Assuming a range of diameters for each fibrin monomer as 1.5–8 nm yielded a range on the number of parallel fibrin monomers per fibrin fiber as 50–1300. For comparison to experimental work in Liu et al. (4), the length of the fiber, L0, was 12 μm and the monomer length, l0, was 46.5 nm. Using a least-squares calculation based on the AFM experimental data yielded a total of 1280 fibrin fibrils per cross section and 258 monomers in series along the length of the fiber. These values pertaining to calculations of the number of fibrin monomers in parallel and series are consistent with calculations obtained from Houser et al. (3), Brown et al. (14), Oberhauser et al. (34), and Rief et al. (35) (see the Appendix for a three-dimensional contour graph on the justification for these values). From these calculations, it was seen that the α-C region provides structural rigidity for the fibrin fiber, provides significant extensibility of the fibrin system, and contributes to the strain hardening of the system when compared to AFM experimental results.
Taking into consideration the formulation in Eq. 9 for the development of the force-elongation response of individual fibrin fibers, the constitutive behavior of the fibers utilizing the experimental AFM versus three-component model prediction for the fibrin fiber system is shown in Fig. 5. The results show very good agreement between the experimental and three-component model. The results of Fig. 5 indicate that the α-C region (connector and domain) not only provides elasticity for the fibrin fiber, but also provides strain hardening and structural rigidity in terms of the bulk mechanical behavior of the fibrin fiber. In addition to the results in Fig. 5, the results in Fig. 6 provide curves for the individual strain contributions as a function of force input for each of the three components, based on the model predictions, for various fibril densities (5%, 30%, 50%, and 75%). The results indicate that the α-C domain and the α-C connector (WLC in model) provide much of the strain in the fiber under uniaxial tensile loading conditions. As shown in Fig. 6, the fibrinogen core (in the small strain limit up to ∼1%) provides the initial strain, but was immediately surpassed by contributions from the α-C domain and the α-C connector. This supports the results in Lim et al. (12) that indicate that the fibrinogen core is highly rigid, where the core sustains high forces preceding extension.
Figure 5.
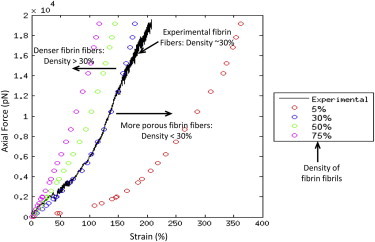
Graph showing experimental (black) versus three-component model prediction of axial force versus strain in fibrin fiber network with contributions from fibrinogen, α-C connector, and α-C domain for various fibril densities (5%, 30%, 50%, and 75%).
Figure 6.

Graph showing percent (%) strain contribution versus axial force for the three-component model. This graph indicates the strain contributions for the fibrinogen structure, α-C connector (WLC), and α-C domain for various fibril densities.
It also supports data indicating the number of tandem repeats in the α-C region as well as crosslinking of the α-C region play a significant role in fiber mechanical properties (21,36). Based on 30% fibrin fiber occupancy conditions, the results in Fig. 6 also demonstrate that the α-C connector provides ∼90% of the total strain in the fiber system up to 0.5 × 10⁴ pN while the α-C domain accounts for only 10% of the total strain in this range. Subsequent to 60% strain, the α-C domain increased its force contribution whereas the α-C connector decreased. At the end of the experiment (2 × 10⁴ pN), the model indicates that the α-C domain accounted for ∼20% of the total strain in the system, the α-C connector 80% strain, and the fibrinogen structure <1% strain. Based on the model, similar results were observed for fibers with densities of 50% and 75%. However, for more porous fibers (5%), the model indicates that the α-C connector and α-C domain both contributed equally to the strain contribution in the system at 2 × 10⁴ pN.
We can estimate the drag forces experienced by a cylindrical fiber in blood flow and compare it to the force required to stretch fibrin fibers. The drag force experienced by a cylinder of diameter D and length L in fluid of density ρ, viscosity η, and velocity v is given by FD = 1/2·Cd·ρ·D·L·v2. The value Cd is the drag coefficient and is given by Cd = 1/Re for small Reynolds numbers, Re (Re < 100). Re ∼ (D·ρ·v)/η, so the drag force on a fibrin fibers is ∼FD = 1/2·η·v·L, which is ∼10 nN (η ∼ 0.003 Pa·s (blood); L = 10−5 m; v = 1 m/s (fast blood flow)). This force would increase significantly, where a large object, such as a platelet, attached to the fiber or if the flow was somewhat turbulent. The force required to stretch this fiber to twice its length (ε = 1 (or 100%)) can be estimated from Hooke’s law FS = Y·ε·A (Young’s modulus Y ∼ 4·106 Pa, A = π·r2 ∼7.8·10−15 m2) to be on the order of tens of nanoNewtons. Thus, the viscous drag force and the force to stretch out fibrin fibers are of the same order of magnitude. It is thus reasonable to assume that fibrin fibers do get significantly stretched in vivo.
In all cases, due to increased force on the fibrin fiber, the α-C domain increased its strain contribution, which indicates its importance for elasticity in the fibrin system. This increased strain contribution of the α-C domain’s role during uniaxial tension is supported by the research in Burton et al. (27) based on NMR calculations and thermodynamic analysis of unfolding. One of the main conclusions in the study was that although the α-C domain itself is intrinsically unstable, in the parent molecule (fibrinogen) the α-C domains may cooperate with each other and with the neighboring structures to increase their stability. In the case of this article, it can be concluded that the α-C domain cooperates with the α-C connector to maintain structural stability in the system. The results in this study also strongly support the hypothesis that the α-C domain accounts for a considerable strain contribution in the fibrin fiber under uniaxial tensile conditions, while the α-C connector accounts for the remaining majority of the strain. From a mechanics standpoint, these results suggest that the role of the fibrinogen core structure in the fibrin system is to endure high forces and provide the necessary rigidity for the fibrin fiber.
Our model complements the results found in Houser et al. (3), where the authors concluded that large strain in fibrin fibers is mediated by the natively unfolded α-C regions of the fibrinogen molecule. Their work included the development of a combined WLC (used to model unstructured regions in the fibrin fiber) and spring model (used to model the structured, stiff regions in the fibrin fiber) that represented the force-versus-strain response of the entire fibrin fiber system. They obtained noteworthy results using this model; however, one significant finding of our results is that it extends beyond the formulary developed in Houser et al. (3) by clearly sequestering the strain contributions of the main components in the fibrin fiber system, namely the α-C connector, the α-C domain, and the fibrinogen structure. Another advancement of our model is that MD data has been used to represent the stiffness of the α-C domain and the fibrinogen core, and these data may realistically represent the molecular structure of the system and provide more-accurate results. In addition, our model accounts for the possible α-to-β transition in the simulations of the protein core. However, it turned out that it only made a minor contribution in the force-extension curve. The model also takes into account possible intermolecular interactions. The A:a and B:b interactions are modeled as rigid sticks. The interactions of the α-C region most likely occur between protofibrils and fibrin monomers; they can, thus, also be considered intermolecular interactions. They are also a key part of our model.
One minor caveat to the model presented here is that it does not consider the rate-sensitive effects of unfolding the three-component system (fibrinogen core, α-C connector, and α-C domain). To achieve the desired forces required to strain the fibrin fiber system to appropriate levels and to complete the simulations in a time-efficient manner, elongation rates on the individual molecular components were used that may not exactly reflect physiological strain rates. However, Hsin and Schulten (37) and Lee et al. (38) published studies in which they performed a series of constant velocity (CV) SMD simulations using velocities that span several orders of magnitude to bridge the gap between traditional simulation timescales and those witnessed in experiments.
The results revealed a trend of outstanding convergence, suggesting strongly that given sufficient computational capacity to access longer timescales, the simulations would produce results mirroring experiments. In addition, there is discrepancy between the simulation data of the fibrinogen core (NVT ensemble) and the α-C domain (NPT ensemble). However, we realize from a statistical mechanics perspective that for the three-component model in this work, thermodynamic quantities are the same when calculating the NVT and NPT ensembles. Considering the fact that we are interested in the comparison of intensive thermodynamic properties (i.e., F or P, T), then thermodynamic quantities are equivalent except for differences of order N−1 (39,40). It is known that there are not large differences of N−1 between the fibrinogen core and the α-C domain, thus it can be assumed that thermodynamic quantities are the same for these two ensembles.
Conclusions
In this work, a new, to our knowledge, model was presented that was used to model the uniaxial force-versus-displacement response of fibrin fibers. The model is unique in the sense that it accounts for contributions to strain of the fibrin fibers at the molecular level, using data from polymer physics calculations for the α-C connector and MD simulations for the α-C domain and fibrinogen structure. Three main components were used to represent the mechanical behavior of fibrin fibers: 1) the fibrinogen structure, 2) the α-C connector, and 3) the α-C domain. In agreement with previous literature studies, results from the simulations in these studies are noteworthy because they indicate that the α-C region of fibrinogen is largely responsible for the elasticity, strain hardening, and large strains in the mechanical behavior of fibrin fibers. The mechanical model was also used to predict how fibrin fibers would behave due to changes in fibrin density, where it was shown that the α-C connector and α-C domain contribute equally to the strain contribution in the system at high forces (2 × 10⁴ pN). Using this framework as an understanding for fibrin fiber mechanical behavior, the results of this work may have significant implications on how fibrin fibers may behave in other states, such as in cancer and diabetes where the fiber density is altered due to disease.
Acknowledgments
The authors thank Dr. Klaus Schulten of the University of Illinois at Urbana-Champaign, Department of Physics, for allowing access and use of the MD data of the fibrinogen core and for helpful discussions during the preparation of this manuscript.
Appendix: Calculations for Determination of the Ideal Number of Fibrils in Parallel and Series
Calculations were done in an effort to determine the ideal number of fibrin fibrils in parallel and series, using a range of parallel fibrils as 50–1300 and a series range of 100–350 monomers in series. Results are shown in Fig. 7, where a three-dimensional contour plot provides results of the number of parallel fibrils versus the initial monomer length. The sum of the mean-squared error, which is associated with the color bar scale, indicates three regions in dark blue that correspond to ideal combinations for the parallel/series monomer calculations. Based on comparison to the experimental data, the ideal combination of parallel-to-series fibrin monomers was 1280 and 258, respectively. The number of fibrin monomers in series, 258, corresponds to an effective monomer length of 46.5 nm, which includes contributions from the fibrinogen structure, α-C domain, and the α-C connector.
Figure 7.
Contour plot used to determine the ideal number of monomers in parallel and series for the fibrin fiber.
Fig. 8 shows the final structures of 10 α-C domains subsequent to minimization and equilibration, as described in Molecular Dynamics Simulations (see above). The yellow structure represents the #7 structure, which was used to conduct the CV SMD simulations.
Figure 8.

Image displaying final structures (10 total) of α-C domain subsequent to minimization and equilibration.
Supporting Material
References
- 1.Carr M.E., Jr., Zekert S.L. Measurement of platelet-mediated force development during plasma clot formation. Am. J. Med. Sci. 1991;302:13–18. doi: 10.1097/00000441-199107000-00004. [DOI] [PubMed] [Google Scholar]
- 2.Rubenstein E. Blood clotting: the force of retraction. Science. 1962;138:1343–1344. doi: 10.1126/science.138.3547.1343. [DOI] [PubMed] [Google Scholar]
- 3.Houser J.R., Hudson N.E., Falvo M.R. Evidence that αC region is origin of low modulus, high extensibility, and strain stiffening in fibrin fibers. Biophys. J. 2010;99:3038–3047. doi: 10.1016/j.bpj.2010.08.060. [DOI] [PMC free article] [PubMed] [Google Scholar]
- 4.Liu W., Carlisle C.R., Guthold M. The mechanical properties of single fibrin fibers. J. Thromb. Haemost. 2010;8:1030–1036. doi: 10.1111/j.1538-7836.2010.03745.x. [DOI] [PMC free article] [PubMed] [Google Scholar]
- 5.Liu W., Jawerth L.M., Guthold M. Fibrin fibers have extraordinary extensibility and elasticity. Science. 2006;313:634. doi: 10.1126/science.1127317. [DOI] [PMC free article] [PubMed] [Google Scholar]
- 6.Brown A.E.X., Litvinov R.I., Weisel J.W. Multiscale mechanics of fibrin polymer: gel stretching with protein unfolding and loss of water. Science. 2009;325:741–744. doi: 10.1126/science.1172484. [DOI] [PMC free article] [PubMed] [Google Scholar]
- 7.Weisel J.W. Fibrinogen and fibrin. In: David A.D.P., John M.S., editors. Advances in Protein Chemistry. Academic Press; New York: 2005. pp. 247–299. [Google Scholar]
- 8.Doolittle R.F. Fibrinogen and fibrin. Annu. Rev. Biochem. 1984;53:195–229. doi: 10.1146/annurev.bi.53.070184.001211. [DOI] [PubMed] [Google Scholar]
- 9.Hantgan R.R., Hermans J. Assembly of fibrin. A light scattering study. J. Biol. Chem. 1979;254:11272–11281. [PubMed] [Google Scholar]
- 10.Weisel J.W., Medved L. The structure and function of the α-C domains of fibrinogen. Ann. N. Y. Acad. Sci. 2001;936:312–327. doi: 10.1111/j.1749-6632.2001.tb03517.x. [DOI] [PubMed] [Google Scholar]
- 11.Veklich Y.I., Gorkun O.V., Weisel J.W. Carboxyl-terminal portions of the α-chains of fibrinogen and fibrin. Localization by electron microscopy and the effects of isolated α-C fragments on polymerization. J. Biol. Chem. 1993;268:13577–13585. [PubMed] [Google Scholar]
- 12.Lim B.B.C., Lee E.H., Schulten K. Molecular basis of fibrin clot elasticity. Structure. 2008;16:449–459. doi: 10.1016/j.str.2007.12.019. [DOI] [PubMed] [Google Scholar]
- 13.Zhmurov A., Brown A.E., Barsegov V. Mechanism of fibrin(ogen) forced unfolding. Structure. 2011;19:1615–1624. doi: 10.1016/j.str.2011.08.013. [DOI] [PMC free article] [PubMed] [Google Scholar]
- 14.Brown A.E., Litvinov R.I., Weisel J.W. Forced unfolding of coiled-coils in fibrinogen by single-molecule AFM. Biophys. J. 2007;92:L39–L41. doi: 10.1529/biophysj.106.101261. [DOI] [PMC free article] [PubMed] [Google Scholar]
- 15.Collet J.-P., Moen J.L., Weisel J.W. The α-C domains of fibrinogen affect the structure of the fibrin clot, its physical properties, and its susceptibility to fibrinolysis. Blood. 2005;106:3824–3830. doi: 10.1182/blood-2005-05-2150. [DOI] [PMC free article] [PubMed] [Google Scholar]
- 16.Soon A.S.C., Stabenfeldt S.E., Barker T.H. Engineering fibrin matrices: the engagement of polymerization pockets through fibrin knob technology for the delivery and retention of therapeutic proteins. Biomaterials. 2010;31:1944–1954. doi: 10.1016/j.biomaterials.2009.10.060. [DOI] [PMC free article] [PubMed] [Google Scholar]
- 17.Stéphanou A., Meskaoui G., Tracqui P. The rigidity in fibrin gels as a contributing factor to the dynamics of in vitro vascular cord formation. Microvasc. Res. 2007;73:182–190. doi: 10.1016/j.mvr.2006.12.002. [DOI] [PubMed] [Google Scholar]
- 18.Urech L., Bittermann A.G., Hall H. Mechanical properties, proteolytic degradability and biological modifications affect angiogenic process extension into native and modified fibrin matrices in vitro. Biomaterials. 2005;26:1369–1379. doi: 10.1016/j.biomaterials.2004.04.045. [DOI] [PubMed] [Google Scholar]
- 19.Helms C.C., Ariëns R.A.S., Guthold M. α-α Crosslinks increase fibrin fiber elasticity and stiffness. Biophys. J. 2012;102:168–175. doi: 10.1016/j.bpj.2011.11.4016. [DOI] [PMC free article] [PubMed] [Google Scholar]
- 20.Carlisle C.R., Sparks E.A., Guthold M. Strength and failure of fibrin fiber branchpoints. J. Thromb. Haemost. 2010;8:1135–1138. doi: 10.1111/j.1538-7836.2010.03824.x. [DOI] [PMC free article] [PubMed] [Google Scholar]
- 21.Falvo M.R., Millard D., Lord S.T. Length of tandem repeats in fibrin’s α-C region correlates with fiber extensibility. J. Thromb. Haemost. 2008;6:1991–1993. doi: 10.1111/j.1538-7836.2008.03147.x. [DOI] [PMC free article] [PubMed] [Google Scholar]
- 22.Guthold M., Cho S.S. Fibrinogen unfolding mechanisms are not too much of a stretch. Structure. 2011;19:1536–1538. doi: 10.1016/j.str.2011.10.008. [DOI] [PubMed] [Google Scholar]
- 23.Averett L.E., Geer C.B., Schoenfisch M.H. Complexity of “A-a” knob-hole fibrin interaction revealed by atomic force spectroscopy. Langmuir. 2008;24:4979–4988. doi: 10.1021/la703264x. [DOI] [PubMed] [Google Scholar]
- 24.Gorkun O.V., Veklich Y.I., Weisel J.W. Role of the α-C domains of fibrin in clot formation. Biochemistry. 1994;33:6986–6997. doi: 10.1021/bi00188a031. [DOI] [PubMed] [Google Scholar]
- 25.Tsurupa G., Tsonev L., Medved L. Structural organization of the fibrin(ogen) α-C-domain. Biochemistry. 2002;41:6449–6459. doi: 10.1021/bi025584r. [DOI] [PubMed] [Google Scholar]
- 26.Carlisle C.R., Coulais C., Guthold M. The mechanical properties of individual, electrospun fibrinogen fibers. Biomaterials. 2009;30:1205–1213. doi: 10.1016/j.biomaterials.2008.11.006. [DOI] [PMC free article] [PubMed] [Google Scholar]
- 27.Burton R.A., Tsurupa G., Tjandra N. Identification of an ordered compact structure within the recombinant bovine fibrinogen αC-domain fragment by NMR. Biochemistry. 2007;45:2257–2266. doi: 10.1021/bi052380c. [DOI] [PMC free article] [PubMed] [Google Scholar]
- 28.Phillips J.C., Braun R., Schulten K. Scalable molecular dynamics with NAMD. J. Comput. Chem. 2005;26:1781–1802. doi: 10.1002/jcc.20289. [DOI] [PMC free article] [PubMed] [Google Scholar]
- 29.Humphrey W., Dalke A., Schulten K. VMD: visual molecular dynamics. J. Mol. Graph. 1996;14:27–38. doi: 10.1016/0263-7855(96)00018-5. [DOI] [PubMed] [Google Scholar]
- 30.Marko J.F., Siggia E.D. Stretching DNA. Macromolecules. 1995;28:8759–8770. [Google Scholar]
- 31.Guthold M., Liu W., Superfine R. Visualization and mechanical manipulations of individual fibrin fibers suggest that fiber cross section has fractal dimension 1.3. Biophys. J. 2004;87:4226–4236. doi: 10.1529/biophysj.104.042333. [DOI] [PMC free article] [PubMed] [Google Scholar]
- 32.Carr M.E., Jr., Hermans J. Size and density of fibrin fibers from turbidity. Macromolecules. 1978;11:46–50. doi: 10.1021/ma60061a009. [DOI] [PubMed] [Google Scholar]
- 33.Voter W.A., Lucaveche C., Erickson H.P. Concentration of protein in fibrin fibers and fibrinogen polymers determined by refractive index matching. Biopolymers. 1986;25:2375–2384. doi: 10.1002/bip.360251214. [DOI] [PubMed] [Google Scholar]
- 34.Oberhauser A.F., Marszalek P.E., Fernandez J.M. The molecular elasticity of the extracellular matrix protein tenascin. Nature. 1998;393:181–185. doi: 10.1038/30270. [DOI] [PubMed] [Google Scholar]
- 35.Rief M., Gautel M., Gaub H.E. Reversible unfolding of individual titin immunoglobulin domains by AFM. Science. 1997;276:1109–1112. doi: 10.1126/science.276.5315.1109. [DOI] [PubMed] [Google Scholar]
- 36.Helms C.C., Ariëns R.A., Guthold M. α-α Cross-links increase fibrin fiber elasticity and stiffness. Biophys. J. 2012;102:168–175. doi: 10.1016/j.bpj.2011.11.4016. [DOI] [PMC free article] [PubMed] [Google Scholar]
- 37.Hsin J., Schulten K. Improved resolution of tertiary structure elasticity in muscle protein. Biophys. J. 2011;100:L22–L24. doi: 10.1016/j.bpj.2011.01.019. [DOI] [PMC free article] [PubMed] [Google Scholar]
- 38.Lee E.H., Hsin J., Schulten K. Discovery through the computational microscope. Structure. 2009;17:1295–1306. doi: 10.1016/j.str.2009.09.001. [DOI] [PMC free article] [PubMed] [Google Scholar]
- 39.Andersen H.C. Molecular dynamics simulations at constant pressure and/or temperature. J. Chem. Phys. 1980;72:2384–2393. [Google Scholar]
- 40.Hill T. Addison-Wesley, and Dover; Dover, DE: 1960, 1986. An Introduction to Statistical Thermodynamics. [Google Scholar]
Associated Data
This section collects any data citations, data availability statements, or supplementary materials included in this article.