Abstract
Since chemical shifts provide important and relatively accessible information about protein structure in solution, a Web server, CheShift-2, was developed for structure interrogation, based on a quantum mechanics database of 13Cα chemical shifts. CheShift-2 to a local inconsistency between two X-ray crystal structures (PDB IDs 1IKN and INFI) of the complex between the p65/p50 heterodimer of NFκB and its inhibitor IκBα. The availability of NMR resonance assignments that included the region of the inconsistency provided an opportunity for independent validation of the CheShift-2 server. Application of the server showed that the 13Cψ chemical shift measured for the Gly270-Pro281 sequence close to the C-terminus of IκBα were unequivocally consistent with the backbone structure modeled in the 1IKN structure, and were inconsistent with the 1NFI structure. Previous NOE measurements had demonstrated that the position of a tryptophan ring in the region immediately N-terminal in this region was not consistent with either structure. Subsequent recalculation of the local structure in this region, based on the electron density of the deposited structure factors for 1IKN, confirmed that the local backbone structure was best modeled by 1IKN, but that the rotamer of Trp258 is consistent with the 1NFI structure, including the presence of a hydrogen bond between the ring NεH of Trp258 and the backbone carbonyl group of Gln278. The consensus between all of these measures suggests that the CheShift-2 server operates well under circumstances in which backbone chemical shifts are available but where local plasticity may render X-ray structural data ambiguous.
Introduction
X-ray crystallography and NMR spectroscopy are the major techniques for determining the three-dimensional structures of proteins. One of the most challenging problems in NMR spectroscopy is the validation of the derived protein structures. Although a plethora of methods has been proposed to determine the accuracy and reliability of protein structures, there is consensus that more sophisticated structural validation methods are needed (Huang et al., 2005; Nabuurs et al., 2006; Bhattacharya et al., 2007; Vila and Scheraga, 2009); the ideal validation tool would be a very sensitive, physics-based method to detect whether or not a given structure or regions of a structure, at the residue level, is flawed. For this reason, we recently introduced CheShift-2, a fast and accurate algorithm for validating protein structures (Martin et al., 2012). This server exploits differences between observed and computed 13Cα chemical shifts as a sensitive probe for possible local flaws in protein structures (Martin et al., 2012). However, differences between computed and observed 13Cα chemical shifts are not always “flaws” and, hence, the origin of the discrepancies or inconsistencies must be investigated. This article reports the application of the CheShift-2 server to a known problem, the distinction between local structures of the same protein that are locally inconsistent between two X-ray crystal structures.
The NFκB transcription factor family functions in the cell in response to external stimuli (Baeuerle, 1998; Karin et al., 2002). The family consists of homodimers and heterodimers of five monomer units (p65, RelB, cRel, p50 and p52) each consisting of a pair of immunoglobulin-like domains (Baldwin, 1996; Baeuerle and Baltimore, 1996). The most common form of NFκB is a heterodimer of p65 and p50 (Sen and Baltimore, 1986; Baldwin, 1996). In resting cells, NFκB (p50/p65) is present in the cytoplasm as a complex with an inhibitor of the IκB family, most commonly IκBα, which contains an ankyrin domain of 6 repeats (Hayden and Ghosh, 2004; Hayden and Ghosh, 2008) (shown schematically in Figure 1A). The complex of NFκB (p50/p65) and IκBα has been characterized extensively, and X-ray structures of NFκB with IκBα(Jacobs and Harrison, 1998; Huxford et al., 1998), as well as with DNA (Chen et al., 1998), are available. The X-ray structures of the NFκB-IκBα complex (Jacobs and Harrison, 1998; Huxford et al., 1998) were published simultaneously from different research groups (Figure 1B, C). Both structures showed the interaction of repeats 1–2 of IκBα with the C-terminal nuclear localization sequence (NLS) of p65 as well as intimate association between ankyrin repeats 4–6 and the dimerization domains of p50 and p65. Neither structure contained the DNA binding domain of p50, and the DNA-binding domain of p65 was rotated from its position in the structure of NFκB (p50/p65) in complex with DNA (Chen et al., 1998). The sequence at the C-terminus of IκBα, immediately before a disordered PEST-like sequence (ie, a sequence rich in Pro, Glu, Ser and Thr residues), showed the largest difference between the two X-ray structures. Indeed, the structure of this region differed not only in the length of the modeled sequence, but in the alignment of the structure with the amino acid sequence, although both structures showed this region located some 25–30 Å from the DNA-binding loops of the p65 DNA binding domain. The relatively long distance between the C-terminal region of IκBα and the DNA binding loops of NFκB was puzzling, because truncation of even a small portion of the C-terminal PEST sequence results in significantly weaker binding of IκBα to NFκB (Kumar and Gelinas, 1993; Ernst et al., 1995; Bergqvist et al., 2008) and in loss of the ability of IκBα to strip NFκB from DNA (Bergqvist et al., 2009). Recent NMR experiments have established that the PEST sequence makes at least transient contact with the DNA binding loops of p65 and that the local backbone and side-chain conformation modeled for the C-terminal sequence of IκBα is not correct in either of the two X-ray structures (Sue and Dyson, 2009). NOEs observed between the Trp NεH and backbone amides in the PEST sequence established the fit of the backbone structure to the amino acid sequence and the correct conformation of the tryptophan ring (Sue and Dyson, 2009). As part of this work, resonance assignments were made for the C-terminal region of IκBα in complex with p50(248–350)/p65(19–321). The present work describes the application of the CheShift-2 server algorithm to these chemical shift data, with the aim of determining whether the server can decide on the basis of chemical shift data alone which crystallographic model is correct.
Figure 1.
A. Schematic diagram showing the NFκB heterodimer of p50 (green) and p65 (red) in complex with the ankyrin repeat domain of IκBα (gray). Both p50 and p65 consist of two immunoglobulin-like domains (shown as ellipses), an N-terminal DNA-binding domain and a C-terminal dimerization domain. B, C. Backbone ribbon showing the X-ray crystal structures of the NFκB(p65/p50)/IκBα complex. B. 1NFI (Jacobs and Harrison, 1998); C. 1IKN (Huxford et al., 1998).
The physics-based approach of CheShift-2 differs from knowledge-based methods (for example, those of Shen and Bax, (2007); Han et al., (2011)), which are able to predict the chemical shifts for several nuclei, not only for 13Cα, as is done with CheShift2. It is beyond the scope of this work to compare the structure-validation capabilities of physics-based and knowledge-based methods.
Results
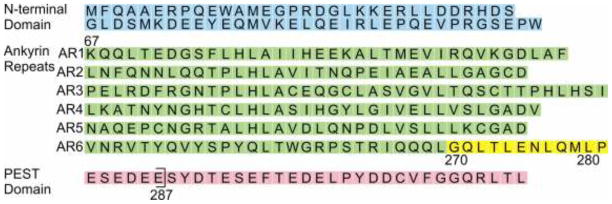
The domain of human IκBα that interacts with the p65/p50 NFκB heterodimer consists of residues 67–317, and includes 6 ankyrin repeat domains and a C-terminal sequence (residues 281–317) rich in Ser, Pro, Glu and Thr residues (Figure 2). The C-terminal sequence has been termed a “PEST” sequence, and it appears to be largely disordered in solution. Crystal structures of the complex between IκBα and p65/p50 NFκB (Jacobs and Harrison, 1998; Huxford et al., 1998) were obtained with a construct of IκBα truncated at the C-terminus to contain residues 67–287, but neither of the structures was able to define the complete C-terminal sequence, due to crystallographic disorder. Coordinates were reported for residues Asp73-Ser293 (Huxford et al., 1998) and for residues Leu70-Glu282 (Jacobs and Harrison, 1998). The NMR experiments (Sue and Dyson, 2009) were performed with the same constructs as had been used in the crystallographic studies, and resonance assignments were obtained for all residues of IκBα, including the entire truncated “PEST” sequence up to residue 287 (Sue and Dyson, 2009). For the purposes of the comparison reported in this work, only the IκBα assignments for residues 270–281 were used, representing the area of the structural discrepancy in the reported X-ray coordinates.
Figure 2.
Amino acid sequence of human IκBα showing the various regions of the protein. The N-terminal domain (not examined in this work) is shown in blue, the ankyrin repeats in green and the C-terminal PEST-like sequence in pink, with the end of the 67–287 construct indicated by a bracket. The residues at the C-terminal end of AR6, for which the analysis was made with CheShift2 (Table 1) are shown in yellow.
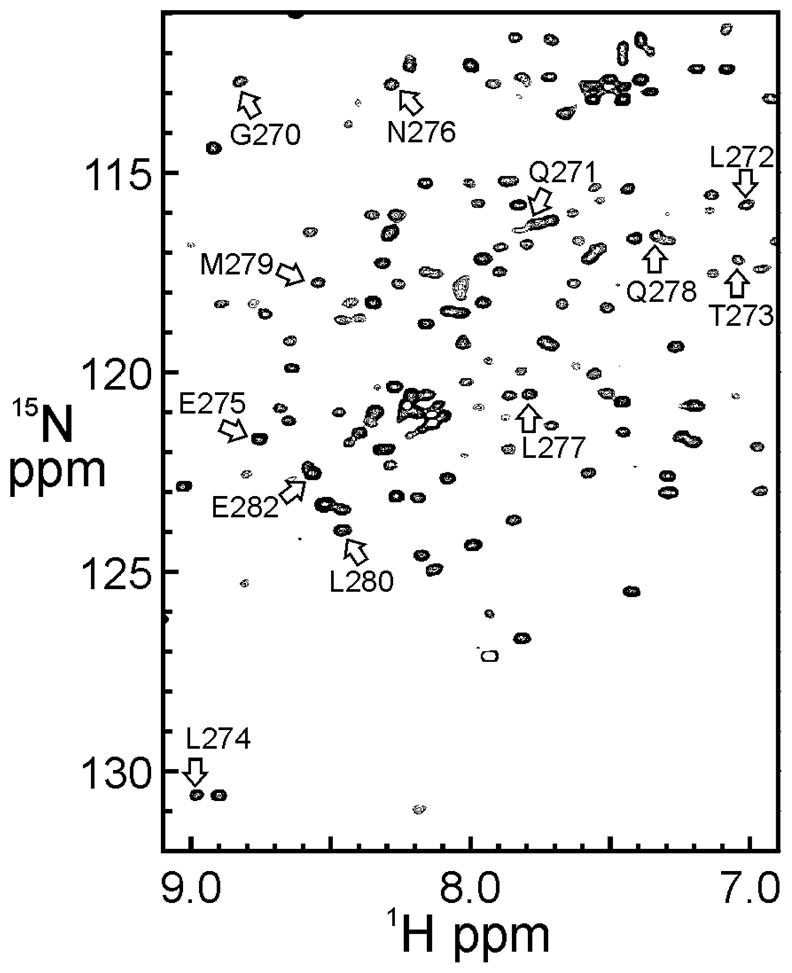
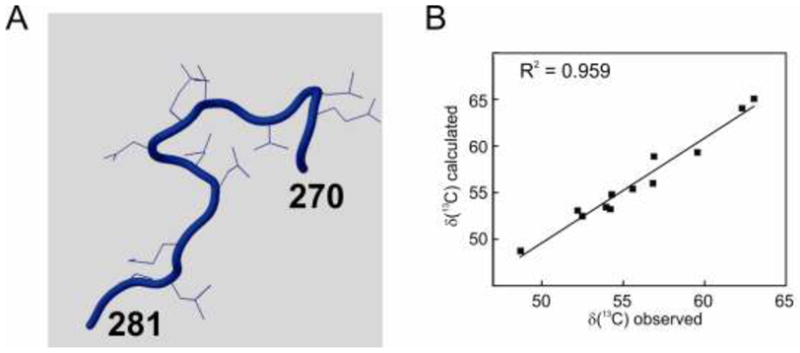
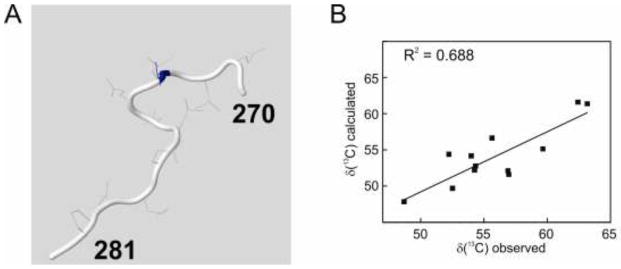
TROSY NMR spectra of the complex of IκBα (67–287) with deuterated NFκB p65(19–321)/p50(248–350) are well resolved despite their relatively high molecular weight (Figure 3) and can be assigned with reference to complexes of smaller constructs of NFκB (Sue et al., 2008). Backbone 13Cα chemical shifts for the IκBα sequence Gly270-Pro281, together with the corresponding coordinates from the protein structures of 1NFI and 1IKN, respectively, were used as input in CheShift-2, and the results of the graphical validation are shown in Figures 4A and 5A. The difference between the observed and computed 13Cα chemical shifts for each residue is summarized in Table 1. This difference is clearly uniformly greater for the 1NFI crystal structure (Jacobs and Harrison, 1998) (Figure 4B) compared to the 1IKN structure (Huxford et al., 1998) (Figure 5B). The results shown in Figure 4 and 5 demonstrate that 1IKN is a better representation of the observed backbone chemical shifts in this region than 1NFI.
Figure 3.

Portion of a 2D 1H-15N TROSY-HSQC spectrum of 15N-labeled IκBα (67–287) in complex with deuterated p65(19–321)/p50(248–350). Resonance assignments for the residues in Table 1 are shown [adapted from (Sue and Dyson, 2009)].
Figure 4.
A. Structure of the segment Gly270 to Pro281 of IκBα, derived from 1NFI (Jacobs and Harrison, 1998) colored by CheShift-2, which discriminates small (blue), medium (white) and large (red) deviations from the structure expected on the basis of the chemical shifts. B. Correlation of the observed chemical shifts (Sue and Dyson, 2009) and those calculated from the 1NFI structure using CheShift-2.
Figure 5.

Structure of the segment Gly270 to Pro281 of IκBα, derived from 1IKN (Huxford et al., 1998) colored by CheShift-2, which discriminates small (blue), medium (white) and large (red) deviations from the structure expected on the basis of the chemical shifts. B. Correlation of the observed chemical shifts (Sue and Dyson, 2009) and those calculated from the 1IKN structure using CheShift-2.
Table 1.
Differences between computed and observed 13C chemical shift values for the segment Gly270 to Pro281 of proteins 1IKN and 1NFI, respectively
| Sequence | <Δμ>1NFI | <Δμ>1IKN |
|---|---|---|
| Gly270 | 3.0 | 1.1 |
| Gln271 | 2.5 | 0.9 |
| Leu272 | 2.8 | 1.6 |
| Thr273 | 1.4 | 1.0 |
| Leu274 | 2.4 | 0.8 |
| Glu275 | 1.9 | 0.1 |
| Asn276 | 2.3 | 0.5 |
| Leu277 | 2.4 | 0.7 |
| Gln278 | 3.0 | 0.9 |
| Met279 | 3.1 | 0.6 |
| Leu280 | 1.8 | 1.0 |
| Pro281 | 1.8 | 1.0 |
X-ray structure factors have been deposited in the Protein Data Bank for 1IKN (Huxford et al., 1998). Using these deposited structure factors, the electron density maps were recalculated. These maps were consistent with the backbone of 1IKN and thus with all of the experimental and theoretical data that have been accumulated on this sequence in the complex. In the recalculated structural model, the indole ring of Trp258 is oriented so that there is a hydrogen bond between its NεH and the backbone carbonyl group of Gln278, as inferred from the NMR NOE results (Sue and Dyson, 2009), rather than the carbonyl group of Leu277 (Jacobs and Harrison, 1998). The alignment of the backbone in the re-calculated model based on a reanalysis of the structure factors comfortably corresponds to that of 1IKN, with the Trp258 side chain conformation consistent with 1NFI and the NMR data. To further validate this new model, we examined the model calculated by PDB-REDO (Joosten et al., 2012), which uses automated pipelines to re-refine datasets using modern software and makes these models publically accessible. The fully optimized PDB-REDO model also contains the Trp258 side chain orientation with the hydrogen bond to the Gln278 backbone. These results confirm that the CheShift-2 server, using chemical shift data alone, validated the correct structural model in this case.
Discussion
It is quite common for the N- and C-terminal residues of proteins to be disordered in crystal structures. Such regions are frequently omitted from structure models, or modeled with high temperature factors, which are often interpreted as evidence of disorder. Heterogeneity in the structures of loops and side chains has recently been exploited in room-temperature crystallography experiments to extract multiple structures (Fraser et al., 2009; Arnautova et al., 2009). The two structures of the NFκB-IκBα complex (Jacobs and Harrison, 1998; Huxford et al., 1998) have reported models for the C-terminal region of IκBα that differ in length as well as in the alignment of the backbone structure to the amino acid sequence and local side-chain conformation. Such ambiguity is not unexpected, given the likelihood that the electron density in the region will be difficult to model due to flexibility. The NMR spectrum also indicates that the C-terminal portion of IκBα is flexible, with poor dispersion of amide proton chemical shifts and relatively strong cross peaks in the 1H-15N HSQC spectrum (Figure 3).
The local structure in the C-terminal region of IκBα is of interest because biochemical evidence suggests that the PEST sequence makes contact with the DNA-binding loops of NFκB p65 (Ernst et al., 1995; Kumar and Gelinas, 1993; Bergqvist et al., 2008), yet these regions are separated by > 25 Å in both structures of the NFκB-IκBα complex (Jacobs and Harrison, 1998; Huxford et al., 1998). It is likely that there is considerable crystallographic disorder in the C-terminal region of IκBα, which provides a possible rationale for reporting two different models for the same region. However, solution studies, including the NMR spectrum and the calculations derived from NMR data alone (without the necessity for a full 3D solution structure calculation) have allowed the local structure of this important region to be modified to give a result that not only reconciles the two published X-ray structures but also provides a satisfactory rationale for the biological observations (Sue and Dyson, 2009). The system also provides a verifiable test of the applicability of the CheShift-2 server for validation of local structures using only chemical shifts (Martin et al., 2012), information that is usually more readily available than NOEs and other less-sensitive NMR information such as coupling constants or relaxation data.
Methods
Graphical visualization of the differences between observed and predicted 13Cα chemical shifts (shown in Figures 4A and 5A) was obtained by using the CheShift-2 server (Martin et al., 2012) which made use of the following sequential steps: (i) for each amino acid residue μ, the difference between observed (Obs) and predicted (Pred) 13Cα chemical-shifts, Δμ = (13Cα, Obs – 13Cα, Pred), is computed; (ii) the Δμ value computed for each residue μ is smoothed by averaging it over the values of the nearest-neighbor residues on each side; (iii) the resulting averaged <Δμ> value is discretized, i.e., <Δμ>integer can adopt the values of 1, 0 or −1, depending on the magnitude of the average differences (<Δμ>),as explained below; and (iv) these discretized values are mapped onto the 3D protein model and associated with a color, blue, white or red, respectively. Implicit in this color-code assignment is the assumption that average differences per residue between observed and predicted 13Cα chemical shifts, which are within ~1.7 ppm (blue), are considered as small; within ~3.4 ppm (white) they are considered as medium, an indication of possible inconsistencies in the experimental data; beyond 3.4 ppm (red), they are considered as large differences and, hence, special attention should be paid to those residues.
Electron density maps based on the structure factors for 1IKN were calculated using Phenix (Adams et al., 2010) and analyzed using Coot (Emsley et al., 2010). The fully optimized PDB_REDO model was retrieved from the public PDB_REDO website: (http://www.cmbi.ru.nl/pdb_redo/ik/1ikn/index.html)
Acknowledgments
This work was supported by grants GM71862 (HJD), DP5OD009180 (JSF), GM14312 (HAS) from the National Institutes of Health and PIP-112–2011–0100030 (JAV) from IMASL-CONICET, Argentina.
Reference List
- Adams PD, Afonine PV, Bunkoczi G, Chen VB, Davis IW, Echols N, Headd JJ, Hung LW, Kapral GJ, Grosse-Kunstleve RW, McCoy AJ, Moriarty NW, Oeffner R, Read RJ, Richardson DC, Richardson JS, Terwilliger TC, Zwart PH. PHENIX: a comprehensive Python-based system for macromolecular structure solution. Acta Crystallogr D Biol Crystallogr. 2010;66:213–221. doi: 10.1107/S0907444909052925. [DOI] [PMC free article] [PubMed] [Google Scholar]
- Arnautova YA, Vila JA, Martin OA, Scheraga HA. What can we learn by computing 13Calpha chemical shifts for X-ray protein models? Acta Crystallogr D Biol Crystallogr. 2009;65:697–703. doi: 10.1107/S0907444909012086. [DOI] [PMC free article] [PubMed] [Google Scholar]
- Baeuerle PA. IκB-NF-κB structures: at the interface of inflammation control. Cell. 1998;95:729–731. doi: 10.1016/s0092-8674(00)81694-3. [DOI] [PubMed] [Google Scholar]
- Baeuerle PA, Baltimore D. NF-κB: ten years after. Cell. 1996;87:13–20. doi: 10.1016/s0092-8674(00)81318-5. [DOI] [PubMed] [Google Scholar]
- Baldwin AS. The NF-κB and I-κB proteins: New discoveries and insights. Ann Rev Immunol. 1996;14:649–683. doi: 10.1146/annurev.immunol.14.1.649. [DOI] [PubMed] [Google Scholar]
- Bergqvist S, Alverdi V, Mengel B, Hoffmann A, Ghosh G, Komives EA. Kinetic enhancement of NF- B•DNA dissociation by IκBα. Proc Natl Acad Sci USA. 2009;106:19328–19333. doi: 10.1073/pnas.0908797106. [DOI] [PMC free article] [PubMed] [Google Scholar]
- Bergqvist S, Ghosh G, Komives EA. The IκBα/NF-κB complex has two hot spots, one at either end of the interface. Protein Sci. 2008;17:2051–2058. doi: 10.1110/ps.037481.108. [DOI] [PMC free article] [PubMed] [Google Scholar]
- Bhattacharya A, Tejero R, Montelione GT. Evaluating protein structures determined by structural genomics consortia. Proteins. 2007;66:778–795. doi: 10.1002/prot.21165. [DOI] [PubMed] [Google Scholar]
- Chen FE, Huang DB, Chen YQ, Ghosh G. Crystal structure of p50/p65 heterodimer of transcription factor NF-κB bound to DNA. Nature. 1998;391:410–413. doi: 10.1038/34956. [DOI] [PubMed] [Google Scholar]
- Emsley P, Lohkamp B, Scott WG, Cowtan K. Features and development of Coot. Acta Crystallogr D Biol Crystallogr. 2010;66:486–501. doi: 10.1107/S0907444910007493. [DOI] [PMC free article] [PubMed] [Google Scholar]
- Ernst MK, Dunn LL, Rice NR. The PEST-like sequence of IkBα is responsible for inhibition of DNA binding but not for cytoplasmic retention of c-Rel or RelA homodimers. Mol Cell Biol. 1995;15:872–882. doi: 10.1128/mcb.15.2.872. [DOI] [PMC free article] [PubMed] [Google Scholar]
- Fraser JS, Clarkson MW, Degnan SC, Erion R, Kern D, Alber T. Hidden alternative structures of proline isomerase essential for catalysis. Nature. 2009;462:669–673. doi: 10.1038/nature08615. [DOI] [PMC free article] [PubMed] [Google Scholar]
- Han B, Liu Y, Ginzinger SW, Wishart DS. SHIFTX2: significantly improved protein chemical shift prediction. J Biomol NMR. 2011;50:43–57. doi: 10.1007/s10858-011-9478-4. [DOI] [PMC free article] [PubMed] [Google Scholar]
- Hayden MS, Ghosh S. Signaling to NF-κB. Genes Dev. 2004;18:2195–2224. doi: 10.1101/gad.1228704. [DOI] [PubMed] [Google Scholar]
- Hayden MS, Ghosh S. Shared principles in NF-κB signaling. Cell. 2008;132:344–362. doi: 10.1016/j.cell.2008.01.020. [DOI] [PubMed] [Google Scholar]
- Huang YJ, Powers R, Montelione GT. Protein NMR recall, precision, and F-measure scores (RPF scores): structure quality assessment measures based on information retrieval statistics. J Am Chem Soc. 2005;127:1665–1674. doi: 10.1021/ja047109h. [DOI] [PubMed] [Google Scholar]
- Huxford T, Huang DB, Malek S, Ghosh G. The crystal structure of the IκBα/NF-κB complex reveals mechanisms of NF-κB inactivation. Cell. 1998;95:759–770. doi: 10.1016/s0092-8674(00)81699-2. [DOI] [PubMed] [Google Scholar]
- Jacobs MD, Harrison SC. Structure of an IκBα/NF-κB complex. Cell. 1998;95:749–758. doi: 10.1016/s0092-8674(00)81698-0. [DOI] [PubMed] [Google Scholar]
- Joosten RP, Joosten K, Murshudov GN, Perrakis A. PDB_REDO: constructive validation, more than just looking for errors. Acta Crystallogr D Biol Crystallogr. 2012;68:484–496. doi: 10.1107/S0907444911054515. [DOI] [PMC free article] [PubMed] [Google Scholar]
- Karin M, Cao Y, Greten FR, Li ZW. NF-κB in cancer: from innocent bystander to major culprit. Nat Rev Cancer. 2002;2:301–310. doi: 10.1038/nrc780. [DOI] [PubMed] [Google Scholar]
- Kumar S, Gelinas C. IκBα-mediated inhibition of v-Rel DNA binding requires direct interaction with the RXXRXRXXC Rel/κB DNA-binding motif. Proc Natl Acad Sci U S A. 1993;90:8962–8966. doi: 10.1073/pnas.90.19.8962. [DOI] [PMC free article] [PubMed] [Google Scholar]
- Martin OA, Vila JA, Scheraga HA. CheShift-2: graphic validation of protein structures. Bioinformatics. 2012;28:1538–1539. doi: 10.1093/bioinformatics/bts179. [DOI] [PMC free article] [PubMed] [Google Scholar]
- Nabuurs SB, Spronk CAEM, Vuister GW, Vriend G. Traditional Biomolecular Structure Determination by NMR Spectroscopy Allows for Major Errors. PLoS Computational Biology. 2006;2:e9. doi: 10.1371/journal.pcbi.0020009. [DOI] [PMC free article] [PubMed] [Google Scholar]
- Sen R, Baltimore D. Inducibility of κ immunoglobulin enhancer-binding protein NF-κB by a posttranslational mechanism. Cell. 1986;47:921–928. doi: 10.1016/0092-8674(86)90807-x. [DOI] [PubMed] [Google Scholar]
- Shen Y, Bax A. Protein backbone chemical shifts predicted from searching a database for torsion angle and sequence homology. J Biomol NMR. 2007;38:289–302. doi: 10.1007/s10858-007-9166-6. [DOI] [PubMed] [Google Scholar]
- Sue SC, Cervantes C, Komives EA, Dyson HJ. Transfer of flexibility between ankyrin repeats in IκBα upon formation of the NF-κB complex. J Mol Biol. 2008;380:917–931. doi: 10.1016/j.jmb.2008.05.048. [DOI] [PMC free article] [PubMed] [Google Scholar]
- Sue SC, Dyson HJ. Interaction of the IκBα C-terminal PEST sequence with NF-κB: Insights into the inhibition of NF-κB DNA binding by IκBα. J Mol Biol. 2009;388:824–838. doi: 10.1016/j.jmb.2009.03.048. [DOI] [PMC free article] [PubMed] [Google Scholar]
- Vila JA, Scheraga HA. Assessing the accuracy of protein structures by quantum mechanical computations of 13C(alpha) chemical shifts. Acc Chem Res. 2009;42:1545–1553. doi: 10.1021/ar900068s. [DOI] [PMC free article] [PubMed] [Google Scholar]


