

Abstract
Studies demonstrate that mitochondrial dysfunction is a key causative factor in liver disease. Indeed, defects in mitochondrial energy metabolism, disrupted calcium handling, and increased reactive oxygen/nitrogen species production are observed in many metabolic disorders and diseases induced by toxicants. Mitochondria have emerged as a main research focus through work defining new functions of this key organelle in normal cellular physiology and pathophysiology. Specifically, studies show a critical role of mitochondrial reactive oxygen/nitrogen species production in regulating cellular signaling pathways involved in cell survival and death. Given this, along with advances made in proteomics technologies, mitochondria are recognized as top candidates for proteomics analysis. However, assessment of mitochondrial function and it’s proteome following toxicant exposure are not trivial undertakings.
In this chapter a technique used to isolate mitochondria from liver tissue is presented along with methods needed to assess mitochondria functionality. The methods described include measurement of mitochondrial respiration, calcium accumulation, and reactive oxygen species production. A presentation of proteomics approaches is also included to allow researchers the basic tools needed to identify alterations in the mitochondrial proteome that contribute to toxicant-mediated diseases. Specifically, methods are presented that demonstrate how thiol labeling reagents in combination with electrophoresis and western blotting can be used to detect oxidant-mediated alterations in mitochondrial protein thiols. A few select pieces data are presented highlighting the power of proteomics to identify mitochondrial targets that contribute to mitochondrial dysfunction and hepatotoxicity in response to specific toxicant exposures and metabolic stressors such as alcohol and environmental tobacco smoke.
Keywords: mitochondria, hepatotoxicity, proteomics
BASIC PROTOCOL - Mitochondrial Protein Thiol Assessment with Proteomics
The ability to detect and possibly identify mitochondrial proteins susceptible to oxidative modifications will facilitate understanding of the molecular mechanisms that contribute to oxidative damage and mitochondrial dysfunction from hepatotoxicant exposures. The key posttranslational modification to mitochondrial proteins to be discussed herein is protein thiol modification. To monitor changes in the mitochondrial thiol proteome, we will present an established method that uses a “thiol-tagging” approach in combination with 1D and 2D gel electrophoresis techniques. In this method, unmodified thiols (e.g., P-SH) are “tagged” with a thiol labeling reagent (biotinylated iodoacetamide, BIAM) that can be visualized by western blotting. In contrast, protein thiol groups that have been oxidized (e.g., P-SOxH) or modified (e.g., P-SSG) can not be labeled by the “thiol-tag” and therefore are identified by a decrease in the intensity of the labeling reagent on western blots.
Reagents and materials for the BIAM-labeling reaction assay of mitochondrial protein thiol groups
Freshly isolated liver mitochondria (see Support Protocol)
10 mM Tris buffer (pH 8.5) containing 1% w/v Triton X-100
Biotin-conjugated iodoacetamide (BIAM) (Invitrogen, product # B1591)
Dimethylformamide
β-mercaptoethanol
Protease inhibitor cocktail (Sigma, product # P8340)
Bio-Rad protein assay kit (Bio-Rad, product # 500-0006)
1.5 mL microcentrifuge tubes
Aluminum foil
Standard laboratory vortex
Ice
Ice buckets
Step 1 - BIAM-labeling protocol for mitochondrial protein thiol groups
Prepare freshly isolated liver mitochondria as described in Support Protocol.
Determine protein concentration of liver mitochondria suspension.
Prepare 1.0 mg mitochondrial protein pellets. Pipette volume of mitochondrial suspension equal to 1.0 mg protein into a 1.5 mL microcentrifuge tube. Keep samples on ice. Prepare mitochondrial protein pellets by centrifuging mitochondrial suspensions at 13,500×g at 4°C for 10 min. After centrifugation, remove and discard supernatant keeping mitochondrial pellets on ice at all times. Prepare sufficient number of 1.0 mg mitochondrial samples tubes for desired gel electrophoresis and western blotting studies.
Gently re-suspend each 1.0 mg mitochondrial pellet in 100 μL of 10 mM Tris buffer (pH 8.5) containing 1% w/v Triton X-100 and 2 μL of protease inhibitor cocktail. Re-suspension is done with gentle up-and-down pipetting of sample until mitochondrial pellet is “dissolved” in buffer leaving a brown translucent extract in the tubes. Place samples on ice.
Prepare 50 μM BIAM stock solution by dissolving BIAM in dimethylformamide. For example, dissolve 2.3 mg BIAM into 1.0 mL of dimethylformamide. Note that it will take approximately 5–10 min of vigorous vortexing to get BIAM into solution. BIAM solution can be prepared before experiments and stored in freezer as small aliquots. It is not recommended that BIAM used for labeling reactions undergo multiple freeze-thaw cycles. Use new BIAM aliquot for labeling reactions.
Add 1.0 μL of BIAM into each 100 μL of mitochondrial extract. Vortex. Wrap sample tubes in aluminum foil and incubate at room temperature for 15 min.
The labeling reaction is terminated by adding 1.0 μL of 2.0 M β-mercaptoethanol stock solution to each sample tube. Vortex.
Determine protein concentration of samples.
BIAM-labeled samples can be stored at −80°C until gel electrophoresis and western blotting experiments.
Materials for SDS-PAGE and western blotting for BIAM-labeled mitochondrial protein thiol groups
Note that most standard 1D SDS-PAGE, 2D IEF/SDS-PAGE, western blotting protocols, reagents, and instruments can be used for assessment of protein thiol alterations with BIAM labeling as presented in the previous section. In light of this, details regarding standard SDS-PAGE gel electrophoresis will not be presented; however, specific instructions for 2D IEF/SDS-PAGE are outlined below as this technique is not a routine method for most laboratories. Details for the detection of BIAM-labeled mitochondrial proteins by western blotting are provided.
2D IEF/SDS-PAGE reagents and supplies
Mitochondrial samples labeled with BIAM per protocol described in previous section (Basic Protocol, Step 1).
2D IEF gel electrophoresis apparatus - Invitrogen ZOOM IPG runner (product # ZM0001) can be used to perform IEF in combination with Invitrogen ZOOM strips (product # ZM0011, pH 3–10), ZOOM IPG Runner Cassettes (product # ZM0003), and the ZOOM Dual Power Supply (product number ZP10002). Please refer to manufacturer’s manual for specific details on set-up and use for 2D gel proteomics.
Ampholyte carriers used for IEF – Ampholines Electrophoresis Reagent (Sigma, product # A5174, pH 3–10 range). Note that other carrier ampholines or ampholytes may be used.
Tributylphosphine (Bio-Rad, product # 163–201)
Rehydration buffer for IEF gel strips – 7 M urea, 2 M thiourea, 2% w/v CHAPS, 0.5% w/v N-dodecyl-β-D maltoside, and 0.002% w/v bromophenol blue
Equilibration buffer for IEF gel strips – 6 M urea, 2.0% w/v SDS, 0.375 M Tris base, 20% v/v glycerol, and 0.002% w/v bromophenol blue (pH 8.8 with HCl). Store this buffer at minus 20°C in 2.0 mL aliquots. Before using this buffer warm to 37°C to re-dissolve urea back into buffer solution.
Dithiothreitol stock solution – 1 M DTT is dissolved in water. Store at −20°C in 50 μL aliquots. Do not re-freeze left over DTT. Use a new aliquot for each experimental day.
Ultrapure, low melting temperature agarose solution for sealing IEF strips to SDS-PAGE gels – 1.0% w/v agarose in 1X SDS-PAGE running buffer. Make fresh on day of each experiment.
Standard 1X SDS-PAGE running buffer for second dimension gel electrophoresis – the 10X running buffer stock solution contains 30 g Tris base, 144 g glycine, 100 mL of 10% w/v SDS with final volume brought to 1.0 L. This 10X stock buffer is stored at 4°C and diluted 1 to 10 with ddH2O when running the 2D SDS-PAGE gel step.
Western blot reagents and supplies
Western blotting transfer buffer (24 mM Tris base, 194 mM glycine, 20% methanol in ddH2O, pH 8–8.5) - This recipe makes 6 L of transfer buffer. Add 17.4 g of Tris base and 87 g of glycine to 3.8 L of ddH2O. The pH of this solution should be between 8.0–8.5, if not, re-make solution from fresh chemicals. Do not adjust pH with addition of acid or base. After making this preliminary buffer solution, take 2, 4 L beakers and to each of these large beakers add 600 mL methanol, 500 mL ddH2O, 1.9 L buffer solution. Mix well and then combine solutions from both beakers in a large carboy container for storage at 4°C.
Streptavidin horseradish peroxidase conjugate (GE Healthcare, Piscataway, NJ, product # RPN1231V)
10X TBS-T stock solution for washing blots - 0.2 M Tris (pH 7.4) containing 9% (w/v) NaCl. Add 5.0 mL of Tween-20 to 1.0 L of 10 X stock wash buffer and stir for 1 hr to ensure that detergent is fully dissolved.
1X TBS-T wash buffer – Dilute 10X TBS-T, 1 to 10 with ddH2O. Store at 4°C.
Antibody dilution buffer – 1% (w/v) BSA in 1X TBS-T. Filter-sterilize into bottles and store at 4°C. Note that the concentration of BSA can be increased to 3% or 5% (w/v), if additional membrane blocking is required for specific tissue samples.
SuperSignal west pico chemiluminescent substrate (Pierce, product # 34080)
X-ray film or imaging instrument compatible with chemiluminescent detection methods
Step 2 - Running the 1D IEF gel strips for 2D gels
BIAM-labeled mitochondria extracts are thawed and kept on ice. Typically, the protein concentration used for 2D IEF/SDS-PAGE gels with the Invitrogen ZOOM system is 50–200 μg per gel strip. This concentration helps to achieve optimal resolution of proteins and maximal BIAM label signal on western blots. It is important to note that protein concentration of stored samples should be re-measured as concentration may change from storage. An optimal protein concentration for samples is between 5–10 μg/μL as this will ensure minimal dilution of chemicals in the IEF rehydration buffer.
Remove needed number of rehydration buffer and DTT tubes from freezer and thaw to room temperature. Do not store thawed reagents on ice as urea and DTT will precipitate.
10 μL ampholines, 10 μL 200 mM tributylphosphine, 40 μL 1M DTT are added to 1.0 mL of rehydration buffer. Mix well and keep at room temperature.
-
The IEF gel strips are rehydrated overnight (16 hr) with a volume of 150–160 μL containing the BIAM-labeled mitochondrial samples. An example of conditions are given below for rehydration of IEF gel strips with buffer and a protein sample that has a protein concentration equal to 10 μg protein/μL.
Desired protein amount
Volume of sample
Volume of rehydration
50 μg 5 μL 155 μL 100 μg 10 μL 150 μL 200 μg 20 μL 140 μL The protein samples are incubated in rehydration buffer for at least 30 min at room temperature before loading samples onto IEF gel strips. Vortex samples every 5–10 min during this extraction incubation step.
Following the detailed procedures provided for the Invitrogen ZOOM system (or comparable system) slowly load the entire 160 μL of sample into an empty strip lane in the ZOOM IPG Runner Cassette (product # ZM0003). Note that the sample loads along the length of the gel lane by capillary action. Pipette the sample slowly to minimize bubble formation in the gel lane slot. Bubbles will result in uneven rehydration of IEF gel strip when strips are inserted in the slots.
After loading all samples into the Invitrogen ZOOM cassette gel lanes, remove the IEF gel strips from freezer, keeping strips on ice. Carefully remove each IEF gel strip from the plastic backing; hold gel strip from the marked negative end (−) with a clean forceps. It is important here to make sure that the plastic backing is removed from IEF gel strips. Sometimes the plastic backing does not peel off. If plastic backing is not removed, the IEF gel strip will not be rehydrated by the sample. Gently slide the IEF gel strip (gel side up) into the ZOOM cassette lane until the strip reaches the positive end (+) of the cassette. After all strips are inserted into the cassette, seal the ends and allow gel strips to rehydrate with sample overnight at room temperature.
After rehydration is complete (16 hr), assemble the ZOOM runner according to the instruction manual directions.
Perform IEF using the following conditions: 175 V for 20 min, ramp to 2000 V for 45 min, hold at 2000 V for 30 min, ramp down to 500 V for 30 min, and then hold at 500 V for 2 hr. Note that as the IEF proceeds, the bromophenol blue dye front will migrate from the top of the IEF gel strip and a green/blue/yellow band will appear at the positive end of the strip after IEF is completed.
After IEF, remove cassettes from ZOOM runner, seal, and freeze at −80°C until 2D SDS-PAGE.
Step 3 - Running the 2D SDS-PAGE gels
Note that many commercially available apparatus are suitable for performing the 2D SDS-PAGE gel electrophoresis step and are compatible with the Invitrogen ZOOM IEF gel strips. For 2D SDS-PAGE, homogenous (10 or 12%) or gradient (8–15%) acrylamide gels can be used. One important note is to use spacer plates that provide enough width between plates for insertion of the IEF gel strip. We recommend 1.5 mm spacers.
Remove previously run IEF gel strips from freezer and allow the strips to thaw for several minutes at room temperature before equilibration step.
Prepare 1.0 mL of equilibration buffer per IEF gel strip. Remove needed equilibration buffer tubes and DTT aliquots from freezer and thaw. Add 50 μL DTT to each 1.0 mL aliquot of equilibration buffer.
Remove the IEF gel strips from the ZOOM cassette by carefully pealing off the plastic covering and using forceps place each IEF gel strip into a separate 15 mL conical tube, gel side up, and then cover each strip with 1.0 mL of equilibration buffer. Gently “rock” the strips on a rotating shaker for 15 min.
During equilibration, prepare the warm agarose solution. This solution is used to “seal” the IEF gel strips into place above the SDS-PAGE acrylamide gel.
After equilibration, remove gel strips from tubes, cut the small plastic end from the negative side, rinse strips in standard 1X SDS-PAGE running buffer, and slide the IEF gel strips between the gel plates of previously prepared acrylamide resolving gel. Gently pipette the warm agarose solution over the gel strip to “seal” the strip on top of the acrylamide resolving gel. Do not introduce bubbles into the space between bottom of gel strip and top of resolving gel as this will prevent transfer of proteins from strip. Slide a “tooth” from a 1.5 mm gel comb between plates at the negative end of the gel. This serves to form a “well” that can be used for adding molecular weight markers. The agarose is allowed to set up 15–30 min before beginning electrophoresis.
Once agarose has hardened, remove the gel comb “tooth” and load molecular weight markers into the homemade well. Assemble the gel apparatus per instructions, fill both inner and outer buffer chambers with standard 1X SDS-PAGE running buffer, and perform electrophoresis for 1–2 hr at 100 V (room temperature) or until the dye front reaches the bottom edge of the gel.
After 2D gel electrophoresis is completed, gels can be stained for total protein (Coomassie blue or SYPRO®Ruby) or subjected to western blotting to detect abundance of BIAM-labeled protein thiols.
Step 4 - Western blotting for BIAM labeled mitochondrial protein thiols
After conventional 1D SDS-PAGE or 2D SDS-PAGE gel electrophoresis, the gel is removed from between the glass plates, the acrylamide stacking gel (1D gel) or agarose sealant gel (2D gel) and the IEF gel strip are discarded, and the acrylamide resolving gel is incubated (soaked) in transfer buffer for 15 min. Both nitrocellulose and PVDF membranes can be used for western blotting, with our laboratory typically using nitrocellulose membranes for this application. Again, most commercially available “wet” western blotting units can be used with the protocol described herein.
After transfer, membranes are incubated in a 1% (w/v) BSA blocking buffer solution prepared in 1X TBS-T. Incubation is conducted overnight at 4°C on a rotating shaker platform.
After blocking, membranes are removed from the blocking buffer and subjected to multiple washes in 1X TBS-T.
After washes, membranes are incubated in a 1 to 100,000 dilution of the streptavidin horseradish peroxidase conjugate for 1 hr at room temperature to visualize BIAM-labeled mitochondrial proteins.
Again, membranes are subjected to multiple washes in 1X TBS-T before reaction with chemiluminescent reagents.
Washed membranes are incubated with SuperSignal West Pico Chemiluminescent substrate for 1–2 min followed by the visualization of the BIAM-labeled proteins by either film exposures or through use of chemiluminescent imaging device.
Representative results for both standard 1D and 2D SDS-PAGE gel electrophoresis experiments using BIAM-labeled mitochondrial proteins are shown in Figures 1 and 2, respectively. Details regarding experiments are included in figure legends.
Figure 1. Treatment with Angeli’s salt, peroxynitrite, and 4-hydroxynonenal increase protein thiol modifications in liver mitochondria.
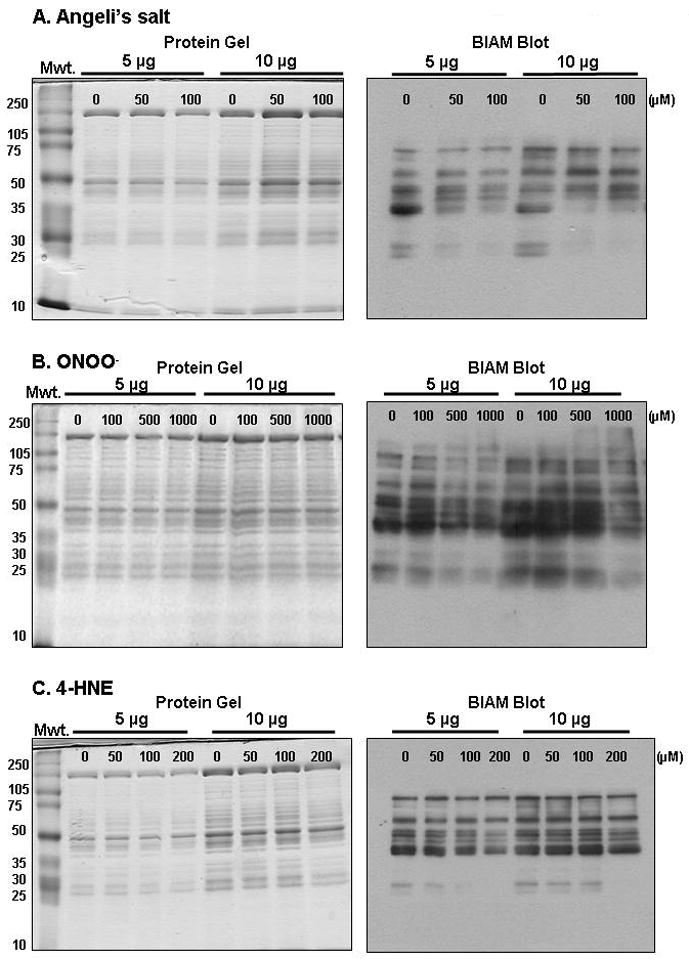
In this figure representative experiments are presented, which show modification of mitochondrial protein thiols by reactive nitrogen and lipid species using the BIAM labeling technique in combination with 1D SDS-PAGE and western blotting. Freshly isolated rat liver mitochondria (1.0 mg protein/mL) were incubated with increasing concentrations of the nitroxyl donor Angeli’s salt (AS, panel A, 0–100 μM), peroxynitrite (ONOO−, panel B, 0–1000 μM), or 4-hydroxynonenal (4HNE, panel C, 0–200 μM) for 15 min at 37°C. After incubations, sample tubes were placed on ice and immediately centrifuged at 10,000×g for 10 min at 4°C. After centrifugation, the supernatant was discarded and mitochondrial pellets were subjected to the BIAM-labeling protocol included in Basic Protocol, step 1. The BIAM-labeled mitochondrial samples (5 or 10 μg protein) were then separated on 1D SDS-PAGE gels (10% acrylamide) using standard gel electrophoresis techniques. The extent of labeling was determined by western blotting using streptavidin-HRP (Basic Protocol, step 4). Note that the left-side panel show gels with blots on the right-side of panels. It is important to note that these treatments, especially at high concentrations, did not result in protein degradation or loss of protein in samples. More importantly, however is the loss or decrease in the BIAM signal in mitochondrial treated with AS and ONOO−, with less of a decrease observed in the 4HNE group. These basic experiments demonstrate that protein thiol groups have been oxidized or modified as a consequence of these treatments. These changes in thiols are detected using western blotting where decreased labeling with BIAM is shown by decreased streptavidin-HRP immunoreactivity (i.e., signal) on the blot.
Figure 2. Modification of the mitochondrial thiol proteome by chronic alcohol consumption and environmental tobacco smoke.
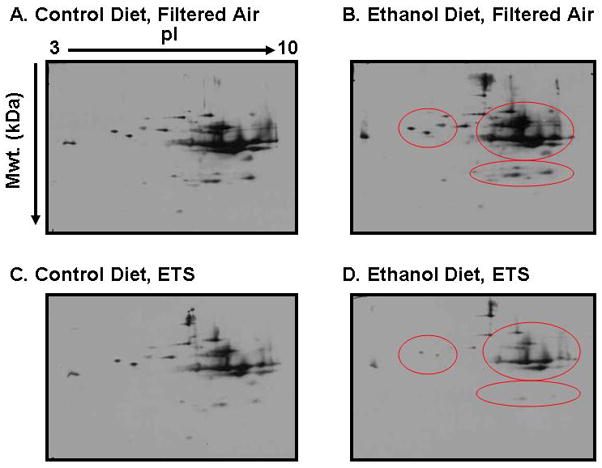
In this figure representative 2D western blots are shown for BIAM-labeled mitochondrial proteins. For this experiment, mice were exposed to a control or an ethanol (29% total daily calories) containing diet and either filtered air or low-level environmental tobacco smoke (ETS, 10 mg/m3 total suspended particulate) for 4 weeks (Bailey et al. 2009). After exposures, mitochondria were isolated from livers of mice and incubated with the thiol labeling reagent BIAM (50 μM) per Basic Protocol, step 1. The samples were then subjected to 2D gel electrophoresis and BIAM labeling was determined by western blotting with streptavidin-HRP (Basic Protocol, steps 2–4). A decrease in BIAM-labeling signal indicates oxidation and/or modification of cysteine residues in proteins. Based on this, a preliminary assessment of the mitochondrial thiol proteome shows that co-exposure to ethanol and ETS results in a significant decrease in thiol labeling of multiple mitochondrial proteins (panel D, red circled area) as compared to control groups (panels A and C) and the ethanol alone group (panel B, red circled area). It is important to note analysis of the gels showed equal loading of protein and no major loss in protein content in the ethanol + ETS group. Therefore, the decreased signal is due to a loss in protein thiols in response to modification/oxidation of thiols and simply a change in protein content (gels not shown).
Step 5 - 2D gel and western blot image analysis
Stained gels are scanned using an imager, e.g. Bio-Rad Fluor-S imager or ChemiDoc XRS (Bio-Rad Laboratories, Hercules CA) and then analyzed for differences in protein density using PD-Quest Image Analysis software (Bio-Rad Laboratories).
For image analysis of 2D gels, individual protein spots on each gel are identified by the software program. While the computer program identifies individual protein spots on each gel, it is critical that these IDs are manually verified to generate a match-set of gels for control (untreated) and treatment group gels. The protein spot densities are compared across all gels and a reference gel is selected. The reference gel serves as the master gel image. The master gel typically contains the highest abundance of detected protein spots.
Using a built-in algorithm, automatic matching of protein spots in each gel to the corresponding protein spots in the master gel is performed followed by manual verification to correct for any proteins that may have been incorrectly matched to proteins in the reference gel.
To correct for any inter-gel protein loading differences, the density data for all protein spots in each gel should be normalized to the total density in valid protein spots for that particular gel.
Normalized protein spot densities are then transferred into an Excel spreadsheet where the mean densities are calculated for statistical analyses.
BIAM-labeled mitochondrial proteins visualized using a Bio-Rad Chemi-Doc imager are analyzed for differences in protein thiol intensity using the same approaches described for gel analysis.
Protein thiol blot intensities are normalized to total protein by dividing protein thiol blots densities by protein gel densities. Similarly, the thiol intensity of individual proteins are normalized to density of its corresponding protein.
Statistical analysis on both protein and protein thiol blot densities were performed essentially as described in (Venkatraman et al. 2004; Andringa et al. 2008).
Step 6 - Protein identification with matrix assisted laser desorption ionization time-of-flight (MALDI-TOF) mass spectrometry
Protein “spots” of interest (i.e. those altered in abundance and/or via thiol modification) are excised from the gels and the “protein gel plugs” are subjected to processing via standard methods in a mass spectrometry core laboratory. See http://www.uab.edu/proteomics and (Bailey et al. 2008; Andringa et al. 2009) for helpful information.
Samples are typically de-stained by three 30 min washes in a 50%, 50 mM NH4HCO3/50% acetonitrile solution followed by a 16 hr incubation at 37°C with trypsin (12.5 ng/μL, Promega Gold Trypsin) to digest proteins.
The resulting peptide solution is extracted by 2, 30 min washes with a 50/50 solution of 5% formic acid and acetonitrile; supernatants are then collected, and dried using a Savant SpeedVac.
The dried peptide samples are re-suspended in 0.1% formic acid, desalted (C18 ZipTips, Millipore), and diluted 1:10 with a saturated solution of α-cyano-4-hydroxycinnamic acid matrix before application to MALDI-TOF target plates.
After plating, samples are dried before analysis with a Voyager De-Pro mass spectrometer in the positive mode.
Spectra are analyzed using Voyager Explorer software and peptide masses identified by mass spectrometry submitted to the MASCOT database (see www.matrixscience.com) for protein identification.
Proteins identified from gels are generally classified using the Universal Protein Resource website (www.uniprot.org) maintained by UniProt Consortium.
SUPPORT PROTOCOL - Isolation of Liver Mitochondria
To ensure the success of proteomic studies (Basic Protocol) and functional measurements (Alternate Protocols 1–3) described within this chapter, it is essential that proper methods are used for the isolation of liver mitochondria with high respiratory capacity. We have included a method in this Support Protocol section, which should ensure preparation of highly functional, tightly coupled liver mitochondria.
Reagents and materials for mitochondrial isolation
Rat, e.g. Sprague-Dawley, 200–250 g body weight will have on average an 8–10 g liver
Isolation buffer - 0.25 M sucrose buffer with 5 mM Tris-HCl and 1 mM EDTA, pH 7.4
-
Protease inhibitors prepared as stock solutions:
PMSF (Sigma) 40 mg/mL methanol *Make on day of experiment Leupeptin (Sigma) 10 mg/mL ddH2O Store at −20°C Pepstatin (Sigma) 1 mg/mL methanol Store at −20°C Aprotinin (Sigma) 10 mg/mL 10 mM HEPES, pH 8.0 Store at −20°C in 100 μL aliquots Do not freeze/thaw Standard laboratory centrifuge
UV-visible spectrophotometer
Bio-Rad protein assay kit (Bio-Rad, product # 500-0006)
Motor-driven homogenizer/mixer (Fisher Dyna-Mix product # 14-498-45A) or comparable drill press
1 serrated-bottom Teflon pestle with glass homogenizer 50 mL size
1 smooth-bottom Teflon pestle to fit same 50 mL glass homogenizer
15 mL glass homogenizer
1 smooth-bottom Teflon pestle to fit same 15 mL glass homogenizer
Appropriate-size centrifuge tubes (e.g., Sorvall centrifuge tube 50 mL size product # 03146)
Glass rods
10 mL graduated cylinder
Beakers, 1 (100 mL) and 3 (250mL)
Standard spectrophotometric cuvettes for protein determination
Scissors
Tweezers
Isolation of Liver Mitochondria
Prepare sufficient amount of isolation buffer for mitochondrial isolation. For example, 500 mL of isolation buffer needed for 1 rat liver. Add protease inhibitors to 500 mL of buffer: 50 μL of PMSF (final conc. 4 μg/mL), 100 μL of leupeptin and 100 μL of aprotinin (final conc. 2 μg/mL) and 500 μL of pepstatin (final conc. 1 μg/mL). For preparation of liver mitochondria from 2 rat livers double the amount of isolation buffer and the amount of all protease inhibitors.
Pour small amount of isolation buffer in 1 beaker and 10 mL of buffer per gram of liver into another beaker. Place buffer on ice. It is important that buffer remain ice-cold throughout the isolation procedure.
Weigh rat.
Following approved euthanasia protocol, quickly remove liver and place it into the beaker containing the small amount of buffer to rinse liver of blood.
Use tweezers to remove the liver from the beaker and weigh liver making sure to dab off excess buffer.
Place liver into the beaker containing the larger volume of buffer (10 mL per g liver) and using scissors chop the liver into small pieces.
Pour ¼ of liver into 50 mL glass homogenizer and add small amount of additional buffer – 10–15 mL. Using the serrated pestle, homogenize the liver with the motor-driven homogenizer instrument. Bring homogenizer up gently making sure to homogenize most of the liver. This usually takes 3–5 passes. It is very important not to over homogenize the liver tissue at this step. If homogenization is too harsh and rigorous, mitochondria will be of poor quality and uncoupled. This step needs to be optimized per each laboratory and laboratory personnel. It is also important that the commercially purchased pestles are modified such that the “fit” between pestle and glass homogenizer is loosened. This is easily accomplished by taking pestle and glass homogenizer to a research machine shop. A “looser” fit is needed than that originally manufactured. A tight fit results in “overworked” liver tissue and poor mitochondria preparation.
Once homogenization is complete, pour homogenized liver into 50 mL centrifuge tube.
Repeat step 7, until all liver is homogenized pouring each aliquot into a centrifuge tube on ice. Typically, the entire liver can be homogenized in 4 rounds and divided among 4, 50 mL centrifuge tubes. Rinse pestle with water between each homogenization step.
Balance centrifuge tubes and centrifuge at 560×g for 10 min at 4°C. This separates the pelleted nuclear fraction and cellular debris from supernatant fraction containing mitochondria. Pour supernatant from nuclear pellet and save in a beaker on ice. This fraction containing mitochondria is referred to as post-nuclear fraction.
Using a small volume of isolation buffer, gently break up the nuclear pellet with glass rods and then re-suspend in the centrifuge tube using the smooth pestle. It is important that commercially purchased smooth pestles are also modified so that they fit loosely into the centrifuge tubes. Again, this is easily accomplished by taking pestles and tubes to a research machine shop as described above in step 7.
Repeat centrifugation of washed nuclear fraction at 560×g for 10 min at 4°C.
Add supernatant from nuclear wash step to the beaker containing the saved post-nuclear fraction from step 10. The nuclear pellet can be saved for investigation or discarded.
Pour the post-nuclear fraction containing mitochondria into 4 clean 50 mL centrifuge tubes and centrifuge at 8500×g for 10 min at 4°C to obtain the crude mitochondrial pellet and post-mitochondrial supernatant.
Pour post-mitochondrial supernatant from mitochondrial pellets into a clean beaker. The post-mitochondrial supernatant can be saved for preparation of cytosolic and microsomal fraction or discarded. If post-mitochondrial supernatant is to be saved it is recommended that protease inhibitors (Sigma product # P8340) are added at a concentration of 20 μL/mL.
Add a small amount of isolation buffer to each of the 4 dry mitochondrial pellets, 5–10 mL, and carefully scrape the mitochondrial pellet from the bottom of each of the 4 centrifuge tubes using clean glass rods. Gently re-suspend the mitochondrial pellets by using a smooth-bottomed pestle that loosely fits into the centrifuge tube. Again, see comments above in step 7 and 11 regarding modification of pestles to loosen the fit between homogenizer and centrifuge tubes. Once all mitochondrial pellets are re-suspended add 40–45 mL of additional isolation to buffer to each of the 4 centrifuge tubes.
Centrifuge washed mitochondria at 8500×g for 10 min at 4°C to obtain a second round of mitochondrial pellets.
-
After centrifugation pour off supernatant and repeat wash described in step 16.
However, at this step combine the small volume of mitochondria from 2 centrifuge tubes to 1 centrifuge tube, and then gently re-suspend as in step 16. Thus, at this step you will have 2 centrifuge tubes of re-suspended, washed mitochondria as compared to 4 tubes.
Centrifuge washed mitochondria at 8500×g for 10 min at 4°C to obtain a third round of mitochondrial pellets.
After centrifugation pour off supernatant and repeat wash as in step 16 and 18. However, at this step combine the small volume of mitochondria from the 2 remaining centrifuge tubes into 1 tube, and then gently re-suspend as in step 16. Thus, at this step you will have 1 centrifuge tube of re-suspended, washed mitochondria as compared to 2 tubes.
Centrifuge washed mitochondria at 8500×g for 10 min at 4°C to obtain the final mitochondrial pellet.
After centrifugation pour off supernatant and add a small amount of buffer to final mitochondrial pellet. Typically, one should add 5 mL per 10 g of original liver weight, which will result in approximately a 30 mg/mL mitochondrial protein concentration. It is important that mitochondria are re-suspended in small volume of buffer resulting in a concentrated mitochondrial suspension, e.g. 30–50 mg/mL. Mitochondria maintain functionality if they are stored under concentrated conditions. For final re-suspension gently scrape the mitochondrial pellet from the bottom of the centrifuge using a glass rod and gently re-suspend as before using smooth pestle. To ensure full homogenization, it is important to transfer the mitochondrial suspension to a 15 mL glass homogenizer and homogenize by hand using a smooth-bottom pestle. This last homogenization step helps to ensure that all mitochondria are re-suspended and will not fall out of solution when mitochondria are stored on ice for assays and experiments.
Transfer the final mitochondrial suspension to a 10 mL graduated cylinder and record the volume. Keep mitochondria on ice at all times.
At this point, mitochondria are now ready for use in assays and experiments. It is important to note, that mitochondria do have a limited “shelf-life”. Experiments with isolated mitochondria should be completed within 2–4 hr following isolation.
A protein assay should be done immediately to determine the concentration of isolated mitochondria and mitochondrial respiration rates and extent of coupling should be measured at this time to assess quality and functionality of mitochondria (see Alternate Protocol 1 – Mitochondrial Respiration Measurement).
ALTERNATE PROTOCOL 1 - Mitochondrial Respiration Measurement
Liver mitochondria isolated by the method described in the Support Protocol section should always be tested for respiratory capacity and coupling before performing proteomic and functional assays. Indeed, only coupled mitochondria with high respiratory capacity should be used in experiments. Mitochondrial respiratory function should also be measured to determine whether toxicant exposure damages mitochondria. This can be determined by measuring mitochondrial state 3 and 4 respiration rates and the respiratory control ratio. For example, comparison of respiratory rates (state 3 and 4) between control and experimental groups (e.g., toxicant exposures) can be a very powerful test to help determine whether toxicant exposure causes a mitochondrial defect, which could be important in disease pathogenesis.
Reagents Needed for Mitochondrial Respiration
HEPES respiration buffer - 130 mM KCl, 2 mM KH2PO4, 3 mM HEPES, 2 mM MgCl2, 1 mM EGTA, pH 7.2 with KOH or HCl and store at 4°C
Glutamate-Malate solution - 0.4575 M each, pH 7.2 with KOH and store at 4°C
Succinate - 1 M solution, pH 7.2 with KOH and store at 4°C
10 N KOH
ADP for respiration measurements - 0.027 M ADP in 0.067 M NaPO4 buffer, pH 6.8
-
For NaPO4 buffer: 0.067 M monobasic, NaH2PO4:
6.7 mL of 0.5 M stock, bring to 50 mL final volume with ddH2O and 0.067 M dibasic, Na2PO4:6.7 mL of 0.5 M stock, bring to 50 mL final volume with ddH2O Take 25 mL of monobasic and 25 mL of dibasic, mix, measure pH; bring to final pH of 6.8 with a little more monobasic, if needed.
Rotenone - 1 mM in 95% EtOH
Materials Needed for Mitochondrial Respiration
Hansatech Oxygraph controlling unit with Oxygraph software (product # OXYG1)
DWI Liquid-Phase Electrode chamber (product # DW1)
S1 electrode disc (product # S1)
Teflon membrane (product # S4)
Small and large O-rings (product # S5)
O-ring membrane applicator (product # A2)
No.1 fine electrode disc polish (product # S16)
No.2 course electrode disc polish (product # S16)
Circulating water bath
Cigarette paper
Scissors
Pasteur pipettes
Air-saturated H2O
50% saturated KCl electrolyte solution
Sodium hydrosulfate
Spatulas
ddH2O
Small stir bar
Hamilton 25 μl syringe with extended length needle (syringe - product # 80230, 1702RN, 22s/2″/2; needle – special order 22S 3.6″ point style 2)
Forceps
Freshly isolated liver mitochondria (see Support Protocol)
Step 1 - Preparing the oxygen electrode instrument for respiration measurements
Turn the circulating water bath on with temperature set at 30°C.
The oxygen electrode disc should be cleaned before each use. The anode should be cleaned with the No.1 course electrode disc polish and the cathode should be cleaned with No.2 fine electrode disc polish. The electrode should be rinsed thoroughly with ddH2O before assembly. Please note that these directions are also included with the manufacturer’s instructions. Users are strongly encouraged to refer to these materials for set-up, operation, and maintenance.
Using a glass Pasteur pipette, place a drop of the KCL electrolyte solution on the top of the cathode with placement of 3 more drops equally spaced on the anode.
Cut a 1.5 cm × 1.5 cm piece of cigarette paper.
Cut a 2.5 cm × 2.5 cm of Teflon membrane.
Place the cigarette paper over cathode using forceps.
Place the Teflon membrane over the cigarette paper using forceps.
Once the paper and membrane are properly in place with no wrinkles, place the small oring on the o-ring/membrane applicator, apply the applicator instrument on top of the cathode and push down. This will seal the paper and membrane to the electrode disc. Remove and replace with fresh paper and membrane if wrinkles or bubbles are present.
Next, place the larger outer o-ring into its slot on the anode and place the electrode disc onto the bottom of the chamber per manufacturer’s instructions.
Carefully screw electrode disc into the DWI chamber.
Place DWI chamber on top of the Oxygraph controlling unit and connect tubes from the circulating water bath to the chamber.
Attach electrode wire cable to electrode disc electrical connection.
Plug Oxygraph into the wall socket.
Turn the power on (gray button in front). Green light will illuminate.
Fill inner chamber with ddH2O and place small stir bar into the inner chamber.
At this point you are ready to engage the Oxygraph software. Turn on computer and select Oxygraph plus software. Click the blue button on tool bar to start stirrer; the stir bar will begin to stir. Make sure stir bar is properly setting and stirring on top of the electrode.
Step 2 - Calibration of Oxygraph electrode
Place a 50 mL conical tube containing air saturated H2O (vigorously shaken ddH2O) in 30°C water bath.
Remove water out of the inner chamber using glass Pasteur pipette and replace with 1840 μL of fresh air saturated H2O.
Allow H2O to stir for about a minute making sure that the stir bar stirs in the center of the chamber.
On the Oxygraph plus software select “CALIBRATE” then “Liquid Phase” and set temperature at 30°C and continue to follow steps for calibration provided by the manufacturer.
Allow the oxygen concentration trace to stabilize and establish zero oxygen in chamber and select “OK”.
Using a spatula, add a small amount of sodium hydrosulfate into the chamber and then cap the chamber.
Allow the oxygen concentration trace to stabilize at zero and follow steps on the software to complete calibration.
Once the calibration process is complete remove the sodium hydrosulfate containing H2O from the chamber and rinse thoroughly 4–5x’s with fresh ddH2O.
The oxygen electrode is now ready for respiration measurements. Please make sure that when not in use the inner chamber is filled with fresh ddH2O to prevent membrane from drying out.
Step 3 - Mitochondrial respiration using glutamate/malate as oxidizable substrate: assessment of Complex I-linked respiration
Add 1.74 mL of HEPES respiation buffer to the inner chamber (see reagents needed for mitochondrial respiration #1).
Add 20 μL of glutamate/malate stock solution to the inner chamber (see reagents needed for mitochondrial respiration #2).
Add 80 μL of isolated mitochondria from a suspension of approximately 30 mg mitochondria protein/mL.
Insert the cap into the inner chamber.
Under the hardware option on the Oxygraph software click “Start Recording”.
After establishing a low baseline rate of respiration (state 2 respiration – respiration in the presence of substrate and before addition of ADP), add 9 μL of ADP (0.027 M) through the injection port using a Hamilton syringe. Addition of ADP stimulates state 3 respiration (see reagents needed for mitochondrial respiration #5).
The high rate of state 3 respiration continues until all added ADP is depleted and converted to ATP. Let oxygen concentration trace continue until state 4 respiration has been reached. Continue to measure state 4 respiration (respiration in the absence of ADP) for 5 min.
After respiration measurement is completed, rinse chamber thoroughly with ddH2O and repeat with 2–3 additional measurements per mitochondrial sample. It is important to note that respiration with glutamate/malate should be performed before succinate-mediated respiration studies as the rotenone will contaminate the Teflon membrane. The presence of rotenone in the membrane will inhibit complex I mediated respiration with glutamate/malate. Also, please rinse chamber 3X’s with 70% ethanol before performing succinate-mediated measurements.
Step 4 - Mitochondrial respiration using succinate as oxidizable substrate: assessment of Complex II-linked respiration
Add 1.79 mL of HEPES respiation buffer to the inner chamber (see reagents needed for mitochondrial respiration #1).
Add 26 μL of succinate to the inner chamber (see reagents needed for mitochondrial respiration #3).
Add 20 μL of isolated mitochondria from a suspension of approximately 30 mg mitochondria protein/mL.
Add 3.67 μL of rotenone (see reagents needed for mitochondrial respiration #7).
Insert the cap into the inner chamber.
Once all reagents are added select “Start recording”. After establishing a low baseline rate of respiration (state 2 respiration – respiration in the presence of substrate and before addition of ADP), add 9μL of ADP (0.027 M) through the injection port using a Hamilton syringe. Addition of ADP stimulates state 3 respiration (see reagents needed for mitochondrial respiration #5).
The high rate of state 3 respiration continues until all added ADP is depleted and converted to ATP. Let oxygen concentration trace continue until state 4 respiration has been reached. Continue to measure state 4 respiration (respiration in the absence of ADP) for 5 min.
After respiration measurement is completed, rinse chamber thoroughly with ddH2O and repeat with 2–3 additional measurements per mitochondrial sample.
After all respiration measurements for each mitochondrial sample are completed, rinse and disassemble the Oxygraph electrode instrumentation. Please make sure to store the electrode in a jar containing dessicant. This will help to extend the life of the electrode disc.
Step 5 - Calculation of respiratory rates and respiratory control ratio
See Figure 3 for an example of a typical measurement of mitochondrial respiration using glutamate/malate as oxidizable substrate.
The state 3 (ADP-dependent) and state 4 (ADP-independent) respiration rates are calculated using oxygen consumption data obtained from the Oxygraph software output. A brief description of this process and calculation is included in following segments. Please note that detailed instructions are included by the manufacturer for these manipulations of the software as well.
-
After each individual respiration measurement is completed, using the Oxygraph software click “Rate” and a cursor will appear on the oxygen trace. The state 3 rate is obtained by measuring the change in oxygen concentration over time after the ADP is added and before the ADP is depleted. This is the faster rate of respiration (see Figure 3). The state 4 rate is obtained by measuring the slower change in oxygen concentration over time. This is the lower rate of respiration that occurs after state 3 respiration is completed (see Figure 3). These changes in oxygen concentration for both state 3 and 4 are then used to obtain the oxygen consumption rate (OCR) or respiration rate by using the following calculation:
oxygraph rate obtained is divided by 1000 to give (μmol/mL/min)
number obtained in (a) is multiplied by 2 to obtain (μg O atom/mL/min)
protein assay should be performed: the protein concentration of mitochondrial suspension is then multiplied by 80 and then divided by 1000 to give (mg protein in 80 μL mitochondria) for glutamate/malate; however, for succinate-driven respiration the protein concentration should be multiplied by 20 and then divided by 1000 to give (mg protein in 20 μL mitochondria)
number obtained in (c) is then divided by 1.84 to give mg protein per mL in chamber
divide the number obtained in (b) by the number obtained in (d) to give OCR (μg O atom/min/mg protein).
To obtain the respiratory control ratio (RCR), the state 3 rate (ADP-dependent) is divided by the state 4 rate (ADP-independent). The higher the RCR the higher quality of mitochondria whereas a low number (e.g., < 3) indicates poor quality mitochondria. Typically, liver mitochondria from a normal healthy rat or mouse will have RCR in the range of 6–10. Diseased mitochondria will be lower.
Figure 3. Liver mitochondria respiration.
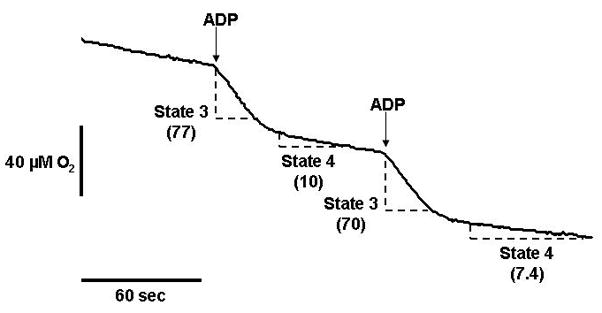
This figure illustrates a representative experiment showing liver mitochondria consuming oxygen in the presence of the Complex I-linked oxidizable substrates glutamate/malate. ADP is added at the arrows to stimulate state 3 respiration, i.e., ADP-dependent respiration. When the ADP is depleted (i.e., converted to ATP) mitochondria revert back to a slower rate of oxygen consumption; state 4 respiration; i.e., ADP-independent respiration. The change in oxygen concentration over time for state 3 and state 4 respiration (dashed line sections) are shown on the trace (numbers in parentheses). These numbers are used to calculate the respiration rates and the respiratory control ratio as described in Alternate Protocol 1.
ALTERNATE PROTOCOL 2 - Mitochondrial Calcium Accumulation Measurement
Studies show that a key predictor of mitochondrial dysfunction from toxicant exposures is the inability of mitochondria to sequester calcium. Moreover, the inability to accumulate calcium is critical in the initiation of apoptotic and necrotic cell death. Towards this end, a number of fluorescence-based molecules and assays have been developed to monitor and quantify toxicant-mediated alterations in mitochondrial calcium accumulation. Here, we describe the use of Calcium green 5N (CaG5N) to monitor calcium accumulation in mitochondria isolated from liver using the method described in Support Protocol.
Reagents and materials needed for calcium accumulation measurements
Freshly isolated liver mitochondria (see Support Protocol)
Perkin Elmer LS 55 Fluorescence spectrometer or comparable instrument
Re-circulating water bath
Respiration buffer without EDTA (see reagents needed for mitochondrial respiration #1)
Calcium green 5N (CaG5N, Invitrogen, product # C3737) – Prepare a 420 μM stock solution in sterile ddH2O. Store in freezer. For experiments dilute to 200 μM concentration (24 μL of dye + 26 μL of sterile ddH2O). Light sensitive.
Succinate – 1 M stock solution used for experiments is listed under reagents needed for mitochondrial respiration #3. Final concentration in assay cuvette is 8 mM.
ADP – 0.027 M stock solution used for experiments is listed under reagents needed for mitochondrial respiration #5. Final concentration in assay cuvette is 0.2 mM.
Rotenone – 1 mM solution used for experiments is listed under reagents needed for mitochondrial respiration #7. Final concentration in assay cuvette is 1 μM.
Oligomycin - 1 mg/mL in ethanol. Oligomycin is purchased from Sigma (product # O4876). Final concentration in assay cuvette is 2 μg/mL. Store in freezer.
Cyclosporin A - 1 mM in ethanol. Cyclosporin A is purchased from Alexis Biochemical (product # L15684). Final concentration in assay cuvette is 1 μM. Store in freezer.
Calcium chloride dihydrate - 10 mM
Pipettes
Cuvettes - 4.5 mL, 4-sided clear cuvettes
Step 1 - Mitochondrial calcium accumulation measurement
Isolate liver mitochondria as described in Support Protocol with the following minor changes. At step #20 (Support Protocol) re-suspend mitochondria in isolation buffer that does not contain EDTA. See isolation buffer under materials. Continue with isolation procedure of mitochondria as described in Support Protocol.
After isolation of mitochondria, perform a protein assay on isolated mitochondria to determine concentration of final mitochondrial suspension.
Turn on spectrofluorometer and re-circulating water bath set at 37°C.
Select parameters on spectrofluorometer so that you can monitor fluorescence changes in CaG5N over time (i.e. time drive or kinetics based program). For the LS 55, select “Time Drive” on FL WinLab software to monitor changes over time.
Excitation and emission wavelengths are set are 506 nm and 532 nm, respectively. Slit widths are set at 2.5 with time set for 2000 seconds.
To cuvette, add 2 mL of respiration buffer without EDTA, 16 μL 1M succinate, 2 μL 1 mM rotenone, 14.8 μL 0.027 M ADP, 2 μL 1 mg/mL oligomycin, and 0.2 mg isolated mitochondria protein. Mix.
Add 2 μL CaG5N Dye to cuvette, mix well, and place the cuvette in thermostatically controlled cuvette chamber. Establish base-line fluorescence reading for 2–3 min before initiating calcium additions.
Add sequential 20 nmol calcium additions to cuvette to monitor calcium accumulation. Continue to add calcium additions to cuvette until the induction of mitochondrial permeability transition (MPT).
Cyclosporin A (2 μL) can be added to cuvette to inhibit, i.e. increase calcium accumulation before induction of the MPT. For this, add Cyclosporin A to cuvette right after mitochondria protein. Proceed with assay as described.
See Figure 4 for an example of a typical experimental readout and induction of the MPT in mitochondria incubated in the absence and presence of Cyclosporin A.
Figure 4. Liver mitochondria calcium accumulation and MPT induction.
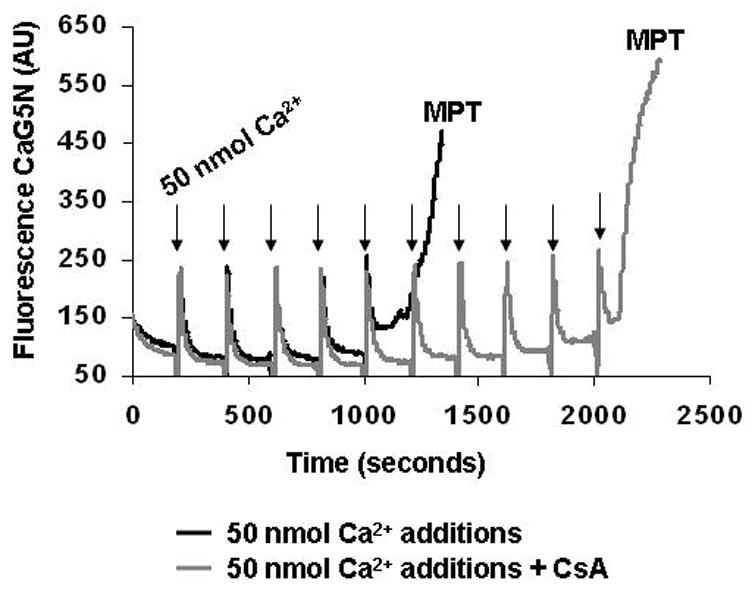
This figure shows a representative experiment of mitochondrial calcium accumulation using the fluorescent dye calcium green 5N (CaG5N) that monitors extra-mitochondrial calcium. As shown in the figure, with each 50 nmol calcium addition (arrows) there is a brief increase in fluorescence signal followed by a rapid decrease in the signal as calcium is taken up and accumulated into mitochondria. Note that mitochondria have a finite ability to accumulate calcium. When this “calcium threshold” level is reached there is a rapid release of calcium, which is indicated by the rapid rise in fluorescence (black line). This rapid release of calcium into the extra-mitochondrial space is related to formation of the mitochondrial permeability transition (MPT) pore. Note that when mitochondria are pretreated with cyclosporin A (CsA), an inhibitor of the MPT pore, mitochondria are able to accumulate twice as much calcium before the induction of the MPT pore, i.e., rapid increase in fluorescence signal (gray line).
Step 2 - Calculation of mitochondrial calcium accumulation
Sum the additions of calcium that were added to the cuvette to induce the MPT pore and report total nmol calcium per mg protein.
For example, 5 additions at 20 nmol before MPT pore induced would be equal to 100 nmol of calcium. This number is then divided by the amount of protein in the cuvette (0.2 mg) for a total of 500 nmol calcium/mg protein.
ALTERNATE PROTOCOL 3 - Mitochondrial Reactive Oxygen Species (ROS) Measurement
It is proposed that many toxic agents exert cell injury via increased mitochondrial reactive oxygen species (ROS) production. This increased production of mitochondrial ROS leads to enhanced formation of secondary reactive species contributing to posttranslational modifications of mitochondrial proteins (see Basic Protocol) and activation/inactivation of oxidant sensitive pathways. Like calcium measurements, a number of fluorescent and chemiluminescent probes have been developed which detect, quantify, and potentially identify ROS. Our laboratory has used the fluorescent probe, 2′,7′-dichlorodihydrofluorescein diacetate (H2DCFDA) to assess mitochondrial and hepatocyte ROS production from toxicant exposures. The protocol described below can easily be adapted to measure mitochondrial ROS production from tissues other than liver, as well.
Reagents and materials for reactive oxygen species measurement
Freshly isolated liver mitochondria (see Support Protocol)
Mitochondrial respiration buffer (see Alternate Protocol 1)
2′,7′-dichlorodihydrofluorescein diacetate (H2DCFDA, Invitrogen, product # D399) – prepared as a 10 mM stock solution (2.4 mg in 0.5 mL DMSO). This stock solution is diluted 1 to 10 with DMSO to obtain a 1 mM working solution that is used for experiments. Make fresh for each experiment.
Succinate – prepared as 1 M solution. Adjust pH to 7.2 with KOH. Store at 4°C. This stock solution is diluted 1 to 10 with ddH2O to obtain a 0.1 M working stock solution for experiments.
Antimycin A – prepared as 10 mM solution in DMSO. Make fresh for each experiment.
FCCP – prepared as a 1 mM solution in ethanol. Store at 4°C.
PerkinElmer LS 55 Fluorescence spectrometer or comparable instrument
Shaking water bath set at 37°C
50 mL Erlenmeyer flasks
21% O2:74% N2:5% CO2 gas mixture
Mitochondrial reactive oxygen species production measurement
Keep prepared mitochondria on ice.
Determine the protein concentration of mitochondrial suspension.
Mitochondria (0.5 mg/mL = 1.5 mg total protein) are suspended in 3.0 mL of respiration buffer containing 2 μM H2DCFDA in the presence and absence of substrates, mitochondrial respiratory inhibitors, and/or uncouplers for 0–60 min to measure ROS production. The flasks are sealed with rubber stoppers and continuously aerated with 21% O2:74% N2:5% CO2 throughout the incubation period. Incubations are performed at 37°C in a shaking water bath. Note that the O2 tension can be altered to study mitochondrial ROS production under lower, more physiological relevant O2 tensions.
For these studies, succinate is added to flasks at a final concentration of 0.2 mM, antimycin is added at a final concentration of 15 μM, and FCCP is added at a final concentration of 5 μM. Glutamate/malate can be substituted for succinate to serve as the oxidizable substrate. Note that equal volumes of the vehicle used for antimycin (DMSO) should be added to flasks not exposed to antimycin treatment.
Inclusion of antimycin can be used as positive control as it is a known stimulator of mitochondrial ROS generation from complex III, whereas FCCP addition can be used as a negative control because dissipation of the membrane potential inhibits ROS production. See Figure 5 for an example of ROS production in mitochondria incubated with antimycin +/− FCCP. Note that ROS production from mitochondria is membrane potential dependent, thus, coupled mitochondria are required for all ROS assays.
During incubation, the fluorescence spectrometer should be turned with excitation and emission wavelengths set to 488 and 525 nm, respectively. As the fluorescence emission of the product DCF is strong, slit widths are typically kept at low settings. Please optimize per laboratory instrumentation.
After incubations, the concentration of DCF generated in mitochondria is determined by reading the fluorescence of the mitochondrial suspensions. The fluorescence values can be reported as arbitrary fluorescence units. However, the concentration of DCF generated can be determined from standard curves using known concentrations of DCF added to mitochondria (0.5 mg/mL), which are reported as pmol DCF/mg mitochondrial protein (Bailey and Cunningham 1998; Young et al. 2002).
Figure 5. Liver mitochondrial reactive oxygen species production – effect of antimycin and FCCP.
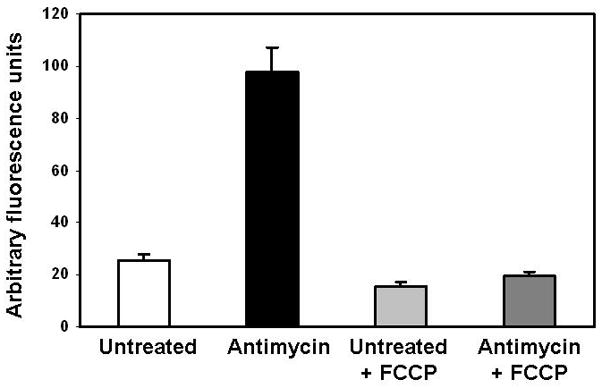
Freshly isolated liver mitochondria were suspended at a concentration of 0.5 mg/mL and incubated with 2 μM H2DCFDA for 60 min in the presence of 0.2 mM succinate. Identical flasks were set-up in the presence of antimycin with and without FCCP. The flasks containing the mitochondrial suspension are sealed and aerated with 21% O2 throughout the incubation. After 60 min, the mitochondrial suspensions are transferred to fluorometric cuvettes and the excitation/emission of DCF was read at 488/525 nm, respectively. Note that antimycin, a respiratory inhibitor of Complex III, stimulates ROS production whereas dissipation of the mitochondrial membrane potential with FCCP attenuates ROS production in mitochondria incubated with and without antimycin.
COMMENTARY
Background Information
While many of the causative factors of hepatotoxicity have been identified, the molecular mechanisms responsible for the development of liver disease following toxicant exposure remain poorly defined. A leading hypothesis for the pathogenesis of alcoholic, nonalcoholic (obesity/diabetes), and toxicant mediated liver disease is the “multi-hit” hypothesis. The “first-hit” typically involves the abnormal accumulation of fat in hepatocytes (i.e., steatosis) due to disrupted lipid metabolism and (adipo)cytokine networks followed by “second-hits”, which may involve oxidative/nitrative stress resulting from increased mitochondrial production of reactive oxygen/nitrogen species (ROS and RNS) (Mantena et al. 2008). It is these so-called “second-hits” that initiate the inflammatory and fibrogenic responses leading to development of steatohepatitis and fibrosis/cirrhosis. Moreover, hepatocyte cell death following compromised mitochondrial bioenergetics and a dramatic drop in cellular ATP is critical to liver disease progression (Jou et al. 2008). Based on this, the mitochondrion is proposed to play an essential role in severe liver disease with mitochondrial damage, decreased ATP production, and excess ROS/RNS production accompanying and contributing to pathology (Bailey 2003).
Due to the preponderance of evidence linking mitochondrial damage and dysfunction to hepatotoxicity and liver pathology from multiple insults, diseases, and toxicants, a series of well-established methodologies are presented to help laboratories begin to explore the role of the mitochondrion in their investigations. It should be pointed out that this is obviously not an all inclusive list as there are many, many different approaches and techniques not described in this article that can be applied to successfully study mitochondria in the context of hepatotoxicity. Indeed, this article is simply a starting point for novices.
One important starting point for most laboratories should be assessment of the respiratory capacity of isolated mitochondria using classic respirometry approaches as described in Alternate Protocol 1. While a somewhat “old-fashioned” method, taking a bioenergetic approach to understanding how mitochondrial function is altered is extremely powerful and can provide important insight in how toxicant exposure impacts mitochondrial function. For example, identifying a decrease in state 3 respiration (i.e., ADP-dependent) is important in that it suggests that toxicant exposure has caused a decrease in the rate at which mitochondria synthesize ATP via oxidative phosphorylation. This could be related to damage or changes in the activities of the respiratory complexes. Moreover, if state 4 respiration (i.e., ADP-independent) is increased by toxicant exposure this would indicate that mitochondria are unable to conserve the proton (H+) gradient across the inner membrane that is generated as a consequence of electron transport. In this situation, mitochondria are less well coupled (i.e., uncoupled) with the efficiency of ATP synthesis negatively impacted. This is significant as this may increase susceptibility of hepatocytes to necrosis when increased ATP levels are needed acutely under oxidative, toxicant, or metabolic stress situations.
Clearly, demonstrating altered respiration function carries significant weight when linking mitochondrial defects to disease pathogenesis. If there is no overt alteration in respiratory function it may be more difficult to support the role of mitochondria in the disease process. If respiration changes are observed, the next step in characterizing changes in mitochondrial function would be to assess the activities of each of the respiratory complexes using complex specific spectrophotometric (Darley-Usmar et al. 1987) and/or in-gel activity assays (Wittig et al. 2007). This is an important next step as a defect in overall respiratory capacity may be due to a lesion in only one of the respiratory complexes. Moreover, characterizing respiratory function is critical as electron transport underpins the ability of mitochondria to accumulate calcium and produce ROS as both these processes are dependent on the presence of a high mitochondrial membrane potential (i.e., ΔΨ).
Disturbances in the function of the respiratory chain are also likely to be associated with increased ROS production and oxidative damage to the liver. During electron transfer, electrons can “leak” from Complexes I and III and be passed one at a time to molecular oxygen to form low amounts of superoxide anion (O2•−), which subsequently is converted to hydrogen peroxide (H2O2) via action of manganese superoxide dismutase (MnSOD). Possible mechanisms for increased mitochondrial ROS include molecular alterations in Complexes I and III that essentially block or inhibit the transfer of electrons along the respiratory chain. These overly reduced complexes then transfer electrons to oxygen to increase ROS, which can initiate a cycle of more lipid peroxidation, posttranslational protein modification, mitochondrial damage, and further ROS production.
Mitochondria are also important regulators of cellular calcium homeostasis by taking up calcium via a uniporter protein located in the inner membrane and releasing calcium under normal conditions via the Na+/Ca2+ antiporter. Mitochondrial calcium capacity is however limited and when exceeded, calcium release rapidly occurs through induction of the MPT pore. Formation of the MPT pore allows passage of small molecules (<1500 Da) into and out of mitochondria resulting in mitochondrial depolarization, swelling, and outer membrane rupture, which might contribute to the release of cytochrome c and other pro-apoptotic proteins from mitochondria. It is proposed that a critical factor enhancing the sensitivity of mitochondria following toxicant exposures to apoptotic and necrotic stimuli like ROS/RNS may be a change in mitochondrial responsiveness to calcium and ability to accumulate calcium (Lemasters et al. 2002). Therefore, assessing the ability of mitochondria to sequester calcium and determining the “calcium threshold” may be important parameters to measure especially when one is interested in ascertaining whether a toxicant enhances susceptibility to apoptotic or necrotic cell death.
One mechanism by which oxidative/nitrative stress leads to mitochondria damage and increased susceptibility to MPT is likely to involve posttranslational modification of mitochondrial proteins. Oxidative modifications to mitochondrial proteins may impair their activities leading to deficits in key mitochondrial metabolic pathways. A number of irreversible, as well as reversible, modifications to cysteine residues are known to occur upon interaction of the free sulfhydryl group (P-SH) with various ROS/RNS and reactive lipids (Cooper et al. 2002). Each of these thiol modifications has the potential of eliciting unique biological responses that could disrupt mitochondrial function in response to toxicant exposures. For example, studies show that ROS promote formation of the MPT pore presumably through the oxidation of critical thiols in the adenine nucleotide translocator; one of three proteins involved in pore formation (McStay et al. 2002). Moreover, a new aspect of mitochondrial function is the role it plays in signal transduction, especially those cellular signaling pathways that regulate how the cell responds to oxidative and metabolic stress (Gutierrez et al. 2006). This suggests that mitochondrial dysfunction may disrupt critical cellular signaling pathways and contribute to the pathophysiology of liver disease from alcohol, drugs, and other environmental toxicants. Therefore, the ability to detect, identify, and functionally characterize mitochondrial proteins that may be susceptible to oxidative modification is critical to understanding the molecular mechanisms that contribute to oxidant damage and mitochondrial dysfunction from toxicant exposures. The key posttranslational modification discussed in this article is protein thiol modification. Because alterations in the redox state of protein thiols regulate mitochondrial functions such as respiration and oxidant production, identification of those proteins with altered thiol groups will increase our understanding of hepatotoxic mechanisms.
In conclusion, while the presence of these posttranslational modifications in proteins predicts that the structure and/or function of a protein may be altered, the key finding for researchers is still whether there is a change in protein activity. Therefore, functional assays should be performed, if available, for those proteins identified as containing posttranslational modifications. It is only when a direct link between a functional change and posttranslational modification is demonstrated that the posttranslational modification can be stringently tied to mitochondrial toxicity and disease.
Critical Parameters and Troubleshooting
There are several critical experimental parameters and steps that must be adhered to ensure successful outcomes when working with mitochondria. First, it is important that harvesting of liver tissue is done quickly and that liver is immediately placed in ice-cold isolation buffer. Indeed, it is essential for liver and mitochondria to be kept cold at all stages in the isolation process; therefore, it is highly recommended that homogenization and wash step are conducted in a cold room kept at 4°C and that isolation buffer is ice-cold as well. If a cold room is not available, all reagents and mitochondrial suspensions must be kept on ice. Second, care should be taken to optimize homogenization and washing steps as too harsh of a treatment of liver and mitochondria will result in damaged mitochondria that are uncoupled and have poor respiratory capacity. For example, polytron-mediated homogenization is too “rough” for isolation of coupled functional mitochondria from soft liver tissue. If mitochondria have low RCR due to low state 3 or high state 4 respiration, steps need to be taken to optimize isolation procedure. Note that harsh treatment typically results in high state 4 respiration, which is indicative of damaged inner membrane and leakage of H+’s across the inner membrane, i.e., uncoupled mitochondria. Third, the sucrose-containing isolation buffer can be made ahead of time in large batches. However, if this is done, please make sure to autoclave buffers with storage at 4°C as bacteria and other microorganisms can grow in this sucrose-containing solution. Please discard all unused buffer remaining at the end of each mitochondrial preparation (i.e. do not save leftover buffer). Remember that protease inhibitors are added to isolation buffer on the day of experiment to prevent protein degradation. This is important for proteomic experiments. Fourth, it is important that glutamate/malate-dependent respiration be performed before succinate-dependent respiration as rotenone will “poison” the Teflon membrane of the oxygen electrode. Rotenone will leach back into solution in the chamber and thereby inhibit Complex I-mediated respiration with glutamate/malate. Also, remember to rinse the oxygen electrode chamber 3X with 70% ethanol before performing succinate-mediated measurements. Fifth, after all experiments are done extra mitochondria should be saved for activity assays, western blots, proteomics, etc…For this, we typically save mitochondria as 1.0 mg pellets by centrifuging mitochondria at 13,500×g for 10 min (4°C), removing supernatant, and placing in minus 80 freezer.
Anticipated Results
Details regarding anticipated results and interpretation of data are included within the description of each Protocol. In addition, we have included a representative example of data output (Figures 1–5) for each experimental protocol with specific details regarding methodology provided within the figure legends. As a supplement to this information, a brief synopsis of anticipated results will be briefly summarized here with some additional comments provided to help readers establish these methods in their laboratories.
To monitor changes in the mitochondrial protein thiol proteome, we have presented in this article a thiol-labeling or “tagging” approach that can be used in combination with 1D and 2D gel electrophoresis techniques. Specifically, we present the “BIAM approach” that was developed by Rhee and colleagues to identify protein cysteinyl groups susceptible to oxidative modification by H2O2 and other oxidizing species (Kim et al. 2000). BIAM reacts with and covalently labels reduced, unmodified cysteines but not cysteines that have been oxidized or modified by ROS/RNS or reactive lipids. As shown in Figure 1 and 2, these representative data from both in vitro and in vivo studies illustrate the power and feasibility of the BIAM technique to detect and possibly identify mitochondrial proteins containing oxidized thiols in response to toxicant exposures. Indeed, using this method in combination with 2D proteomics we found that the thiol content of HMG-CoA synthase, the key regulatory protein of ketogenesis, was significantly decreased following acetaminophen exposure and that this modification decreased enzyme activity (Andringa et al. 2008). Presented here (Figure 2) is data showing a significant loss in the liver mitochondrial protein thiol proteome in animals co-exposed to alcohol and environmental tobacco smoke. Importantly, the use of the biotin-tag for labeling thiols has the added advantage that it can be used to quantify the degree of incorporation of the BIAM into a specific protein band or spot on 2D gels and used to calculate the amount of protein thiols lost due to oxidation or modification (Landar et al. 2006). It is also important to note that other types of amino acid modifications may also alter mitochondrial physiology such as carbonylation and nitration, as well as electrophilic lipid adduction, e.g. 4-hydroxynonenal (Radi 2004). One important thing to note about these experiments is that it is critical to always include a duplicate (i.e., companion) gel with each blot that can be stained for total protein. While this is important for analysis, the protein stained gel is also critical to show that toxicant treatment doesn’t result in massive protein degradation and loss, which will hinder ones ability to properly interpret the results. It is also important to make sure that only those blots with signal intensities below signal saturation are used for analyses to ensure linearity of responses. This is especially significant when using super-sensitive enhanced chemiluminescence reagents to visualize proteins on blots. Therefore, it is recommended that imaging instruments are used that can detect saturation of signal intensities of protein bands or spots versus simple film developers.
With regards to mitochondrial preparations, one should expect to yield approximately 20–30 mg of mitochondria protein per one gram of rat or mouse liver. One rat liver weighing 10–15 g will provide sufficient mitochondrial protein to perform all assays described within this chapter whereas multiple mouse livers will need to be collected and pooled to get enough protein to perform functional assays described. Related to this, is that the amount of total mitochondrial isolated per g liver should be recorded as differences in yields between control and experimental groups may provide insight into whether toxicant exposure has effects on mitochondrial biogenesis. State 3 and 4 respiratory rates for rat liver mitochondria using glutamate/malate as the oxidizable substrate typically average 0.08–0.12 and 0.015–0.025 μg atom O/min/mg protein, respectively, whereas succinate-driven rates for state 3 and 4 respiration are slightly higher, and average 0.15–0.25 and 0.03–0.05 μg atom O/min/mg protein, respectively. Respiration rates in mice liver mitochondria are usually higher due to higher metabolic rate and increased respiratory complex protein per total mitochondrial protein.
While there are multiple methods and fluorescent-based probes used for measuring cellular and mitochondrial calcium accumulation, we have found the CaG5N compound is easy to use and of low cost for most laboratories as standard spectrofluorometers or fluorescence-based plate readers are used compared to more expensive microscopy set-ups. As mentioned earlier and shown in Figure 4, CaG5N measures extra-mitochondrial calcium continuously. In experiments, nmol aliquots of calcium are added sequentially to energized mitochondria until MPT pore induction, which results in release of calcium (i.e., rapid rise in CaG5N fluorescence) at the end of the experimental run. Initial calcium aliquots lead to a transient rise in extra-mitochondrial calcium followed by a rapid return to baseline fluorescence as calcium is taken up by mitochondria (see arrows). Using this type of approach, one can determine the calcium threshold before MPT pore induction as one indicator of mitochondrial vulnerability to cell death. For example, if MPT pore induction and rapid release of calcium is triggered by less calcium (i.e., fewer additions) in toxicant-exposed mitochondria compared to untreated control mitochondria this illustrates that the toxicant has increased the susceptibility of mitochondria to calcium “overload”, which increases vulnerability to MPT and ultimately cell death. Investigations focused on toxicant-mediated changes in mitochondrial calcium handling can be extended to include an examination of changes in levels of the proteins speculated to comprise the MPT pore, as well as those implicated in mitochondrial outer membrane permeabilization.
The method described for measuring ROS production – “the DCF assay” – is a fairly simple and straightforward method to begin to look at ROS production in mitochondria and in cells. The level of sensitivity of this assay is high and can detect pmol to nmol levels of ROS per mg mitochondrial protein. H2DCFDA is cell and mitochondrial permeable and after uptake it becomes “trapped” inside after cleavage of the esters groups by esterases (H2DCF). In the presence of a variety of ROS/RNS it is then oxidized to a fluorescent product, DCF (Figure 5). However, there are multiple caveats to this method that must be considered. For example, H2DCFDA is a relatively non-specific indicator of ROS as it can react with H2O2, peroxynitrite (ONOO−), and lipid hydroperoxides (Dikalov et al. 2007). In addition, oxidation of H2DCF and DCF can occur in the presence of peroxidases and iron (Tampo et al. 2003). Based on this and other concerns, care should be taken when using this fluorescent-based probe for ROS production with more specific methods used to follow-up on preliminary studies implicating mitochondrial ROS. Please refer to (Tarpey and Fridovich 2001; Dikalov et al. 2007) for additional insight regarding the utility of the DCF assay and other measurements of ROS.
Time considerations
It is important to reiterate that mitochondria once isolated from cells and tissues have a limited “shelf-life”. Most mitochondrial preparations only remain viable, i.e., maintain high respiratory capacity, for 2–3 hr; therefore, it is important that all assays and experiments are completed within this timeframe to ensure accurate and reliable data collection. To maximize data collection during this limited time frame, it is recommended that a “team” approach is taken for experiments with each laboratory member trained to perform 1–2 assays versus having one person trying to performing all measurements. This “team” approach is essential for maximizing data collection from long-term animal studies or other types of studies that are expensive and time-consuming to set-up.
Also, note that calcium accumulation experiments are also time-consuming with each run taking up to 15–30 min depending on calcium concentration used. For example, use of lower amounts of calcium per addition (10 or 20 nmol) will take a longer time to induce the MPT than higher amounts of calcium per addition (50 or 100 nmol). Moreover, experiments done in the presence of cyclosporin A (inhibitor or MPT) will also prolong MPT induction. Based on these considerations, it is critical that time is taken to plan experiments accordingly so that calcium accumulation studies can begin as soon as the protein concentration of the final mitochondrial suspension is determined. Careful planning will help to ensure maximal data collection before mitochondria lose functionality. When mitochondria lose functionality, they become much more sensitive to calcium and will undergo MPT with fewer calcium additions. These same time constraints also hold true for mitochondrial ROS measurements and respiration measurements. Again, all functional measurements must begin as soon after the isolation procedure is completed to ensure best quality and reproducible results.
Acknowledgments
This work was supported in part by NIH grants AA15172, AA18841, and DK73775 to S.M. Bailey.
Literature Cited
- Andringa K, King A, Bailey S. Blue native-gel electrophoresis proteomics. Methods Mol Biol. 2009;519:241–58. doi: 10.1007/978-1-59745-281-6_15. [DOI] [PubMed] [Google Scholar]
- Andringa KK, Bajt ML, Jaeschke H, Bailey SM. Mitochondrial protein thiol modifications in acetaminophen hepatotoxicity: effect on HMG-CoA synthase. Toxicol Lett. 2008;177(3):188–97. doi: 10.1016/j.toxlet.2008.01.010. [DOI] [PMC free article] [PubMed] [Google Scholar]
- Bailey SM. A review of the role of reactive oxygen and nitrogen species in alcohol-induced mitochondrial dysfunction. Free Radical Research. 2003;37:585–596. doi: 10.1080/1071576031000091711. [DOI] [PubMed] [Google Scholar]
- Bailey SM, Andringa KK, Landar A, Darley-Usmar VM. Proteomic approaches to identify and characterize alterations to the mitochondrial proteome in alcoholic liver disease. Methods Mol Biol. 2008;447:369–80. doi: 10.1007/978-1-59745-242-7_24. [DOI] [PMC free article] [PubMed] [Google Scholar]
- Bailey SM, Cunningham CC. Acute and chronic ethanol increases reactive oxygen species generation and decreases viability in fresh, isolated rat hepatocytes. Hepatology. 1998;28:1318–1326. doi: 10.1002/hep.510280521. [DOI] [PubMed] [Google Scholar]
- Bailey SM, Mantena SK, Millender-Swain T, Cakir Y, Jhala NC, Chhieng D, Pinkerton KE, Ballinger SW. Ethanol and tobacco smoke increase hepatic steatosis and hypoxia in the hypercholesterolemic apoE−/− mouse: implications for a “multi-hit” hypothesis of fatty liver disease. Free Radic Biol Med. 2009;46:928–938. doi: 10.1016/j.freeradbiomed.2009.01.003. [DOI] [PMC free article] [PubMed] [Google Scholar]
- Cooper CE, Patel RP, Brookes PS, Darley-Usmar VM. Nanotransducers in cellular redox signaling: modification of thiols by reactive oxygen and nitrogen species. Trends Biochem Sci. 2002;27(10):489–92. doi: 10.1016/s0968-0004(02)02191-6. [DOI] [PubMed] [Google Scholar]
- Darley-Usmar VM, Capaldi RA, Takamiya S, Millet F, Wilson MT, Malatesta F, Sarti P. In: Mitochondria: a practical approach. Darley-Usmar VM, Rickwood D, Wilson MT, editors. Oxford: IRL; 1987. pp. 113–152. [Google Scholar]
- Dikalov S, Griendling KK, Harrison DG. Measurement of reactive oxygen species in cardiovascular studies. Hypertension. 2007;49(4):717–27. doi: 10.1161/01.HYP.0000258594.87211.6b. [DOI] [PMC free article] [PubMed] [Google Scholar]
- Gutierrez J, Ballinger SW, Darley-Usmar VM, Landar A. Free radicals, mitochondria, and oxidized lipids: the emerging role in signal transduction in vascular cells. Circ Res. 2006;99(9):924–32. doi: 10.1161/01.RES.0000248212.86638.e9. [DOI] [PubMed] [Google Scholar]
- Jou J, Choi SS, Diehl AM. Mechanisms of disease progression in nonalcoholic fatty liver disease. Semin Liver Dis. 2008;28(4):370–9. doi: 10.1055/s-0028-1091981. [DOI] [PubMed] [Google Scholar]
- Kim JR, Yoon HW, Kwon KS, Lee SR, Rhee SG. Identification of proteins containing cysteine residues that are sensitive to oxidation by hydrogen peroxide at neutral pH. Anal Biochem. 2000;283(2):214–21. doi: 10.1006/abio.2000.4623. [DOI] [PubMed] [Google Scholar]
- Landar A, Oh JY, Giles NM, Isom A, Kirk M, Barnes S, Darley-Usmar VM. A sensitive method for the quantitative measurement of protein thiol modification in response to oxidative stress. Free Radic Biol Med. 2006;40(3):459–68. doi: 10.1016/j.freeradbiomed.2005.08.046. [DOI] [PubMed] [Google Scholar]
- Lemasters JJ, Qian T, He L, Kim JS, Elmore SP, Cascio WE, Brenner DA. Role of mitochondrial inner membrane permeabilization in necrotic cell death, apoptosis, and autophagy. Antioxid Redox Signal. 2002;4(5):769–81. doi: 10.1089/152308602760598918. [DOI] [PubMed] [Google Scholar]
- Mantena SK, King AL, Andringa KK, Eccleston HB, Bailey SM. Mitochondrial dysfunction and oxidative stress in the pathogenesis of alcohol- and obesity-induced fatty liver diseases. Free Radic Biol Med. 2008;44(7):1259–72. doi: 10.1016/j.freeradbiomed.2007.12.029. [DOI] [PMC free article] [PubMed] [Google Scholar]
- McStay GP, Clarke SJ, Halestrap AP. Role of critical thiol groups on the matrix surface of the adenine nucleotide translocase in the mechanism of the mitochondrial permeability transition pore. Biochem J. 2002;367(Pt 2):541–8. doi: 10.1042/BJ20011672. [DOI] [PMC free article] [PubMed] [Google Scholar]
- Radi R. Nitric oxide, oxidants, and protein tyrosine nitration. Proc Natl Acad Sci U S A. 2004;101(12):4003–8. doi: 10.1073/pnas.0307446101. [DOI] [PMC free article] [PubMed] [Google Scholar]
- Tampo Y, Kotamraju S, Chitambar CR, Kalivendi SV, Keszler A, Joseph J, Kalyanaraman B. Oxidative stress-induced iron signaling is responsible for peroxide-dependent oxidation of dichlorodihydrofluorescein in endothelial cells: role of transferrin receptor-dependent iron uptake in apoptosis. Circ Res. 2003;92(1):56–63. doi: 10.1161/01.res.0000048195.15637.ac. [DOI] [PubMed] [Google Scholar]
- Tarpey MM, Fridovich I. Methods of detection of vascular reactive species: nitric oxide, superoxide, hydrogen peroxide, and peroxynitrite. Circ Res. 2001;89(3):224–36. doi: 10.1161/hh1501.094365. [DOI] [PubMed] [Google Scholar]
- Venkatraman A, Landar A, Davis AJ, Ulasova E, Page G, Murphy MP, Darley-Usmar V, Bailey SM. Oxidative modification of hepatic mitochondria protein thiols: effect of chronic alcohol consumption. Am J Physiol Gastrointest Liver Physiol. 2004;286(4):G521–G527. doi: 10.1152/ajpgi.00399.2003. [DOI] [PubMed] [Google Scholar]
- Wittig I, Carrozzo R, Santorelli FM, Schagger H. Functional assays in high-resolution clear native gels to quantify mitochondrial complexes in human biopsies and cell lines. Electrophoresis. 2007;28(21):3811–20. doi: 10.1002/elps.200700367. [DOI] [PubMed] [Google Scholar]
- Young TA, Cunningham CC, Bailey SM. Reactive oxygen species production by the mitochondrial respiratory chain in isolated rat hepatocytes and liver mitochondria: studies using myxothiazol. Arch Biochem Biophys. 2002;405(1):65–72. doi: 10.1016/s0003-9861(02)00338-7. [DOI] [PubMed] [Google Scholar]