Abstract
Annexin A1 is a multi functional molecule which is involved in inflammation, innate and adaptive immune systems, tumor progression and metastasis. We have previously showed the impaired tumor growth, metastasis, angiogenesis and wound healing in annexin A1 knockout mice. While tumor is a piece of heterogeneous mass including not only malignant tumor cells but also the stroma, the importance of the tumor stroma for tumor progression and metastasis is becoming increasingly clear. The tumor stroma is comprised by various components including extracellular matrix and non-malignant cells in the tumor, such as endothelial cells, fibroblasts, immune cells, inflammatory cells. Based on our previous finding of pro-angiogenic functions for annexin A1 in vascular endothelial cell sprouting, wound healing, tumor growth and metastasis, and the previously known properties for annexin A1 in immune cells and inflammation, this study hypothesized that annexin A1 is a key functional player in tumor development, linking the various components in tumor stroma by its actions in endothelial cells and immune cells. Using systems analysis programs commercially available, this paper further compared the gene expression between tumors from annexin A1 wild type mice and annexin A1 knockout mice and found a list of genes that significantly changed in the tumor stroma that lacked annexin A1. This revealed annexin A1 to be an effective regulator in tumor stroma and suggested a mechanism that annexin A1 affects tumor development and metastasis through interaction with the various components in the microenvironment surrounding the tumor cells.
Introduction
We recently showed the pro-angiogenic functions in tumor development for annexin A1 [1] which was previously known as an inflammatory protein. Tumor growth and metastasis were significantly decreased when tumors grew in host animals unable to express annexin A1 [1]. While tumor is a piece of heterogeneous mass including not only malignant tumor cells but also the stroma, the importance of the tumor stroma for tumor progression and metastasis is becoming increasingly clear. The tumor stroma is comprised by extracellular matrix and non-malignant cells in the tumor, which include endothelial cells, fibroblasts, immune cells, inflammatory cells such as macrophages [2], [3]. Although the tumor stroma has been sought after as a therapeutic target, the mechanisms for how the interaction of various components in the complex tumor stroma contributes to the tumor development are still poorly understood. Based on our recent finding of pro-angiogenic functions for annexin A1 in vascular endothelial cell sprouting, wound healing, and tumor growth and metastasis [1], and the previously known properties for annexin A1 in immune cells and inflammation [4], this study hypothesized that annexin A1 is a key functional player in tumor development, linking the various components in tumor stroma by its actions in endothelial cells and immune cells. Here, we used systems biology approach to analyze the tumors in whole animal models on the background of absence or presence of annexin A1 to show the global effects of annexin A1 on tumor stroma. It is impossible to study tumor stroma with isolated proteins, cultured cell homogenates or even whole live cells. Tumor cells in culture lack the microenvironment or the stroma provided by the body that hosts the tumor. Our whole animal models offered significant advantages over any other conditions. Of particular importance our systems based approaches provided thorough analysis and generated interesting and thought-provoking results.
Methods
Mice and Tumor Models
Annexin A1 knockout homozygous and congenic wildtype counterpart homozygous mice, tumor cell culture, B16 melanoma cell line and subcutaneous tumor model were as described previously [1]. Briefly, to grow the xenograft tumors on the mice, B16 melanoma cells were grown in continuous culture for no more than 3 consecutive passages, the actively growing cells were then trypsinized (0.25% trypsin/1 mM Na-EDTA; Gibco/BRL), resuspended in DMEM (Dulbecco modified Eagle medium), counted, and injected subcutaneously into the right flanks of the mice at 5×10⁶ cells in 200 µL DMEM for each mouse. The B16 cell line was an established cell line and was obtained and used in Dr. Schnitzer's lab in Sidney Kimmel Cancer Center and Proteogenomics Research Institute for Systems Medicine, San Diego, California, United States of America, and the B16 cell line related work was previously published [1].
Systems Analysis and Gene Microarray
The GeneChip mouse genome 430 2.0 array (Affymetrix) was used to analyze tumors from annexin A1 knockout or wildtype mice as described previously [1]. The dataset containing genes that are differentially expressed in the tumors from annexin A1 knockout mice and wildtype mice was analyzed using Genomatix software (Genomatix Software) and Gene Ontology database [5] and IPA software (Ingenuity Systems).
Study Approval. This study was approved by Sidney Kimmel Cancer Center and Proteogenomics Research Institute for Systems Medicine, San Diego, California, United States of America.
Results
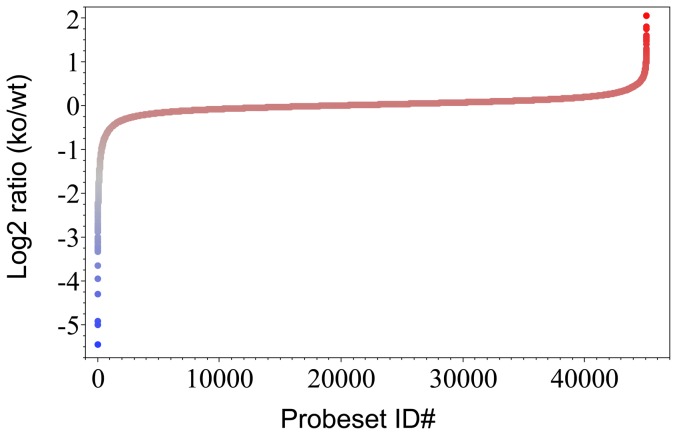
The tumors were grown in both annexin A1 null and wild type mice using B16 melanoma cells as described previously [1]. In this system, only the stroma in the tumor differs because the non-tumor cells are from the host body with or without annexin A1. From the raw data obtained previously [1] using mouse whole genome microarrays to run tumor samples from annexin A1 knockout and wildtype mice, this study performed thorough systems analysis. The gene expression levels in the whole tumors from annexin A1 knockout and wildtype mice were analyzed to obtain differential expression profiling (Fig. 1). For each gene probe in the mouse genome, the expression levels of the gene probe in tumors from annexin A1 null mice (ko) and from annexin A1 wild-type mice (wt) were compared and expressed as ratio of ko over wt, which reflects from three independent repeat experiments. In tumors from annexin A1 null mice, those genes with highest values were over-expressed (red colored region in Fig. 1) while those genes with lowest values were under-expressed (blue colored region in Fig. 1). The majority of the genome was expressed at similar extent in tumors from annexin A1 null and wild-type mice with the expression ratio values approaching one or the logarithm of the expression ratio values close to zero (Fig. 1). Total about 1000 genes with either highest or lowest ratio values were identified as significantly changed genes in the tumors.
Figure 1. Gene differential expression profile of tumors from annexin A1 knockout and wild type mice.
B16 melanoma cells were implanted in annexin A1 knockout and wild type mice to grow up tumors. Whole tumors were analyzed using mouse whole genome microarray, in which for each gene, one or more than one probeset(s) were spotted for the gene. For each probeset on the microarray, the difference in gene expression between tumors from annexin A1 knockout mice and from wild type mice was expressed as log 2 ratio of the gene expression level in annexin A1 knockout (ko) over the gene expression level in wild type (wt).
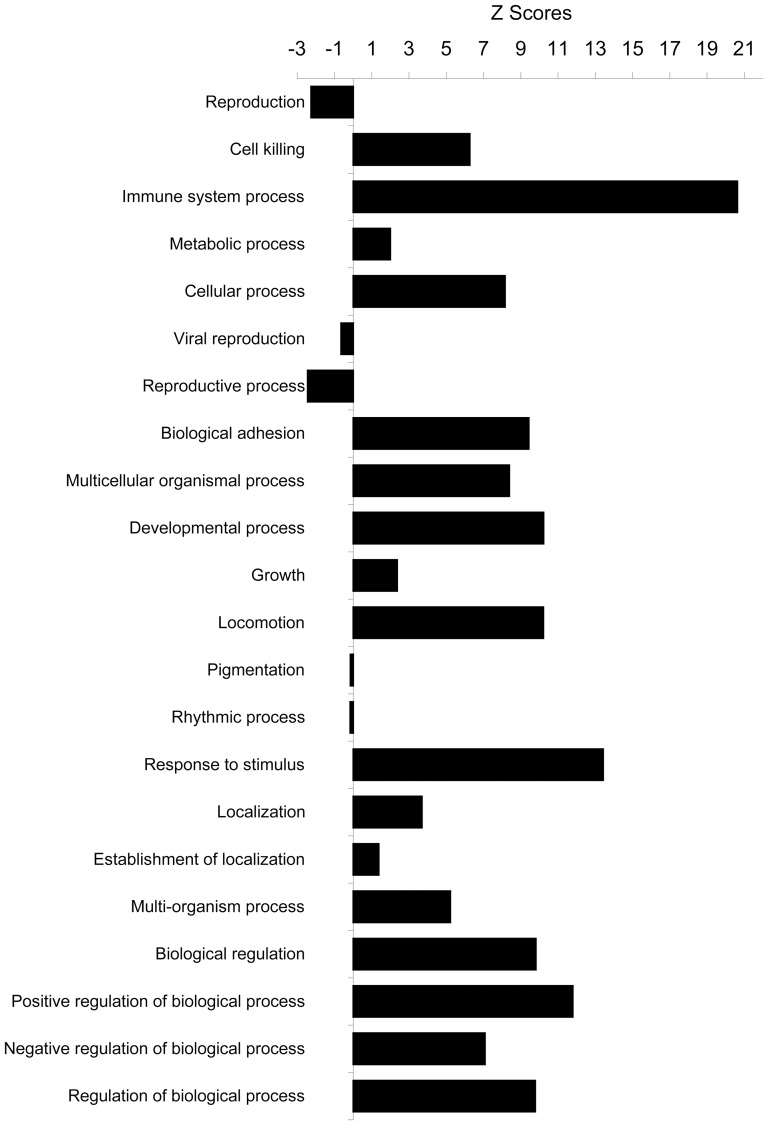
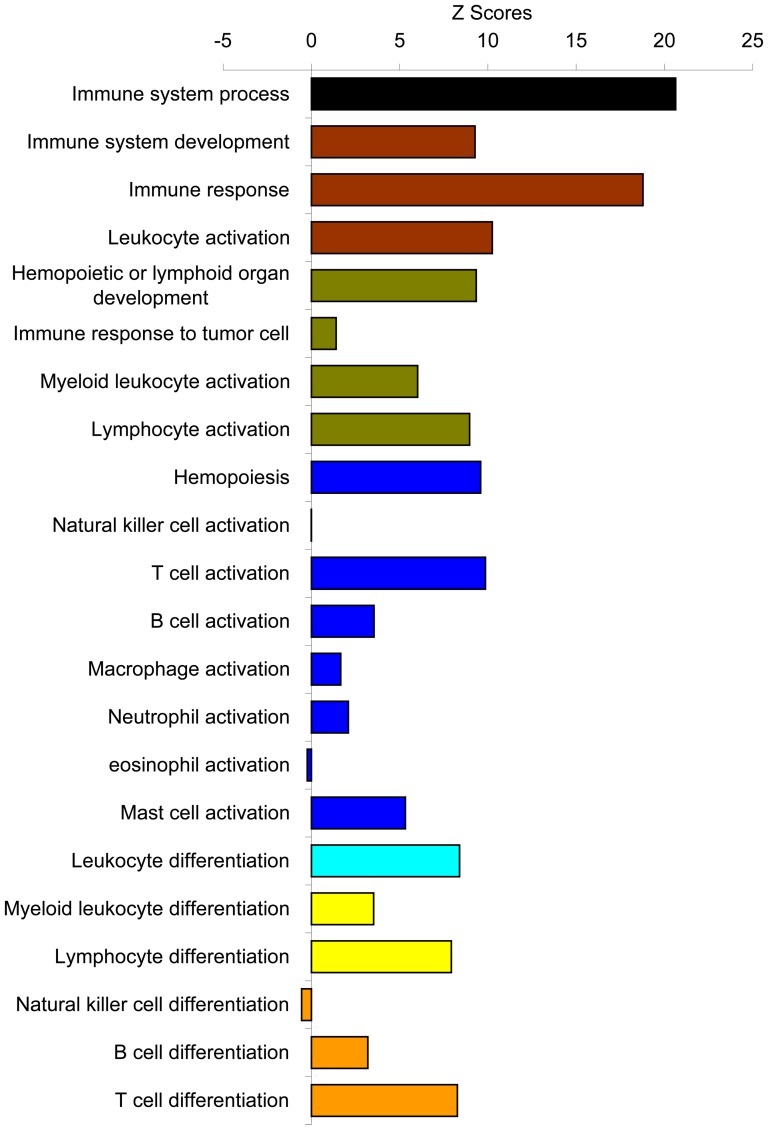
We then analyzed this list of significantly changed genes/proteins in a systems biology approach with Genomatix and IPA software to reveal the functional connection with annexin A1. The data were examined in terms of biological processes category, which are the Gene Ontology (GO) structured networks of defined terms to describe gene product attributes. The data were statistically analyzed and expressed as the z-score of a term to check for over- or under- represented groups of genes. Integrated statistical rating allows for the identification and selection of clusters of functionally related genes. All the biological processes in the GO database were obtained from top of the hierarchial tree to further mining down of subcategories of each branch levels by levels. The top most general biological processes are shown with their z-scores (Fig. 2). Interestingly, most of the biological processes were positively enriched, suggesting that annexin A1 may act as a global regulator which affects many biological processes and some of these processes may balance each other to result in minimum changes, which could contribute to the annexin A1 knockout mice appearing normal overall. The z-score of a term shows whether a certain gene, or group of genes, is over- or under-represented in the set of the genes being analyzed. Among the total 22 categories, the immune system process was most significantly over-represented (z-score, 20.63). This indicates that a group of genes, which are functionally related to immune system, were over-represented in the list of the differentially expressed genes identified above. This is consistent with the previously known functions of annexin A1 in immune system [4], thus the other genes related to immune system changed their expression levels in the tumors grown in the host microenvironment where annexin A1 was knocked out. Breakdown of this immune system process into its subcategories is shown in detail with the biological processes down levels by levels (Fig.S1) and shown in summary with representative biological processes (Fig. 3). The process of immune response to tumor cell was not much different between tumors in annexin A1 ko and wild-type conditions, consistent with our notion that it was the tumor stroma that made the tumor development significantly different in annexin A1 negative condition. Among the immune cells that were present in tumor stroma, T cell related processes stood out, which is consistent with the recently identified effects of annexin A1 on T cell functions [6].
Figure 2. Biological process.
The list of significantly changed genes was analyzed with Genomatix software and examined in terms of biological processes in Gene Ontology database and expressed as the Z score of a term for each biological process within the category. The higher value of Z score means more genes in that function of biological process were affected in this experiment, thus this biological process was over-represented. The Z scores for all the biological processes in top most general level of Gene Ontology structural networks of hierarchial tree of categories of biological process were shown here.
Figure 3. Immune system process.
Mining down in Gene Ontology structural networks of hierarchial tree of categories of biological process, from top most general biological processes in Figure 2, the most over-represented immune system process was further mining down levels by levels into its subcategories with all biological processes in each level shown in Figure S1 and from each level, the over-represented biological processes are summarized here. Each color represents each level in the order from top to bottom as mining down the levels from top level of the hierarchial tree in the immune system process.
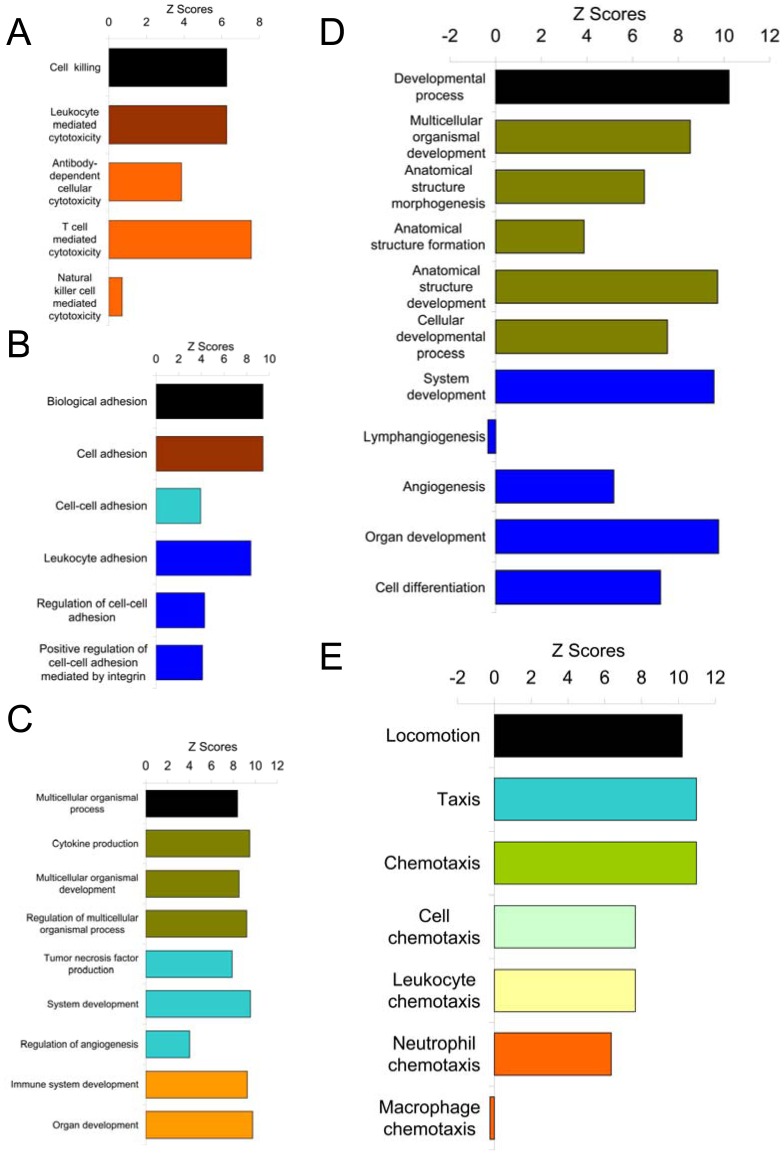
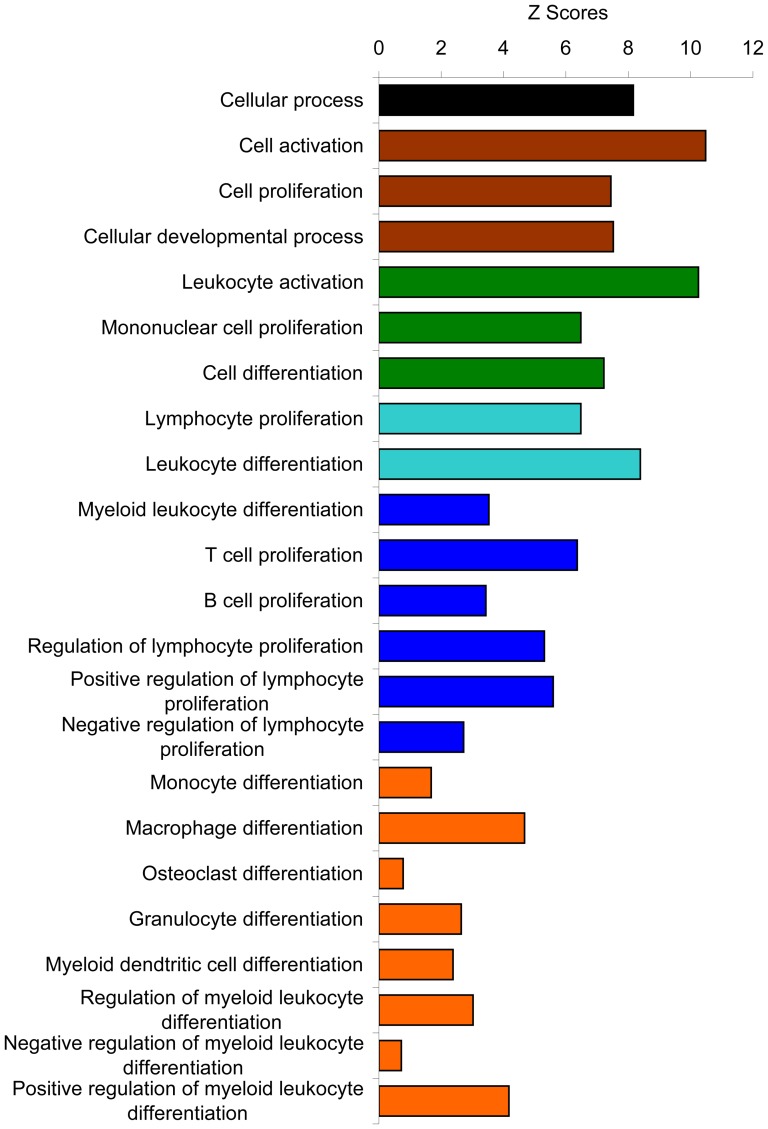
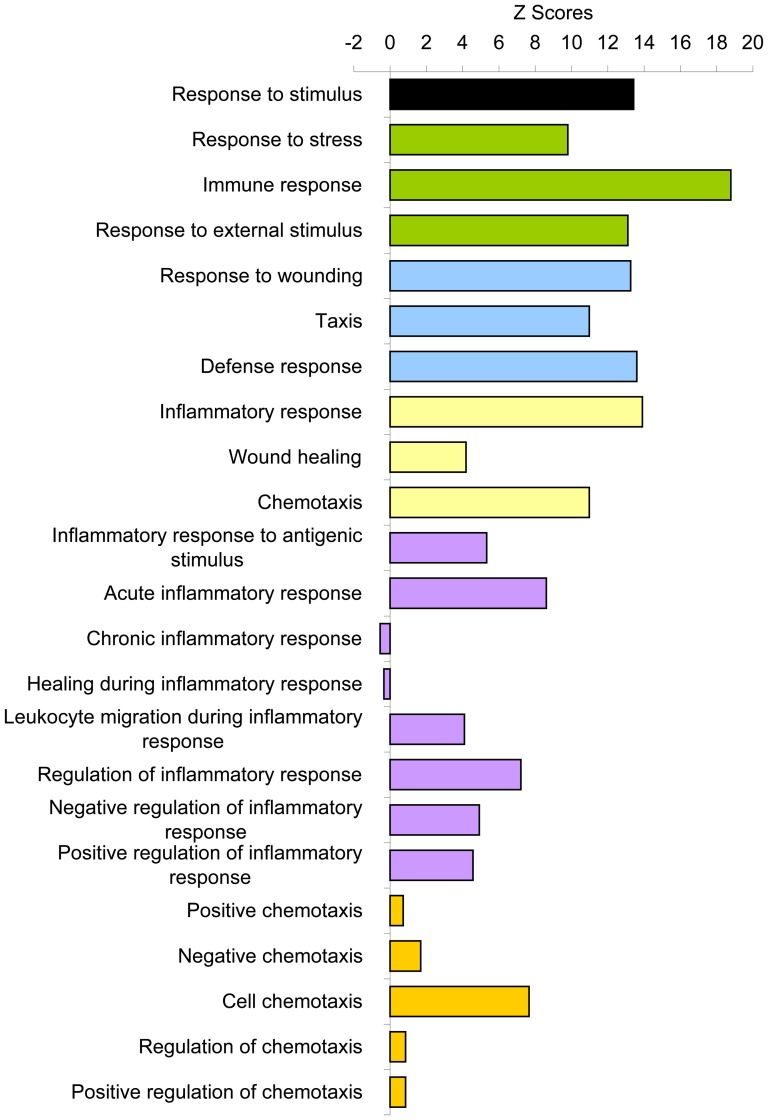
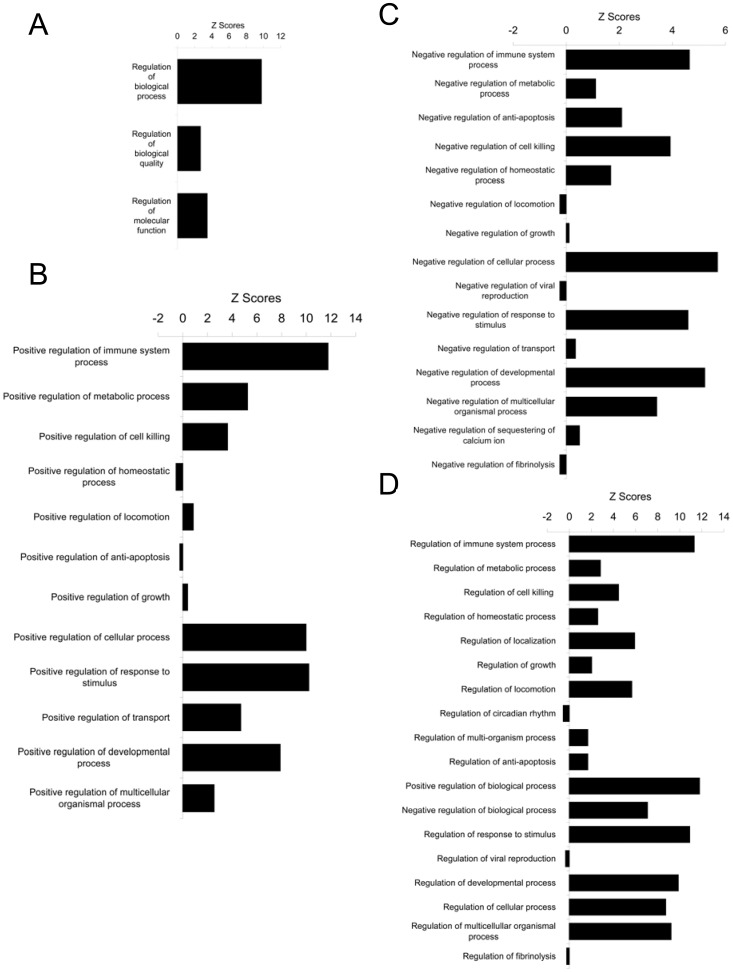
Besides immune system process, other significantly over-represented general biological processes include cell killing, cellular process, biological adhesion, multicellular organismal process, developmental process, locomotion, response to stimulus, biological regulation, positive regulation of biological process, negative regulation of biological process, and regulation of biological process (Fig. 2). All of these processes were further mined down to their subcategories and the summary of the analyses were shown (Figs. 4, 5, 6, and 7) with the detailed analyses for each subcategory shown in supplementary information section (Figs.S2, S3, S4, S5, S6, S7, and S8). Mining down in the cell killing process (Fig. 4A), again, the category T cell mediated cytotoxicity was over-represented. Further highlighting the involvement of the immune, inflammatory components in the tumor stroma, the cellular process brought out the enriched process of macrophage differentiation (Fig. 5). Biological adhesion process (Fig. 4B) showed an over-representation of leukocyte adhesion, in line with the interaction between extracellular matrix and infiltrated non-tumor cells in tumor stroma. The process of tumor necrosis factor production was over-represented (Fig. 4C), consistent with our previous findings of increased necrosis in tumors grown in annexin A1 null mice [1], the change in tumor necrosis factor production may contribute to the amount of necrosis in tumors. As shown previously [1], angiogenesis was over-represented (Fig. 4D), the process involving endothelial cells in tumor stroma. The locomotion process (Fig. 4E) indicated an over-representation of leukocyte chemotaxis and neutrophil chemotaxis, both processes involving immune cells in tumor stroma. Again in the response to stimulus process (Fig. 6), the categories related to inflammatory response were significantly over-represented. It is noteworthy that the acute inflammatory response was also over-represented but not the chronic inflammatory response. Finally, biological processes related to regulation (Fig. 7), with overlapping subcategories showed a general over-representation of regulation for those over-represented biological processes discussed above. The positive regulation of biological process was more over-represented than the negative regulation of biological process.
Figure 4. General biological processes other than immune system process.
(A) Cell killing. (B) Biological adhesion. (C) Multicellular organismal process. (D) Developmental process. (E) Locomotion. Similarly as Figure 3, the most general processes were further mining down levels by levels into its subcategories with all biological processes in each level shown in Figures S2, S3, S4, S5, and S6 and from each level, the over-represented biological processes are summarized here. Each color represents each level in the order from top to bottom as mining down the levels from top level of the hierarchial tree in these biological processes.
Figure 5. Cellular process.
Similarly, from Figure 2, the cellular process was further mining down levels by levels into its subcategories with all biological processes in each level shown in Figure S7 and from each level, the over-represented biological processes are summarized here. Each color represents each level in the order from top to bottom as mining down the levels from top level of the hierarchial tree in the cellular process.
Figure 6. Response to stimulus.
From Figure 2, the response to stimulus process was further mining down levels by levels into its subcategories with all biological processes in each level shown in Figure S8 and from each level, the over-represented biological processes are summarized here. Each color represents each level in the order from top to bottom as mining down the levels from top level of the hierarchial tree in the response to stimulus process.
Figure 7. General biological processes other than immune system process.
(A) Biological regulation. (B) Positive regulation of biological process. (C) Negative regulation of biological process. (D) Regulation of biological process. From Figure 2, these biological processes were further mining down into their subcategories.
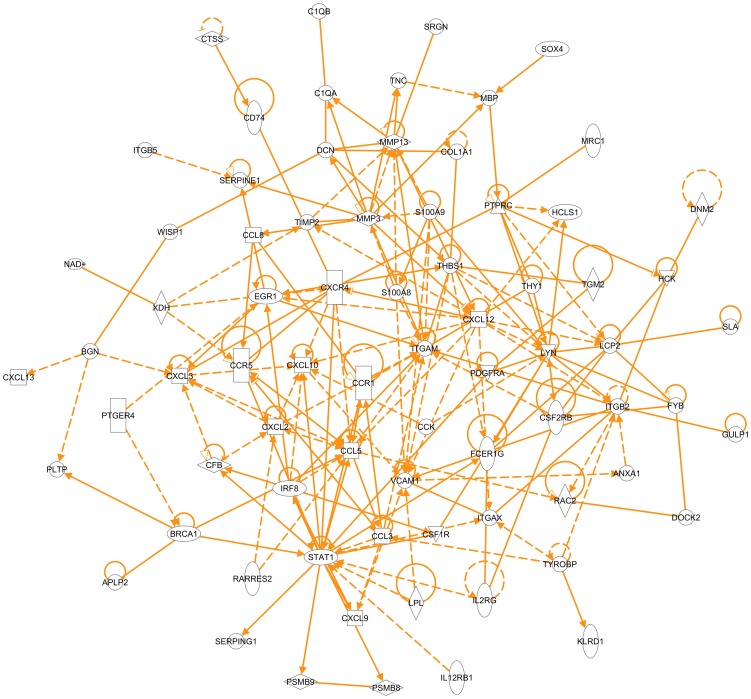
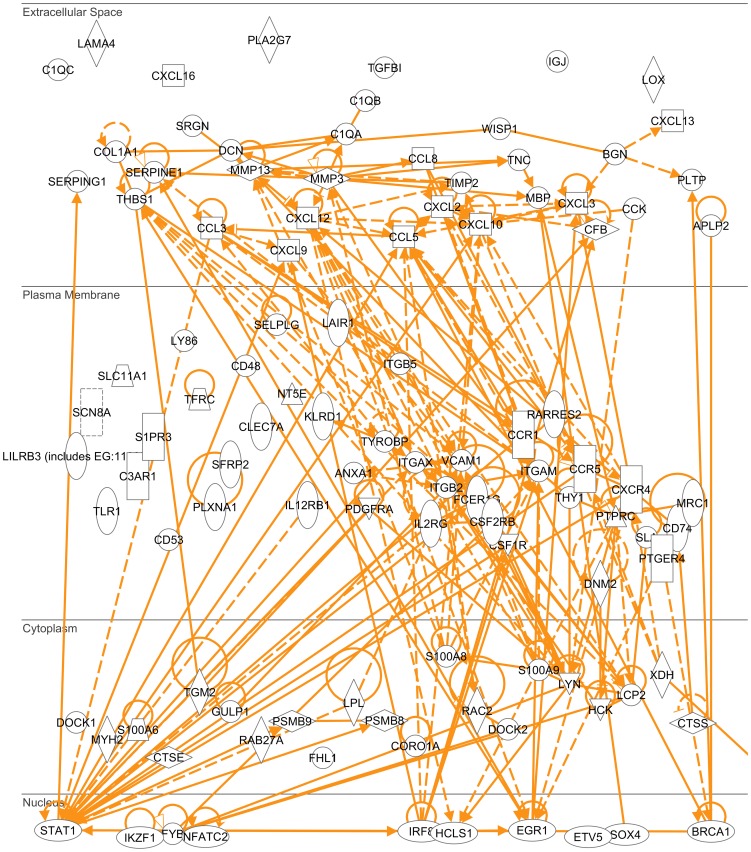
Furthermore, we identified the molecules that were responsible for those over-represented biological processes to reveal an interactome in tumor stroma with annexin A1 being a key functional player. Using Genomatix and IPA software, we obtained lists of biological processes or functions with a list of molecules in each process or function. We combined the lists of molecules from the processes or functions that involve various components in tumor stroma to generate the list of molecules that comprises the tumor stroma interactome which interacts with annexin A1 (Table 1). These molecules showed most significant changes, either most down-regulated (log2 (ko/wt)<−0.999), or most up-regulated (log2 (ko/wt)>0.956), in the tumor stroma that lacked annexin A1. Based on the current literature data so far, most of the molecules on this list formed an interaction network built by IPA software (Fig. 8), of which, the interaction between annexin A1 and integrin beta 2 and the interaction between annexin A1 and vascular cell adhesion molecule 1 were identified based on current data. This interaction may occur in cell plasma membrane (Fig. 9). The expression ratio of integrin beta 2 in tumors from annexin A1 ko versus wt was 0.378 (Table 1), so the integrin beta 2 was down-regulated in the absence of annexin A1; and the vascular cell adhesion molecule 1 was even down-regulated (ratio of ko versus wt was 0.214).
Table 1. Tumor Stroma Interactome for Annexin A1.
| Gene Symbol | Gene Name/Gene Title | Entrez Gene | ko/wt |
| Igh-6 | immunoglobulin heavy chain 6 (heavy chain of IgM) | 16019 | 0.065 |
| Tgfbi | transforming growth factor, beta induced | 21810 | 0.108 |
| H2-Eb1 | histocompatibility 2, class II antigen E beta | 14969 | 0.124 |
| Cd74 | CD74 antigen (invariant polypeptide of major histocompatibility complex, class II antigen-associated) | 16149 | 0.143 |
| Ptprc | protein tyrosine phosphatase, receptor type, C | 19264 | 0.143 |
| Mmp13 | matrix metallopeptidase 13 | 17386 | 0.147 |
| Pla2g7 | phospholipase A2, group VII (platelet-activating factor acetylhydrolase, plasma) | 27226 | 0.164 |
| H2-Aa | histocompatibility 2, class II antigen A, alpha | 14960 | 0.169 |
| Cxcl13 | chemokine (C-X-C motif) ligand 13 | 55985 | 0.170 |
| H2-Ab1 | histocompatibility 2, class II antigen A, beta 1 | 14961 | 0.199 |
| Fpr-rs2 | formyl peptide receptor, related sequence 2 | 14289 | 0.203 |
| Mmp3 | matrix metallopeptidase 3 | 17392 | 0.206 |
| Sfrp2 | secreted frizzled-related protein 2 | 20319 | 0.206 |
| Vcam1 | vascular cell adhesion molecule 1 | 22329 | 0.214 |
| Tgm2 | transglutaminase 2, C polypeptide | 21817 | 0.227 |
| H2-Q7 | histocompatibility 2, Q region locus 7 | 100044020 | 0.227 |
| Ly6a | lymphocyte antigen 6 complex, locus A | 110454 | 0.230 |
| Ly86 | lymphocyte antigen 86 | 17084 | 0.234 |
| Igj | immunoglobulin joining chain | 16069 | 0.237 |
| Fcgr1 | Fc receptor, IgG, high affinity I | 14129 | 0.238 |
| H2-DMa | histocompatibility 2, class II, locus DMa | 14998 | 0.241 |
| C1qb | complement component 1, q subcomponent, beta polypeptide | 12260 | 0.244 |
| C1qc | complement component 1, q subcomponent, C chain | 12262 | 0.250 |
| Hck | hemopoietic cell kinase | 15162 | 0.256 |
| Saa3 | serum amyloid A 3 | 20210 | 0.257 |
| Bcl2a1d | B-cell leukemia/lymphoma 2 related protein A1d | 12047 | 0.258 |
| Bcl2a1a | B-cell leukemia/lymphoma 2 related protein A1a | 12044 | 0.258 |
| Ccr5 | chemokine (C-C motif) receptor 5 | 12774 | 0.261 |
| Col1a1 | procollagen, type I, alpha 1 | 12842 | 0.268 |
| Cxcl16 | chemokine (C-X-C motif) ligand 16 | 66102 | 0.271 |
| Il2rg | interleukin 2 receptor, gamma chain | 16186 | 0.281 |
| C1qa | complement component 1, q subcomponent, alpha polypeptide | 12259 | 0.288 |
| Cxcl9 | chemokine (C-X-C motif) ligand 9 | 17329 | 0.290 |
| Ccl8 | chemokine (C-C motif) ligand 8 | 100048554 | 0.290 |
| Lpl | lipoprotein lipase | 16956 | 0.291 |
| Klra17 | killer cell lectin-like receptor, subfamily A, member 17 | 170733 | 0.291 |
| Egr1 | early growth response 1 | 13653 | 0.296 |
| Csf1r | colony stimulating factor 1 receptor | 12978 | 0.297 |
| Ctss | cathepsin S | 13040 | 0.300 |
| Itgax | integrin alpha X | 16411 | 0.301 |
| Coro1a | coronin, actin binding protein 1A | 12721 | 0.301 |
| Clec7a | C-type lectin domain family 7, member a | 56644 | 0.301 |
| Fcer1g | Fc receptor, IgE, high affinity I, gamma polypeptide | 14127 | 0.308 |
| Lcp2 | lymphocyte cytosolic protein 2 | 16822 | 0.311 |
| Tnc | tenascin C | 21923 | 0.319 |
| Irf8 | interferon regulatory factor 8 | 15900 | 0.319 |
| Srgn | serglycin | 19073 | 0.322 |
| Serpina3n | serine (or cysteine) peptidase inhibitor, clade A, member 3N | 20716 | 0.325 |
| Tyrobp | TYRO protein tyrosine kinase binding protein | 22177 | 0.327 |
| Ccl3 | chemokine (C-C motif) ligand 3 | 20302 | 0.336 |
| Cd53 | CD53 antigen | 12508 | 0.342 |
| Cd48 | CD48 antigen | 12506 | 0.346 |
| Fyb | FYN binding protein | 23880 | 0.352 |
| Ccl5 | chemokine (C-C motif) ligand 5 | 20304 | 0.357 |
| Fcgr3 | Fc receptor, IgG, low affinity III | 14131 | 0.365 |
| Lox | lysyl oxidase | 16948 | 0.365 |
| Cxcl3 | chemokinne (C-X-C motif) ligand 3 | 330122 | 0.369 |
| C3ar1 | complement component 3a receptor 1 | 12267 | 0.369 |
| Slc11a1 | solute carrier family 11 (proton-coupled divalent metal ion transporters), member 1 | 18173 | 0.374 |
| Cxcr4 | chemokine (C-X-C motif) receptor 4 | 12767 | 0.377 |
| Thbs1 | thrombospondin 1 | 640441 | 0.378 |
| Itgb2 | integrin beta 2 | 16414 | 0.378 |
| Serping1 | serine (or cysteine) peptidase inhibitor, clade G, member 1 | 12258 | 0.381 |
| Cd24a | CD24a antigen | 12484 | 0.382 |
| Itgam | integrin alpha M | 16409 | 0.386 |
| Pdgfra | platelet derived growth factor receptor, alpha polypeptide | 18595 | 0.392 |
| Cxcl2 | chemokine (C-X-C motif) ligand 2 | 20310 | 0.392 |
| Il12rb1 | interleukin 12 receptor, beta 1 | 16161 | 0.397 |
| Hba-a2 | hemoglobin alpha, adult chain 2 | 15122 | 0.407 |
| Hba-a1 | hemoglobin alpha, adult chain 1 | 110257 | 0.407 |
| Serpine1 | serine (or cysteine) peptidase inhibitor, clade E, member 1 | 18787 | 0.412 |
| Ikzf1 | IKAROS family zinc finger 1 | 22778 | 0.412 |
| C3 | complement component 3 | 12266 | 0.414 |
| Dcn | decorin | 13179 | 0.415 |
| S100a6 | S100 calcium binding protein A6 (calcyclin) | 20200 | 0.429 |
| Stat1 | signal transducer and activator of transcription 1 | 20846 | 0.434 |
| Psmb8 | proteasome (prosome, macropain) subunit, beta type 8 (large multifunctional peptidase 7) | 16913 | 0.441 |
| Lair1 | leukocyte-associated Ig-like receptor 1 | 52855 | 0.442 |
| Cxcl4 | chemokine (C-X-C motif) ligand 4 | 56744 | 0.443 |
| Il2rg | interleukin 2 receptor, gamma chain | 16186 | 0.444 |
| Wisp1 | WNT1 inducible signaling pathway protein 1 | 22402 | 0.444 |
| Rarres2 | retinoic acid receptor responder (tazarotene induced) 2 | 71660 | 0.448 |
| S100a9 | S100 calcium binding protein A9 (calgranulin B) | 20202 | 0.451 |
| Hcls1 | hematopoietic cell specific Lyn substrate 1 | 15163 | 0.452 |
| Cxcl10 | chemokine (C-X-C motif) ligand 10 | 100045000 | 0.453 |
| Lyn | Yamaguchi sarcoma viral (v-yes-1) oncogene homolog | 676654 | 0.454 |
| Ccr1 | chemokine (C-C motif) receptor 1 | 12768 | 0.455 |
| Klrd1 | killer cell lectin-like receptor, subfamily D, member 1 | 16643 | 0.455 |
| Csf2rb | colony stimulating factor 2 receptor, beta, low-affinity (granulocyte-macrophage) | 12983 | 0.456 |
| Selplg | selectin, platelet (p-selectin)ligand | 20345 | 0.457 |
| Pltp | phospholipid transfer protein | 18830 | 0.457 |
| Serpina1a | serine (or cysteine) peptidase inhibitor, clade A, member 1a | 20700 | 0.459 |
| S100a8 | S100 calcium binding protein A8 (calgranulin A) | 20201 | 0.460 |
| Dock2 | dedicator of cyto-kinesis 2 | 94176 | 0.462 |
| Itgb5 | integrin beta 5 | 16419 | 0.462 |
| Thy1 | thymus cell antigen 1, theta | 21838 | 0.465 |
| Tlr1 | toll-like receptor 1 | 21897 | 0.466 |
| H2-T23 | histocompatibility 2, T region locus 23 | 100044190 | 0.474 |
| Edg3 | endothelial differentiation, sphingolipid G-protein-coupled receptor, 3 | 13610 | 0.476 |
| Lilrb3 | leukocyte immunoglobulin-like receptor, subfamily B (with TM and ITIM domains), member 3 | 100044531 | 0.478 |
| Ctse | cathepsin E | 13034 | 0.479 |
| Xdh | xanthine dehydrogenase | 22436 | 0.483 |
| Etv5 | ets variant gene 5 | 104156 | 0.484 |
| Nt5Ee | 5′ nucleotidase, ecto | 23959 | 0.484 |
| SaSh3 | SAM and SH3 domain containing 3 | 74131 | 0.489 |
| Ptger4 | prostaglandin E receptor 4 (subtype EP4) | 19219 | 0.491 |
| Sla | src-like adaptor | 20491 | 0.492 |
| Bgn | biglycan | 12111 | 0.494 |
| Psmb9 | proteasome (prosome, macropain) subunit, beta type 9 (large multifunctional peptidase 2) | 16912 | 0.495 |
| Cfb | complement factor B | 14962 | 0.497 |
| Rac2 | RAS-related C3 botulinum substrate 2 | 19354 | 0.499 |
| Mrc1 | mannose receptor, C type 1 | 17533 | 0.500 |
| Cxcl12 | chemokine (C-X-C motif) ligand 12 | 20315 | 0.500 |
| Dnm2 | dynamin 2 | 13430 | 1.906 |
| Brca1 | breast cancer 1 | 12189 | 1.917 |
| Dock1 | dedicator of cyto-kinesis 1 | 330662 | 1.922 |
| Sox4 | SRY-box containing gene 4 | 20677 | 1.940 |
| Myh2 | myosin, heavy polypeptide 2, skeletal muscle, adult | 17882 | 1.963 |
| Nfatc2 | nuclear factor of activated T-cells, cytoplasmic, calcineurin-dependent 2 | 18019 | 1.981 |
| Mbp | myelin basic protein | 17196 | 1.986 |
| Scn8a | sodium channel, voltage-gated, type VIII, alpha | 20273 | 2.019 |
| Lama4 | laminin, alpha 4 | 16775 | 2.021 |
| Rab27a | RAB27A, member RAS oncogene family | 11891 | 2.025 |
| Plxna1 | plexin A1 | 18844 | 2.031 |
| Fhl1 | four and a half LIM domains 1 | 14199 | 2.077 |
| Aplp2 | amyloid beta (A4) precursor-like protein 2 | 11804 | 2.113 |
| Gulp1 | GULP, engulfment adaptor PTB domain containing 1 | 70676 | 2.222 |
| Timp2 | tissue inhibitor of metalloproteinase 2 | 21858 | 2.224 |
| Tfrc | transferrin receptor | 22042 | 2.967 |
| Cck | cholecystokinin | 12424 | 3.347 |
Figure 8. Tumor stroma interactome.
The interaction network for most of the molecules on the list in Table 1 was built by IPA software (Ingenuity company).
Figure 9. Tumor stroma interactome sub-cellular location.
The sub-cellular distribution of the molecules on the interaction network (Figure 8) was built by IPA software (Ingenuity company).
While the tumor cells were originally same before being implanted into annexin A1 ko and wt mice, therefore, the tumor stroma in annexin A1 ko and wt mice exhibited significant differences in the gene expression profiles between the host body with and without annexin A1, although the genes in tumor cells may change their expression levels due to the interaction between tumor cells and the tumor stroma. Annexin A1 is abundant in neutrophils, monocytes, macrophages in wild type animal models [4]. In the annexin A1 null animal model, these non-tumor cells infiltrated into tumor stroma do not express annexin A1, this lack of annexin A1 protein function reflected as the gene expression level changes of several other proteins. This network of changes indicated these important genes/proteins (Table 1) that are interacting with annexin A1 directly or indirectly. The interaction of annexin A1 with these proteins was previously unknown.
Discussion
Through systems biology analysis, we found this list of genes (Table 1) that significantly changed in the tumor stroma that lacked annexin A1. This showed a mechanism that annexin A1 affects tumor development and metastasis through interaction with the various components in the microenvironment surrounding the tumor cells. Literature has also showed that these genes are associated with tumor and/or tumor stroma: IGH-6 (ko/wt = 0.065) with thymic lymphoma and lymphoblastic leukemia [7]–[8], TGFBI (ko/wt = 0.108) with neuroblastoma, lung carcinoma, ovarian and prostate cancers, renal, gastrointestinal and brain tumors, colon cancer [9]–[14], PTPRC (ko/wt = 0.143) with human breast tumor stroma [15], MMP13 (ko/wt = 0.147) with skin tumor stroma [16], CCK (ko/wt = 3.347) with human pancreatic cancer [17], TFRC (ko/wt = 2.967) with colon cancer, human esophageal squamous cell carcinoma, human brain tumors, mouse mammary adenocarcinoma and rodent liver tumor [18]–[22], TIMP2 (ko/wt = 2.224) with human colorectal cancer, human pancreatic carcinoma, human renal cell carcinoma and human squamous cervical carcinoma [23]–[26], BRCA1 (ko/wt = 1.917) with human breast tumor stroma [27].
It is worth noting that TGFBI, as an extracellular matrix protein, has been reported differently either as a tumor suppressor [12], [28] or over-expressed in tumors [13]–[14]. TGFBI was shown to promote metastasis by acting on tumor stroma [14]. Here we showed that TGFBI was under-expressed in tumors from annexin A1 ko mice. In tumors grown on annexin A1 ko mice, the metastasis was reduced [1]. Thus, it suggests that annexin A1 interacts with or otherwise affects TGFBI and this interaction affects the metastatic ability of tumors. In addition, loss of TGFBI can induce resistance to chemotherapeutic agent paclitaxel in ovarian cancer cells [29], while human tumor cells with over-expressed levels of TGFBI showed an increased sensitivity to etoposide, paclitaxel, cisplatin and gemcitabine [10]. Similarly, stroma-derived annexin A1 has been shown to play a role in γ-irradiation-induced T-cell lymphoblastic lymphoma development, with annexin A1 being a candidate resistance gene against γ-radiation exposure [30]. It has been reviewed that the cellular and non-cellular components of the tumor microenvironment contribute to the chemoresistance [31]. Therefore, annexin A1 and TGFBI may be further studied together to elicit a mechanism for drug resistance. Annexin A1 and TGFBI could be important therapy targets to manipulate to improve the efficacy of radio-and chemo-therapies for cancer patients, to reduce resistance to treatments and decrease recurrence of cancer.
Protein tyrosine phosphatase gene expression was shown to be up-regulated in stromal fibroblasts from human breast tumors [15], while our study showed PTPRC down-regulated in tumor stroma without annexin A1 (Table 1), this suggests that inhibiting annexin A1 may disrupt tumor stroma to hamper tumor progression via decreasing expression level of protein tyrosine phosphatase. MMP13 was shown to promote angiogenesis [16], which is consistent with the finding in this study of down-regulated MMP13 expression (Table 1) and impaired tumor growth and angiogenesis in tumors on annexin A1 knockout mice [1].
The role of endogenous cholecystokinin (CCK) in human pancreatic cancer is not clear. The pancreatic cancer cells produced both CCK and gastrin, however the CCK level was lower than the gastrin. It seemed gastrin played a more dominant role than CCK in stimulating tumor growth. While down-regulation of gastrin inhibited growth of pancreatic tumor, change in the CCK level did not affect the tumor growth [17]. Here we showed a huge increase of CCK mRNA expression in tumors from annexin A1 ko mice, the further study of interaction of annexin A1 and CCK will shed light on understanding the role of CCK in human cancers.
Also, this study showed a possible interaction between annexin A1 and BRCA1. It has been shown that in the breast cancers containing mutated BRCA1, a common breast cancer susceptibility gene, changes in the tumor stroma facilitate the malignant transformation of the tumor cells [32]. BRCA1 is also believed to be a regulator in mammary stem cell differentiation and associated with cancer stem cells. One of the identified markers for selection of human stem cells and cancer stem cells is aldehyde dehydrogenase 1 (ALDH1), however, the exact function of ALDH1 in stem cells is still mostly unknown. ALDH1 expression is significantly increased in both tumor cells and tumor stroma in breast cancers carrying BRCA1 mutations [33]. The cancer stem cells possess tumor initiating capacity and therapy resistance. Therefore, consistent with the above mentioned annexin A1 being candidate resistance gene, an association between annexin A1 and stem cells and cancer stem cells is strongly possible and worth further investigation to help understand the exact functions of stem cell markers.
Supporting Information
Breakdown of immune system process category into its subcategories. (A) Immune system process. (B1) Immune response. (B2) Leukocyte activation. (B3) Immune system development. (C1) Lymphocyte activation. (C2) Myeloid leukocyte activation. (C3) Regulation of leukocyte activation. (C4) Hemopoietic or lymphoid organ development. (D) Hemopoiesis. (E) Leukocyte differentiation. (F) Lymphocyte differentiation. Mining down in Gene Ontology structural networks of hierarchial tree of categories of biological process, the top level category, immune system process, labeled (A), was further mining down levels by levels into its subcategories with all biological processes in each category shown here, labeled alphabetically with each letter for each down level and for each level, representative categories were further broken down into all its subcategories shown here.
(PPT)
Breakdown of cell killing category into its subcategories. (A) Cell killing. (B) Leukocyte mediated cytotoxicity. (C) T cell mediated cytotoxicity. (D) Regulation of T cell mediated cytotoxicity. Similarly as Figure S1, the top level category, cell killing, labeled (A), was further mining down levels by levels into its subcategories labeled alphabetically with each letter for each down level and for each level, representative categories were further broken down into all its subcategories shown here.
(PPT)
Breakdown of biological adhesion category into its subcategories. (A) Biological adhesion. (B) Cell adhesion. (C1) Cell-cell adhesion. (C2) Cell-substrate adhesion. (C3) Regulation of cell adhesion. (C4) Positive regulation of cell adhesion. (C5) Negative regulation of cell adhesion. (D1) Leukocyte adhesion. (D2) Regulation of cell-substrate adhesion. (D3) Regulation of cell-cell adhesion. (D4) Regulation of cell adhesion mediated by integrin. (E1) Positive regulation of cell adhesion mediated by integrin. (E2) Regulation of cell-cell adhesion mediated by integrin. Similarly as Figure S1, the top level category, biological adhesion, labeled (A), was further mining down levels by levels into its subcategories labeled alphabetically with each letter for each down level and for each level, representative categories were further broken down into all its subcategories shown here.
(PPT)
Breakdown of multicellular organismal process category into its subcategories. (A) Multicellular organismal process. (B1) Cytokine production. (B2) System process. (B3) Multicellular organismal development. (B4) Tissue remodeling. (B5) Multicellular organismal homeostasis. (B6) Regulation of body fluid levels. (B7) Regulation of multicellular organismal process. (C1) Tumor necrosis factor production. (C2) System development. (C3) Negative regulation of tissue remodeling. (C4) Regulation of tissue remodeling. (C5) Regulation of angiogenesis. (D) Regulation of tumor necrosis factor production. (E) Regulation of tumor necrosis factor biosynthetic process. Similarly as Figure S1, the top level category, multicellular organismal process, labeled (A), was further mining down levels by levels into its subcategories labeled alphabetically with each letter for each down level and for each level, representative categories were further broken down into all its subcategories shown here.
(PPT)
Breakdown of developmental process category into its subcategories. (A) Developmental process. (B1) Multicellular organismal development. (B2) Anatomical structure morphogenesis. (B3) Anatomical structure formation. (B4) Anatomical structure development. (B5) Cellular developmental process. (B6) Regulation of developmental process. (B7) Negative regulation of developmental process. (B8) Positive regulation of developmental process. (C) Positive regulation of programmed cell death. (D1) Induction of programmed cell death. (D2) Positive Regulation of apoptosis. (E1) Induction of apoptosis. (E2) Positive regulation of lymphocyte apoptosis. (F1) Induction of apoptosis by extracellular signals. (F2) Induction of apoptosis by intracellular signals. Similarly as Figure S1, the top level category, developmental process, labeled (A), was further mining down levels by levels into its subcategories labeled alphabetically with each letter for each down level and for each level, representative categories were further broken down into all its subcategories shown here.
(PPT)
Breakdown of locomotion category into its subcategories. (A) Locomotion. (B1) Taxis. (B2) Regulation of locomotion. (B3) Cell motility. (C) Chemotaxis. (D) Cell chemotaxis. (E) Leukocyte chemotaxis. Similarly as Figure S1, the top level category, locomotion, labeled (A), was further mining down levels by levels into its subcategories labeled alphabetically with each letter for each down level and for each level, representative categories were further broken down into all its subcategories shown here.
(PPT)
Breakdown of cellular process category into its subcategories. (A) Cellular process. (B1) Cell activation. (B2) Cell motion. (B3) Cell communication. (B4) Cell adhesion. (B5) Cell proliferation. (B6) Cellular component organization. (B7) Cellular developmental process. (C1) Mononuclear cell proliferation. (C2) Cell differentiation. (D1) Lymphocyte proliferation. (D2) Leukocyte differentiation. (E) Myeloid leukocyte differentiation. Similarly as Figure S1, the top level category, cellular process, labeled (A), was further mining down levels by levels into its subcategories labeled alphabetically with each letter for each down level and for each level, representative categories were further broken down into all its subcategories shown here.
(PPT)
Breakdown of response to stimulus category into its subcategories. (A) Response to stimulus. (B1) Response to external stimulus. (B2) Response to stress. (C1) Defense response. (C2) Response to wounding. (C3) Taxis. (D1) Inflammatory response. (D2) Chemotaxis. (E) Acute inflammatory response. (F) Activation of plasma proteins during acute inflammatory response. (G) Complement activation. Similarly as Figure S1, the top level category, response to stimulus, labeled (A), was further mining down levels by levels into its subcategories labeled alphabetically with each letter for each down level and for each level, representative categories were further broken down into all its subcategories shown here.
(PPT)
Acknowledgments
I would like to thank the two commercial companies Genomatix Software and Ingenuity Systems for providing me access to use their programs in analyzing my data.
Funding Statement
The author has no support or funding to report.
References
- 1. Yi M, Schnitzer JE (2009) Impaired tumor growth, metastasis, angiogenesis and wound healing in annexin A1-null mice. Proc Natl Acad Sci U S A 106: 17886–17891. [DOI] [PMC free article] [PubMed] [Google Scholar]
- 2. Hiscox S, Barrett-Lee P, Nicholson RI (2011) Therapeutic targeting of tumor-stroma interactions. Expert Opin Ther Targets 15: 609–621. [DOI] [PubMed] [Google Scholar]
- 3. Ahmed F, Steele JC, Herbert JM, Steven NM, Bicknell R (2008) Tumor stroma as a target in cancer. Curr Cancer Drug Targets 8: 447–453. [DOI] [PubMed] [Google Scholar]
- 4. Perretti M, D'Acquisto F (2009) Annexin A1 and glucocorticoids as effectors of the resolution of inflammation. Nat Rev Immunol 9: 62–0. [DOI] [PubMed] [Google Scholar]
- 5. Ashburner M, Ball CA, Blake JA, Botstein D, Butler H, et al. (2000) Gene ontology: tool for the unification of biology. The Gene Ontology Consortium. Nat Genet 25: 25–29. [DOI] [PMC free article] [PubMed] [Google Scholar]
- 6. D'Acquisto F, Paschalidis N, Sampaio AL, Merghani A, Flower RJ, et al. (2007) Impaired T cell activation and increased Th2 lineage commitment in Annexin-1-deficient T cells. Eur J Immunol 37: 3131–3142. [DOI] [PubMed] [Google Scholar]
- 7. Shin SC, Kang YM, Kim HS (2010) Life span and thymic lymphoma incidence in high- and low-dose-rate irradiated AKR/J mice and commonly expressed genes. Radiat Res 174: 341–346. [DOI] [PubMed] [Google Scholar]
- 8. Nakao M, Janssen JW, Flohr T, Bartram CR (2000) Rapid and reliable quantification of minimal residual disease in acute lymphoblastic leukemia using rearranged immunoglobulin and T-cell receptor loci by LightCycler technology. Cancer Res 60: 3281–3289. [PubMed] [Google Scholar]
- 9. Carén H, Djos A, Nethander M, Sjöberg RM, Kogner P, et al. (2011) Identification of epigenetically regulated genes that predict patient outcome in neuroblastoma. BMC Cancer 11: 66. [DOI] [PMC free article] [PubMed] [Google Scholar]
- 10. Irigoyen M, Pajares MJ, Agorreta J, Ponz-Sarvisé M, Salvo E, et al. (2010) TGFBI expression is associated with a better response to chemotherapy in NSCLC. Mol Cancer 9: 130. [DOI] [PMC free article] [PubMed] [Google Scholar]
- 11. Kang S, Dong SM, Park NH (2010) Frequent promoter hypermethylation of TGFBI in epithelial ovarian cancer. Gynecol Oncol 118: 58–63. [DOI] [PubMed] [Google Scholar]
- 12. Shah JN, Shao G, Hei TK, Zhao Y (2008) Methylation screening of the TGFBI promoter in human lung and prostate cancer by methylation-specific PCR. BMC Cancer 8: 284. [DOI] [PMC free article] [PubMed] [Google Scholar]
- 13. Ivanov SV, Ivanova AV, Salnikow K, Timofeeva O, Subramaniam M, et al. (2008) Two novel VHL targets, TGFBI (BIGH3) and its transactivator KLF10, are up-regulated in renal clear cell carcinoma and other tumors. Biochem Biophys Res Commun 370: 536–540. [DOI] [PMC free article] [PubMed] [Google Scholar]
- 14. Ma C, Rong Y, Radiloff DR, Datto MB, Centeno B, et al. (2008) Extracellular matrix protein betaig-h3/TGFBI promotes metastasis of colon cancer by enhancing cell extravasation. Genes Dev 22: 308–321. [DOI] [PMC free article] [PubMed] [Google Scholar]
- 15. Singer CF, Gschwantler-Kaulich D, Fink-Retter A, Haas C, Hudelist G, et al. (2008) Differential gene expression profile in breast cancer-derived stromal fibroblasts. Breast Cancer Res Treat 110: 273–281. [DOI] [PubMed] [Google Scholar]
- 16. Lederle W, Hartenstein B, Meides A, Kunzelmann H, Werb Z, et al. (2010) MMP13 as a stromal mediator in controlling persistent angiogenesis in skin carcinoma. Carcinogenesis 31: 1175–1184. [DOI] [PMC free article] [PubMed] [Google Scholar]
- 17. Matters GL, McGovern C, Harms JF, Markovic K, Anson K, et al. (2011) Role of endogenous cholecystokinin on growth of human pancreatic cancer. Int J Oncol 38: 593–601. [DOI] [PMC free article] [PubMed] [Google Scholar]
- 18. Okazaki F, Matsunaga N, Okazaki H, Utoguchi N, Suzuki R, et al. (2010) Circadian rhythm of transferrin receptor 1 gene expression controlled by c-Myc in colon cancer-bearing mice. Cancer Res 70: 6238–6246. [DOI] [PubMed] [Google Scholar]
- 19. Wada S, Noguchi T, Takeno S, Kawahara K (2006) PIK3CA and TFRC located in 3q are new prognostic factors in esophageal squamous cell carcinoma. Ann Surg Oncol 13: 961–966. [DOI] [PubMed] [Google Scholar]
- 20. Hänninen MM, Haapasalo J, Haapasalo H, Fleming RE, Britton RS, et al. (2009) Expression of iron-related genes in human brain and brain tumors. BMC Neurosci 10: 36. [DOI] [PMC free article] [PubMed] [Google Scholar]
- 21. Jiang XP, Elliott RL, Head JF (2010) Manipulation of iron transporter genes results in the suppression of human and mouse mammary adenocarcinomas. Anticancer Res 30: 759–765. [PubMed] [Google Scholar]
- 22. Mizukami S, Ichimura R, Kemmochi S, Taniai E, Shimamoto K, et al. (2010) Induction of GST-P-positive proliferative lesions facilitating lipid peroxidation with possible involvement of transferrin receptor up-regulation and ceruloplasmin down-regulation from the early stage of liver tumor promotion in rats. Arch Toxicol 84: 319–331. [DOI] [PubMed] [Google Scholar]
- 23. Park KS, Kim SJ, Kim KH, Kim JC (2011) Clinical characteristics of TIMP2, MMP2, and MMP9 gene polymorphisms in colorectal cancer. J Gastroenterol Hepatol 26: 391–397. [DOI] [PubMed] [Google Scholar]
- 24. Bramhall SR, Neoptolemos JP, Stamp GWH, Lemoine NR (1997) Imbalance of expression of matrix metalloproteinases (MMPs) and tissue inhibitors of the matrix metalloproteinases (TIMPs) in human pancreatic carcinoma. J Pathol 182: 347–355. [DOI] [PubMed] [Google Scholar]
- 25. Bhuvarahamurthy V, Kristiansen GO, Johannsen M, Loening SA, Schnorr D, et al. (2006) In situ gene expression and localization of metalloproteinases MMP1, MMP2, MMP3, MMP9, and their inhibitors TIMP1 and TIMP2 in human renal cell carcinoma. Oncology Reports 15: 1379–1384. [PubMed] [Google Scholar]
- 26. Anne TM, Taina TH (2010) Levels of Circulating TIMP-2 and MMP2-TIMP2 Complex Are Decreased in Squamous Cervical Carcinoma. Obstet Gynecol Int 2010: 179351. [DOI] [PMC free article] [PubMed] [Google Scholar]
- 27. Weber F, Shen L, Fukino K, Patocs A, Mutter GL, et al. (2006) Total-genome analysis of BRCA1/2-related invasive carcinomas of the breast identifies tumor stroma as potential landscaper for neoplastic initiation. Am J Hum Genet 78: 961–972. [DOI] [PMC free article] [PubMed] [Google Scholar]
- 28. Zhang Y, Wen G, Shao G, Wang C, Lin C, et al. (2009) TGFBI deficiency predisposes mice to spontaneous tumor development. Cancer Res 69: 37–44. [DOI] [PMC free article] [PubMed] [Google Scholar]
- 29. Ahmed AA, Mills AD, Ibrahim AE, Temple J, Blenkiron C, et al. (2007) The extracellular matrix protein TGFBI induces microtubule stabilization and sensitizes ovarian cancers to paclitaxel. Cancer Cell 12: 514–527. [DOI] [PMC free article] [PubMed] [Google Scholar]
- 30. Santos J, González-Sánchez L, Matabuena-Deyzaguirre M, Villa-Morales M, Coza P, et al. (2009) A role for stroma-derived annexin A1 as mediator in the control of genetic susceptibility to T-cell lymphoblastic malignancies through prostaglandin E2 secretion. Cancer Res 69: 2577–2587. [DOI] [PubMed] [Google Scholar]
- 31. Sebens S, Schäfer H (2011) The tumor stroma as mediator of drug resistance - a potential target to improve cancer therapy? Curr Pharm Biotechnol 2011 May 24. [Epub ahead of print]. [DOI] [PubMed] [Google Scholar]
- 32. Weber F, Shen L, Fukino K, Patocs A, Mutter GL, et al. (2006) Total-genome analysis of BRCA1/2-related invasive carcinomas of the breast identifies tumor stroma as potential landscaper for neoplastic initiation. Am J Hum Genet 78: 961–972. [DOI] [PMC free article] [PubMed] [Google Scholar]
- 33. Heerma van Voss MR, van der Groep P, Bart J, van der Wall E, van Diest PJ (2011) Expression of the stem cell marker ALDH1 in BRCA1 related breast cancer. Cell Oncol 34: 3–10. [DOI] [PMC free article] [PubMed] [Google Scholar]
Associated Data
This section collects any data citations, data availability statements, or supplementary materials included in this article.
Supplementary Materials
Breakdown of immune system process category into its subcategories. (A) Immune system process. (B1) Immune response. (B2) Leukocyte activation. (B3) Immune system development. (C1) Lymphocyte activation. (C2) Myeloid leukocyte activation. (C3) Regulation of leukocyte activation. (C4) Hemopoietic or lymphoid organ development. (D) Hemopoiesis. (E) Leukocyte differentiation. (F) Lymphocyte differentiation. Mining down in Gene Ontology structural networks of hierarchial tree of categories of biological process, the top level category, immune system process, labeled (A), was further mining down levels by levels into its subcategories with all biological processes in each category shown here, labeled alphabetically with each letter for each down level and for each level, representative categories were further broken down into all its subcategories shown here.
(PPT)
Breakdown of cell killing category into its subcategories. (A) Cell killing. (B) Leukocyte mediated cytotoxicity. (C) T cell mediated cytotoxicity. (D) Regulation of T cell mediated cytotoxicity. Similarly as Figure S1, the top level category, cell killing, labeled (A), was further mining down levels by levels into its subcategories labeled alphabetically with each letter for each down level and for each level, representative categories were further broken down into all its subcategories shown here.
(PPT)
Breakdown of biological adhesion category into its subcategories. (A) Biological adhesion. (B) Cell adhesion. (C1) Cell-cell adhesion. (C2) Cell-substrate adhesion. (C3) Regulation of cell adhesion. (C4) Positive regulation of cell adhesion. (C5) Negative regulation of cell adhesion. (D1) Leukocyte adhesion. (D2) Regulation of cell-substrate adhesion. (D3) Regulation of cell-cell adhesion. (D4) Regulation of cell adhesion mediated by integrin. (E1) Positive regulation of cell adhesion mediated by integrin. (E2) Regulation of cell-cell adhesion mediated by integrin. Similarly as Figure S1, the top level category, biological adhesion, labeled (A), was further mining down levels by levels into its subcategories labeled alphabetically with each letter for each down level and for each level, representative categories were further broken down into all its subcategories shown here.
(PPT)
Breakdown of multicellular organismal process category into its subcategories. (A) Multicellular organismal process. (B1) Cytokine production. (B2) System process. (B3) Multicellular organismal development. (B4) Tissue remodeling. (B5) Multicellular organismal homeostasis. (B6) Regulation of body fluid levels. (B7) Regulation of multicellular organismal process. (C1) Tumor necrosis factor production. (C2) System development. (C3) Negative regulation of tissue remodeling. (C4) Regulation of tissue remodeling. (C5) Regulation of angiogenesis. (D) Regulation of tumor necrosis factor production. (E) Regulation of tumor necrosis factor biosynthetic process. Similarly as Figure S1, the top level category, multicellular organismal process, labeled (A), was further mining down levels by levels into its subcategories labeled alphabetically with each letter for each down level and for each level, representative categories were further broken down into all its subcategories shown here.
(PPT)
Breakdown of developmental process category into its subcategories. (A) Developmental process. (B1) Multicellular organismal development. (B2) Anatomical structure morphogenesis. (B3) Anatomical structure formation. (B4) Anatomical structure development. (B5) Cellular developmental process. (B6) Regulation of developmental process. (B7) Negative regulation of developmental process. (B8) Positive regulation of developmental process. (C) Positive regulation of programmed cell death. (D1) Induction of programmed cell death. (D2) Positive Regulation of apoptosis. (E1) Induction of apoptosis. (E2) Positive regulation of lymphocyte apoptosis. (F1) Induction of apoptosis by extracellular signals. (F2) Induction of apoptosis by intracellular signals. Similarly as Figure S1, the top level category, developmental process, labeled (A), was further mining down levels by levels into its subcategories labeled alphabetically with each letter for each down level and for each level, representative categories were further broken down into all its subcategories shown here.
(PPT)
Breakdown of locomotion category into its subcategories. (A) Locomotion. (B1) Taxis. (B2) Regulation of locomotion. (B3) Cell motility. (C) Chemotaxis. (D) Cell chemotaxis. (E) Leukocyte chemotaxis. Similarly as Figure S1, the top level category, locomotion, labeled (A), was further mining down levels by levels into its subcategories labeled alphabetically with each letter for each down level and for each level, representative categories were further broken down into all its subcategories shown here.
(PPT)
Breakdown of cellular process category into its subcategories. (A) Cellular process. (B1) Cell activation. (B2) Cell motion. (B3) Cell communication. (B4) Cell adhesion. (B5) Cell proliferation. (B6) Cellular component organization. (B7) Cellular developmental process. (C1) Mononuclear cell proliferation. (C2) Cell differentiation. (D1) Lymphocyte proliferation. (D2) Leukocyte differentiation. (E) Myeloid leukocyte differentiation. Similarly as Figure S1, the top level category, cellular process, labeled (A), was further mining down levels by levels into its subcategories labeled alphabetically with each letter for each down level and for each level, representative categories were further broken down into all its subcategories shown here.
(PPT)
Breakdown of response to stimulus category into its subcategories. (A) Response to stimulus. (B1) Response to external stimulus. (B2) Response to stress. (C1) Defense response. (C2) Response to wounding. (C3) Taxis. (D1) Inflammatory response. (D2) Chemotaxis. (E) Acute inflammatory response. (F) Activation of plasma proteins during acute inflammatory response. (G) Complement activation. Similarly as Figure S1, the top level category, response to stimulus, labeled (A), was further mining down levels by levels into its subcategories labeled alphabetically with each letter for each down level and for each level, representative categories were further broken down into all its subcategories shown here.
(PPT)


