Abstract
Solid-state NMR of proteins in frozen aqueous solution is a potentially powerful technique in structural biology, especially if it is combined with dynamic nuclear polarization signal enhancement strategies. One concern regarding NMR studies of frozen solution protein samples at low temperatures is that they may have poor linewidths, thus preventing high-resolution studies. To learn more about how the solvent shell composition and temperature affects the protein linewidth, we recorded 1H, 2H, and 13C spectra of ubiquitin in frozen water and frozen glycerol-water solutions at different temperatures. We found that the 13C protein linewidths generally increase with decreasing temperature. This line broadening was found to be inhomogeneous and independent of proton decoupling. In pure water, we observe an abrupt line broadening with the freezing of the bulk solvent, followed by continuous line broadening at lower temperatures. In frozen glycerol-water, we did not observe an abrupt line broadening and the NMR lines were generally narrower than for pure water at the same temperature. 1H and 2H measurements characterizing the dynamics of water that is in exchange with the protein showed that the 13C line broadening is relatively independent from the arrest of isotropic water motions.
Introduction
Solid-state NMR on frozen protein solutions has a great potential for investigating protein folding, dynamical disorder, and soluble proteins that are too big to be investigated with liquid-state NMR spectroscopy [1]. For example, Tycko and coworkers studied the folding of HP35 using frozen glycerol-water solution NMR in the presence of guanidine hydrochloride [2] or using fast freezing methods [3]. They also demonstrated the ability of frozen solution solid-state NMR to investigate large biomolecular complexes by studying HIV proteins bound to an antibody and RNA [4], [5]. Furthermore, frozen solution NMR of proteins and other biomolecules can be combined with dynamic nuclear polarization (DNP) a technique increasing the signal-to-noise (SN) of an NMR spectrum up to two orders of magnitude [6]. In fact, most of the biomolecular DNP done to date relies on frozen glycerol-water solutions, which serve as cryoprotectant and ensure the uniform distribution of the (bi)radicals [6].
However, solid-state NMR on frozen solutions comes at a price, since the linewidths observed for such samples, especially at the low temperatures of about 153 K used by Tycko and coworkers, and of about 100 K used for most DNP applications, are significantly larger than those observed in crystalline protein samples or other regular arrays of proteins [7]. We recently showed that it is possible to record relatively high resolution 13C spectra of ubiquitin and a type III antifreeze protein in frozen solution samples at higher temperatures, i.e. just a few degrees below the freezing point of bulk aqueous solvent [8].
These results raised in our minds the question of the detailed dependence of the linewidths on temperature and composition of the solvent between freezing and −80°C, where the hydration shell directly surrounding the protein is progressively becoming solid. Such a study could give some insights into the origin of the observed line broadening in frozen solutions.
Proteins in aqueous solution influence the properties of water in their direct vicinity. These water molecules, which form the hydration shell, reciprocally influence the structure and dynamic of the protein in solution [9]–[11]. Terahertz spectroscopy [12], neutron diffraction [13], and NMR [14]–[18] can be used to study the dynamics of the hydration shell and the interactions between the protein and its hydration water. Based on these methods and molecular dynamics simulations of protein-water system, it is believed that there is about 0.4 g of hydration water per gram protein and that this water is slightly denser and less dynamic than bulk water [14]. Several NMR studies suggested that a minimal protein hydration has not only a crucial influence on the dynamics of the protein, but also on the linewidth observed in solid-state NMR spectra of proteins, since the linewidth increases notably when the minimal hydration shell is removed [15], [19].
Interestingly, the hydration water of proteins does not freeze at the same temperature as the bulk solvent, but is mobile and non-crystalline over a considerable temperature range below the bulk transition temperature, and undergoes a glass transition at lower temperatures. The experimentally observed solvent glass transition temperature depends critically on the timescale of the method used to probe the hydration water [20]–[23], consistent with a continuous retardation of the translation timescale with temperature. For example, differential scanning calorimetry (DSC) data, probing macroscopic time scales (1–100 s), indicates a glass transition in frozen protein solutions of approximately 200 K [21]. Neutron diffraction and NMR data probe faster timescales and observe the glass transition at considerably higher temperatures. 1H NMR data indicate that the protein hydration shell of ubiquitin freezes and thereby escapes detection at about 223 K [24]. (This is confirmed in our NMR studies of the hydration shell of frozen ubiquitin and antifreeze protein solutions at 238 K [25]). Goddard and coworkers observed the complete arrest of the hydration water in rehydrated lyophilized protein at 170 K [18].
Since 13C NMR linewidths of proteins in frozen solution are often reported to be broad at temperatures below the protein-solvent glass transition, and relatively high-resolution 13C spectra of proteins could be obtained above this transition, we set out to answer the following questions: How does the 13C linewidth of a protein solution depend on temperature? What is the nature of the 13C line broadening? What influence do solvent dynamics and aggregation state have on the 13C linewidth? Is the 13C linewidth influenced by the addition of glycerol? To learn more about the relation between solvent dynamics and 13C linewidth, we present the following data on frozen ubiquitin solutions in the presence and absence of glycerol at temperatures down to 183 K.
Results
Carbon Linewidth
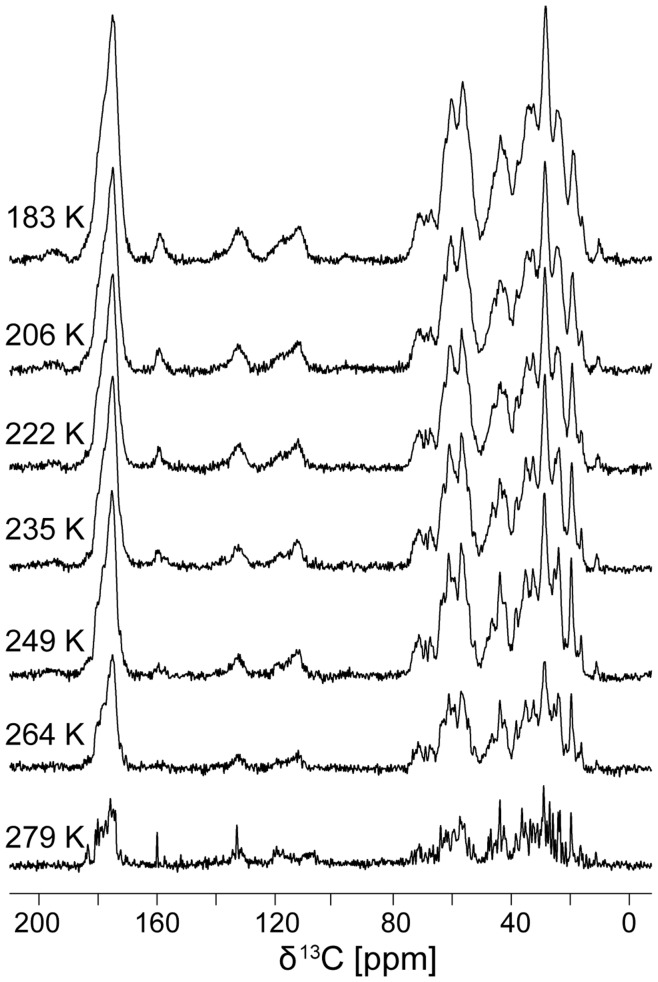
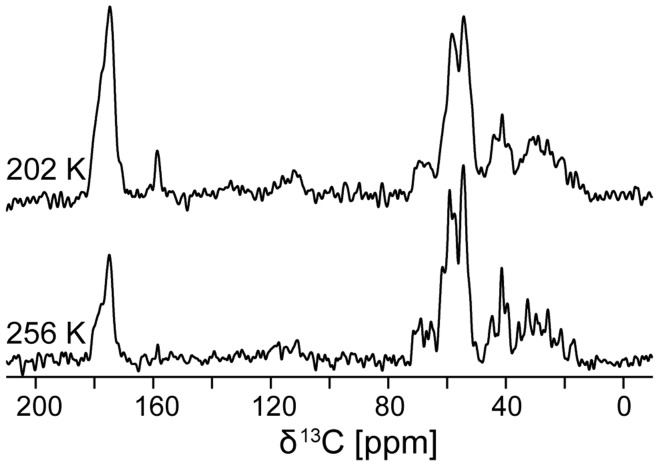
How does temperature influence the 13C linewidth of a protein in H2O below the freezing point of the bulk solvent, i.e. trapped in ice? To answer this question, we recorded 13C spectra of ubiquitin at various temperatures. As can be seen from Figure 1, the linewidth of the spectra broadens in two stages. Noticeable broadening occurs with the freezing of the bulk water between 279 K and 264 K. As the temperature is further lowered from 264 K down to 183 K, the linewidth continuously broadens further. (To eliminate the possibility of a trivial effect on the decoupling performance, we re-optimized 1H decoupling at the lowest temperature, confirming the same decoupling optimum.) We recorded 1D CP MAS spectra on perdeuterated ubiquitin at 256 K and 202 K, and these samples exhibited linewidths very similar to those of protonated ubiquitin (see Figure 2). The observed line broadening was, therefore, not the result of insufficient decoupling.
Figure 1. Temperature dependence of 13C linewidth in an ubiquitin-water solution.
Spectra were recorded on a 750 MHz spectrometer, at 12 kHz MAS, using 128 acquisitions. Direct 13C excitation by a 90° pulse was used at 279 K, a 1H-13C CP pulse sequence was used otherwise. The spectra at 279 K and 264 K were recorded with less sample than the others explaining the reduced signal intensity. The spectra show that the 13C lines broaden abruptly when the solution freezes between 279 K and 264 K. After that, the linewidth increases in a continuous manner with lowering the temperature.
Figure 2. Temperature dependence of 13C linewidth of perdeuterated ubiquitin in frozen H2O solution.
Spectra were recorded on a 750 MHz spectrometer, at 12 kHz MAS, using 1024 acquisitions. The increase in linewidth from 256 K to 202 K is similar to the line broadening observed on fully protonated ubiquitin. These data prove that imperfect decoupling is not the reason for the increase in linewidth.
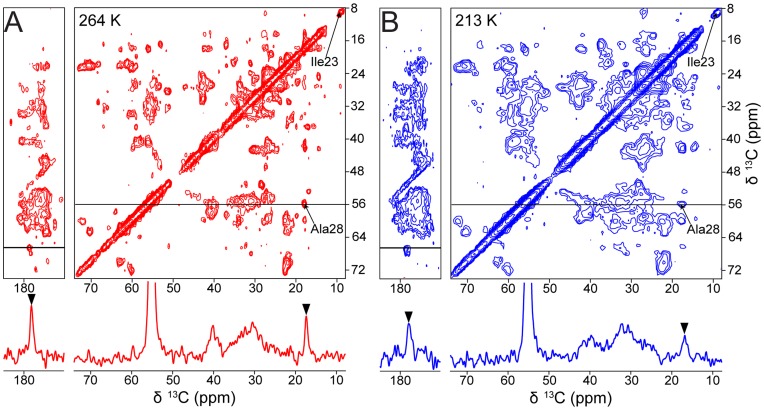
Figure 3 shows two 2D DARR 13C-13C correlation spectra we recorded at 264 K (red) and 213 K (blue) to monitor the extent of line broadening in more detail. The two spectra overlap very well giving little indication of chemical shift change between the two temperatures. The well-resolved Cδ1 of Il23 exhibits with about 0.5 ppm one of the highest chemical shift changes observed (see also reference [8]). However, the resolution at 213 K is significantly worse than at 264 K causing several cross peaks to merge at 213 K that were distinguishable at 264 K. The 1D slices shown below the 2D spectra confirm these results, and a dramatic line broadening could be observed e.g. for the Ala28 Cα-Cβ cross peak at 18.6 ppm.
Figure 3. 2D DARR spectra of U-13C-15N labeled ubiquitin in frozen H2O solution at 264 K and 213 K.
A) Spectrum recorded at 264 K sample temperature (red). B) Spectrum recorded at 213 K sample temperature (blue). The 1D spectra shown are extracted form the δ1 slices indicated inside the 2D spectra. The two spectra illustrate the extent of line broadening induced by lowering the temperature in frozen protein solutions.
The Cβ linewidth of this Ala28 increases from ∼150 Hz (0.8 ppm) at 264 K to ∼240 Hz (1.3 ppm) at 213 K. A similar extent of line broadening can be observed in Figure 2 where the isolated line of Ile23 Cδ1 at 8.5 ppm broadens from ∼100 Hz (0.5 ppm) at 279 K to ∼165 Hz (0.9 ppm) at 264 K and to ∼256 Hz (1.5 ppm) at 213 K.
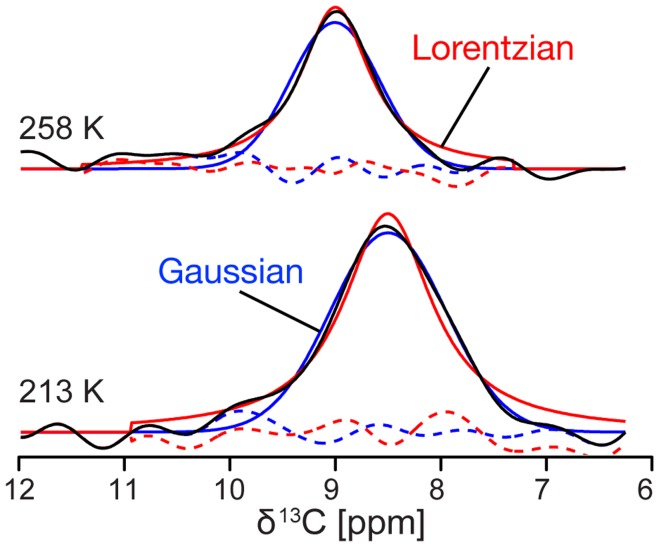
Is this line broadening inhomogeneous, and due to an increase in structural heterogeneity at lower temperatures, or homogeneous, and due to an increase in T2 relaxation? To answer this question, we measured the temperature dependence of the average 13C T2’ of ubiquitin in frozen solution using a simple Hahn echo pulse sequence. Here, T2’ is the transverse relaxation time measured by a Hahn echo pulse sequence under MAS and high power 1H decoupling, which includes the spin-spin relaxation T2, the 13C-13C J-coupling, and contributions from imperfect averaging of dipolar couplings. The data in Figure 4 (circles) show that 13C T2’ increases with decreasing temperatures. In addition to this, Figure 4 shows the T2* calculated from the Cδ1 line of Ile23 (diamonds). T2* is the total transverse relaxation measured by the 13C FID under 1H decoupling, that includes T2’ and contributions from inhomogeneous line broadening i.e. small variations in the isotropic chemical shift throughout the sample. At temperatures just below the freezing point of the solution, the T2’ of ∼3.8 ms is only slightly longer than the T2* we calculated from the linewidth and most of the linewidth we observe is, therefore, due to T2’. However, the line broadening we observed at lower temperatures cannot be explained by T2’ alone. Line broadening and T2’ seem to be uncorrelated indicating that the line broadening we observe with lower temperatures is inhomogeneous. The fact that the Cδ1 line of Ile23 fit somewhat better to Lorentzian line shapes at high freezing temperatures and better to Gaussian line shapes at low temperatures, supports this finding (see Figure 5).
Figure 4. Temperature dependence of 13C T2’ of frozen ubiquitin-water solution in comparison with T2* calculated from the 13C linewidth.
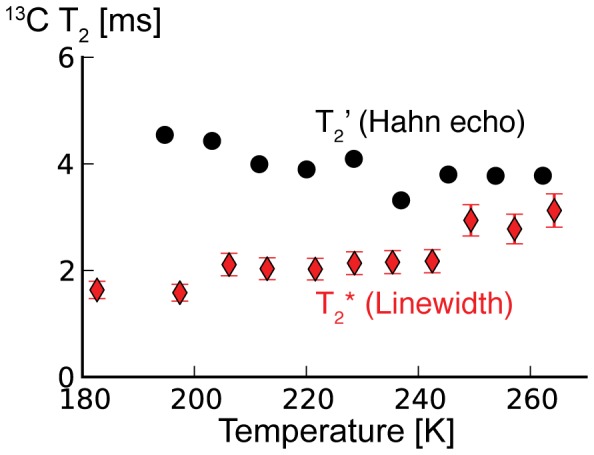
T2’ shown with black circles were measured with a simple Hahn echo pulse sequence and the data were fit to exponential decay curves. The values T2* plotted with red diamonds were calculated from the Cδ1 linewidth of Ile23. The T2’s measured with an echo sequence increase moderately towards lower temperatures and can, therefore, not explain the line broadening observed at lower temperatures.
Figure 5. Change in 13C line shape of an ubiquitin-water solution with temperature.
Fits of the Ile23 Cδ1 line of ubiquitin in frozen H2O solution to either Gaussian (blue) or Lorentzian (red) line shapes at two different temperatures. The residuals are shown with dashed lines in the same color. At 258 K the line can be fit better with a Lorentz function (χ2 = 5.7*1014) than with a Gaussian (χ2 = 1.9*1015) indicating a dominantly T2 relaxation based linewidth. At 213 K the line fits better to a Gauss (χ2 = 5.5*1014) than to a Lorentz (χ2 = 1.3*1015) function indicating that chemical shift distributions are more important for the linewidth at low temperatures. Also note the chemical shift change of ∼0.5 ppm.
Glycerol-water Solutions
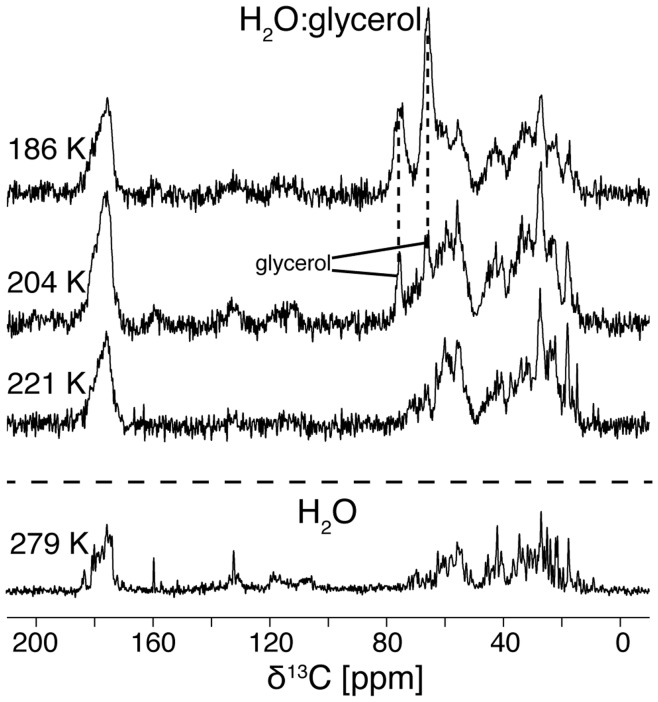
Many studies on frozen protein solutions are not done in frozen H2O, i.e. ice, but in mixtures of water and glycerol. In contrast to pure water, glycerol-water mixtures are known to form a glass at low temperatures, which proves to be advantageous, especially in the context of DNP experiments [6] and to prevent possible protein concentration and aggregation [26]. Therefore we asked: what is the influence of the additional glycerol on the 13C linewidth of ubiquitin in frozen solution? To answer these questions, we recorded spectra of ubiquitin in frozen 1∶1 glycerol-water mixtures. Figure 6 shows 1D 13C CP MAS spectra recorded between 221 K and 186 K. Above 221 K the sample turned out to be lossy and gave low CP efficiencies, indicating that it was still relatively liquid at these temperatures. Similar to the data recorded in pure water, the 13C linewidths of ubiquitin in glycerol-water are quite narrow right at the point where the viscosity of the bulk solvent slows the molecular tumbling of the protein into a range where the 1H-13C dipolar couplings are not averaged completely and the CP efficiency becomes comparable to crystalline samples. Lowering the temperature further leads to a continuous broadening of the protein linewidth. Furthermore, the glycerol becomes so rigid with lower temperatures that it is visible in the 13C CP spectra. The intensity of the 13C spectra we recorded of ubiquitin in glycerol-water solution is too low to observe the Ile23 line at 8.5 ppm, but already the three overlapping Cδs of Ile3, 13, and 61 at 13.9 ppm have a linewidth of less than 100 Hz (0.5 ppm) at 221 K. This linewidth corresponds to the linewidth of ubiquitin in H2O solution above freezing. When the temperature is lowered, these lines broaden considerably in both samples and overlap with other lines making linewidth measurements difficult.
Figure 6. Temperature dependence of 13C linewidth of ubiquitin in 1∶1 v/v glycerol water solution.
CP MAS spectra were recorded on a 750 MHz spectrometer, at 12 kHz MAS, using 128 acquisitions. Glycerol 13C lines are labeled with stars. As comparison, the equivalent spectrum of ubiquitin in H2O at 279 K from Figure 1 is also shown. The linewidth of the spectra increases when lowering the temperature similar to the spectra in non-glycerol solutions shown Figure 1. However, the line broadening occurs at lower temperatures compared to the solution without glycerol.
Magnitude and Dynamics of Non-frozen Water
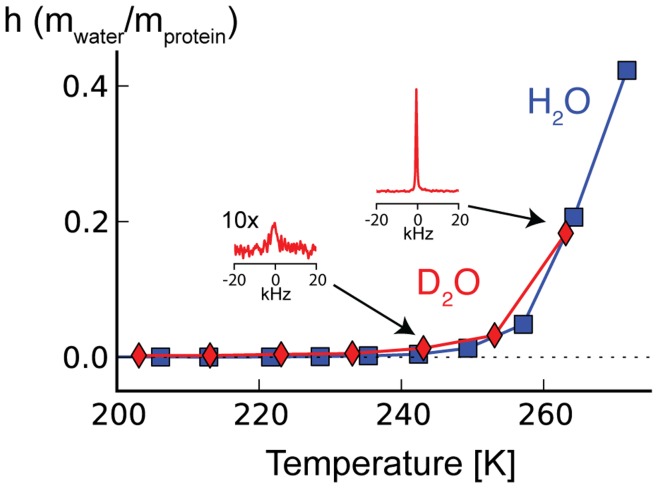
To learn more about how the 13C linewidth of ubiquitin in frozen solution is influenced by the dynamics of the surrounding water, we recorded 1H and 2H NMR spectra alongside the 13C spectra shown in Figure 1. Figure 7 shows the temperature dependence of the intensity of liquid-like 1H in a ubiquitin solution recorded at 750 MHz from temperature just below the freezing point down to about 200 K. The narrow 1H line of the non-frozen water was separated from broader, static 1H resonances using a sine bell window function and magnitude mode processing. The intensity of this narrow line reflects the amount of liquid water with a correlation time short enough to be detected in our experiment (much less than the inverse of the dipolar 1H-1H couplings, i.e. nanosecond or shorter). In these experiments, non-frozen water becomes undetectable at about 240 K. We recorded similar data for the non-frozen water in a frozen ubiquitin D2O solution using a static probe on a 600 MHz spectrometer (Figure 7). Also here we could observe a relatively narrow, sideband-free 2H line for the non-frozen water until it got less intense and difficult to detect at about 240 K. This narrow, sideband free 2H could not be detected in spectra of pure water and is also absent with some of the other solutes we tested. Only the broad 2H tensor of ice is detectable in this case.
Figure 7. Temperature dependence of the 1H and 2H water line intensity in frozen ubiquitin solution.
The 1H line intensity of the non-frozen water obtained by applying a sine bell square window function followed by magnitude mode processing (blue squares) becomes diminishing small around 240 K. The Intensity of non-frozen water 2H line of frozen ubiquitin-D2O solution (red diamonds) shows similar temperature dependence. Both 1H and 2H data were normalized to the respective signal intensity above the freezing point and expressed as g water per g protein. These data show that the non-frozen water becomes hard to detect in frozen ubiquitin solutions at about 240 K when observed with 1H and 2H NMR.
To probe the 1H and 2H line broadening further, and clarify the slower molecular tumbling of the water at low temperatures, we measured 2H T1 and calculated the corresponding molecular correlations times τC of water using the following equation [27].
| (1) |
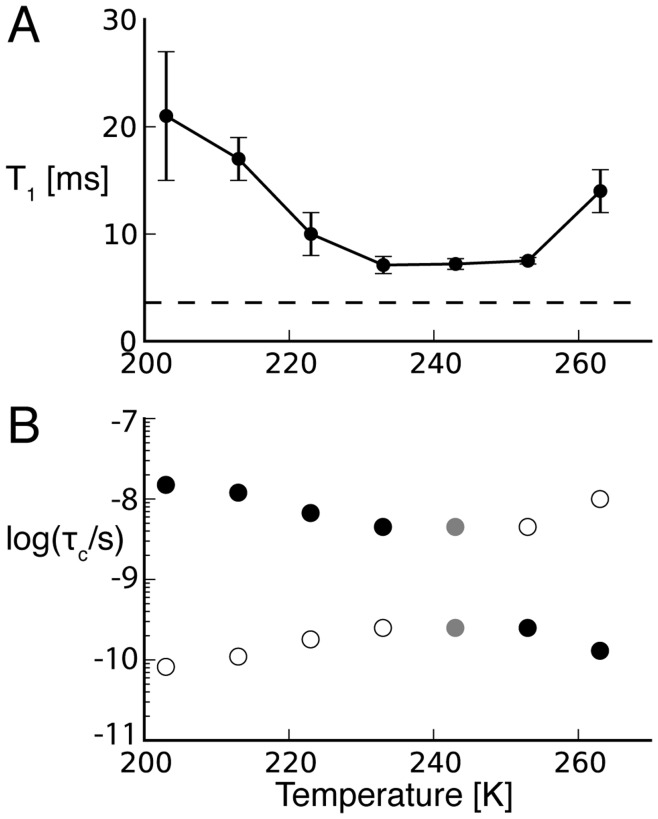
Cq and η are the D2O quadrupolar constant and asymmetry parameter, respectively, and ω0 is the deuterium Larmor frequency. The 2H T1 of non-frozen water and the corresponding molecular correlations times assuming Cq = 195 kHz and η = 0.1 are shown in Figure 8. Despite the ambiguity of two solutions for the correlation time in this T1 measured, it is clear that that τC increases (to ∼15 ns) and the isotropic 2H lines disappears when the condition  is not fulfilled [17]. The T1 relaxation times we measured did not reach the theoretical T1 minimum calculated from Equation 1 (dashed line in Figure 8a), which is often interpreted as evidence for complex motional models.
Figure 8. Water spin lattice relaxation time T1 of 2H of frozen ubiquitin solution and the resulting rotation correlation time τC.
A) 2H T1 of non-frozen water measured with a simple saturation recovery and quadrupolar echo pulse sequence. The theoretical minimum assuming a single τC and an isotopic motion is indicated with a dashed horizontal line. B) Temperature dependence of the non-frozen water τC calculated using Equation 1, the T1 relaxation times shown in A), and a quadrupolar coupling constant and asymmetry parameter of Cq = 195 kHz and η = 0.1 respectively. Two possible τC values correspond to each T1 in the temperature according to Equation 1. Since τC is expected to decrease at lower temperatures the most likely τCs are shown with full circles. The equally likely τCs corresponding to the minimal T1 are shown in gray.
Discussion
We reproduced an abrupt broadening of the 13C linewidth due to freezing of the solvent. Although this is not the major topic of the paper, it is interesting to discuss its origin. The abrupt broadening of the 13C linewidth of ubiquitin in H2O when freezing the bulk solvent between 279 K and 264 K might result from restriction of ubiquitin to the confined space of its hydration shell and therefore cessation of large-scale molecular motions that average the inhomogeneous environment. Similar effects could be expected due to excluded volume effects resulting from the formation of large ice crystals and a resulting concentration of protein [26]. Another possible explanation for broadening at the freezing point of the bulk solvent could be that the freezing introduces structural heterogeneity via direct ice interactions, e.g. the different orientations of crystal planes around the protein and resulting variations in the size and shape of the remaining hydration shell. These effects might explain the small difference at 263 K between the measured T2’ and the T2* calculated from the 13C linewidth (Figure 4).
Our major emphasis was on the behavior of the NMR linewidths as a function of temperature below the freezing point of the solution. We observed a gradual broadening of the 13C line when the temperature was lowered below the freezing point down to 183 K. It is interesting to compare this temperature profile to that of the solvent motions: The 2H and 1H lines of the non-frozen water undergo a more marked broadening and loss of detectability at about 240 K. Over this narrower temperature range, 240–260 K, where the solvent apparently undergoes a transition, we did not observe a more substantial 13C linewidth change; the linewidth change for the protein was relatively smooth over a much broader temperature range. This observation suggests that there is no specific relation between solvent dynamics or averaging and linewidth over this range.
The additional 13C line broadening at 183 K as compared with 264 K is inhomogeneous. T2’ of the protein 13C lines increases with lower temperatures over this range. The line broadening does not result from a decrease in T2 but from an increase in local inhomogeneity. At high temperatures, it is possible that fast exchange among local microstates leads to narrow 13C lines. At lower temperatures, the local conformations appear to become increasingly locked, leading to conformational differences throughout the sample, that are distinct and long-lived on the NMR timescale (ms or slower), and distinct in terms of their isotropic chemical shift, and, therefore, line broadening is observed. This also explains why the line shapes become less Lorentzian and increasingly Gaussian at lower temperatures: Just below the freezing point of the solution the linewidth comes dominantly from the exponential T2’ decay of the 13C magnetization resulting in a Lorentzian line shape. At low temperatures the linewidth comes increasingly from a distribution of chemical shifts resulting in a Gaussian line shape. The linewidth change can be thought of as local, relatively modest structural heterogeneity. The difference in linewidth of Ala28’s Cβ between 264 K and 213 K is ∼0.5 ppm. In comparison, the average difference between an Ala Cβ in an α-helical and extended β-sheet conformation is about 3.5 ppm. The line broadening of 0.5 ppm corresponds therefore presumably to a change that is much less dramatic than a secondary structure change. The line broadening at low temperatures is not typically accompanied with a measurable change in average chemical shift; only a few isolated signals such as the Cδ1 of Ile23 showed chemical shift changes in the order of 0.5 ppm. Interestingly, Ile23 also showed the maximum chemical shift in an earlier study comparing solution with frozen solution shifts [8], suggesting that this is an unusually plastic site in the protein.
Therefore, the 13C line broadening does not reflect a change of secondary and tertiary structure of the protein but can be explained by continuous arrest of rotational transitions of amino acid side chains that are lubricated by the presence of a solvent shell or, especially in the case of methyl rotations, are volume conserving and independent of solvent dynamics [28], [29].
Maus and co-workers described 13C line broadening at low temperatures due to the interference between the methyl group rotation and 1H decoupling field strength in a crystalline sample [30]. The fact that we observed comparable line broadening in protonated and perdeuterated samples of ubiquitin rules out the possibility that insufficient 1H decoupling or interference between the methyl group rotation and 1H decoupling field strength could be the reason for the line broadening in our case. However, the freezing of methyl group rotation could play an important role for the 13C linewidth at lower temperatures [31].
The glycerol-water solution has no liquid-solid phase transition and rigidifies at much lower temperatures compared to pure water. Therefore, ubiquitin in glycerol-water becomes accessible to dipolar CP MAS spectroscopy at lower temperatures than ubiquitin in pure water. The 13C lines of the protein in glycerol water mixtures become gradually broader as the temperature is lowered, analogously to the protein frozen in ice. However, at a given temperature the protein lines in glycerol-water mixtures are considerably narrower. We observed 13C linewidths at 221 K in glycerol-water that are comparable to those in pure water at 264 K [32]. Between the freezing point of the pure water and the glass transition of the glycerol-water solution (∼160 K), the bulk glycerol-water solution is apparently more dynamic than pure water at this temperature. It is very likely that this is also true for the water in the vicinity of the protein, leading to narrower lines at comparable temperatures. However, we were not able to distinguish the solvent at the protein surface from the bulk solvent with NMR in the case of the glycerol-water mixture.
It is curious that for glycerol-water solutions over the temperature range from 221 to 186 K, dipolar based NMR sequences that would normally require a solid sample, such as CP, perform well, despite the fact that the solvent has not undergone a glass transition. This is arguably analogous to the situation for crystalline protein samples that are typically bathed in a liquid medium between about 200 and 270 K, and give very high quality SSNMR spectra nevertheless, because they are arrested by protein-protein interactions. Mainz and coworkers previously observed high-resolution 13C CP MAS spectra of a protein in 20% glycerol-water solutions at a sample temperature of 263 K; the ability to achieve a high quality solid-state NMR signal at this relatively high temperature was due to sedimentation of the protein complex, rather than a rotational correlation time slow enough to permit Hartman-Hahn cross polarization [33]. For ubiquitin the centrifugal forces of an MAS rotor are not sufficient to sediment the protein. Certainly a precipitate of the protein could be centrifuged but an arrest of the protein due to the solidification of the solvent is the more likely reason that dipolar based solid-state NMR techniques are applicable to our samples [33].
The temperature at which NMR of frozen solutions show the best resolution, in pure water and glycerol-water mixtures, is as close as possible to the bulk transition, or the point where the solution is rigid enough to allow dipolar CP to work. At lower temperatures the line broadening is sufficient to present practical problems for example by making the assignment of 2Ds (Figure 3) increasingly difficult. In this case selectively labeling or additional spectral dimensions become necessary [2], [34]. The linewidths we observed in frozen ubiquitin solutions at all temperatures are well above those observed by Zech and coworkers in crystalline samples of ubiquitin under very similar conditions [35]. This difference may result from larger structural inhomogeneity in the frozen than in the crystalline state. It is worth noting, however, that the linewidth of crystalline proteins can also get larger when lowering the temperature as characterized in a recent study about the temperature dependence of the 13C linewidth in crystalline SH3 [36]. Rapid freezing experiments have been proposed to obviate this problem, but Hu and coworkers showed that the speed of freezing has only a modest effect on the linewidth of natively folded protein in frozen solution [3] and a recent EPR study showed that the freezing speed has no effect on protein structure [26]. Thus, other solutions are needed to this important practical problem.
We were able to observe a significant fraction of mobile water in ubiquitin in H2O below the freezing point of the bulk water. When expressed in a mass ratio of water per protein, we find that this ratio corresponds relatively well to the 0.4 g of hydration water per g of protein reported in the literature [14]. In a previous publication we measured 1H -13C correlation spectra that showed that this water is in exchange with the protein [25]. We therefore assign this non-frozen water to either the direct hydration shell of the protein or water that is in rapid exchange with the hydration shell.
We observed that the intensity of the 1H and 2H lines of the non-frozen water in Figure 7 are much diminished at 240 K (as compared to 270 K). In contrast, Tompa and coworkers reported relatively constant 1H line intensity between 273 and 228 K by analyzing the components of a static 1H spectrum (wide-line NMR) of a very similar frozen ubiquitin solution. Interestingly, our intensity measurements correspond very well to the DSC data reported in the same study [24]. The rotation correlation time τC of the non-frozen water measured via the 2H T1 relaxation rate became longer when lowering the temperature of our frozen protein solution (see Figure 8a). Furthermore, the work of Vogel and coworkers indicated that these dynamics are also complex [17]. This continuous change in complex solvent dynamics underlies the glass transition, whose temperature depends partly on the measurement criterion or the timescale of the experimental method. Our observation of a strong broadening of the 1H and 2H non-frozen water lines around 240 K, suggests that at this temperature τC was in the order of 10−10–10−8 s and the  condition was not fulfilled any more. This timescale for water rotation corresponds very well to the correlation times reported by Vogel and coworkers, who used 2H spectra and T1 measurements to characterize the dynamics of supercooled water in wet protein samples. The T1 data reported in that study fit best to a distribution of correlation times. Such a distribution of correlation times could also explain the discrepancy between the theoretical T1 minimum and the minimal measured T1 in our data (see Figure 8). Additional data at different magnetic fields would be needed to characterize this distribution in more detail.
The 13C linewidth of the protein behaves very differently from the 1H and 2H linewidth of the non-frozen water. The narrow lines at high temperatures are assumed to be the result of dynamic averaging over different conformations in the fast exchange limit. The broad lines at lower temperatures are the result of the reduction of these dynamics, freezing of multiple specific conformations, which leads to static disorder and inhomogeneous line broadening. The timescale and of the motions relevant for the 13C linewidth are determined by the intermediate to slow exchange limit given by the heterogeneous 13C chemicals shifts. Assuming a line broadening of about 100 Hz, the motions leading to line narrowing at high temperatures are expected to be much faster than 10−3 s, and at lower temperatures must be much slower than that timescale. The 13C linewidth is, therefore, potentially sensitive to much slower motions than the 1H and the static 2H lines.
From these data, the linewidth changes that we observe between 190 and 270 K are not likely due to the changes in solvent dynamics we observe via the 1H and 2H spectra of the non-frozen water. However, the fact that the 13C line broadening we observe is continuous with temperature does not exclude the possibility that the change in linewidth is connected to other dynamical modes or timescales of the surrounding solvent. Bajaj and coworkers observed no significant 13C line broadening in spectra of a dehydrated crystalline tripeptide down to temperatures of 90 K [37]. Linden and coworkers, on the other hand, observed very similar line 13C line broadening in SH3 protein crystals that contain significant amounts of crystal water [36]. Side-chain rotamer motions, especially methyl rotations that could be responsible for the 13C line broadening we observe have been implicated to be solvent independent [28]. On the other hand the motions of especially solvent accessible polar sidechains are thought to be facilitated by the presence of the solvent and arrest if the solvent shell is either absent or very viscous [18]. Dry protein samples are usually showing severe 13C line broadening which disappears with the hydration of the protein [15], [19]. This indicates that water plays a role for the slow dynamics governing the 13C linewidth and has a function as lubricant of protein motions.
The fact that ubiquitin does not make direct contact to the surrounding ice but rather has a glassy hydration shell at all temperatures [21] and the fact that non-ice forming glycerol solutions show similar line broadening effects than pure H2O solutions make it unlikely that the 13C line broadening we observed is a result of sample heterogeneity due to spontaneous formation of crystalline ice at the protein surface.
This model could be further tested in a number of ways. Extending the data presented in this manuscript to temperatures below 180 K would be desirable since they would answer the question whether the broadening of the 13C lines continues at lower temperatures similar to crystalline proteins [36] or reaches a plateau when the timescale of the side-chain motions become of the order of milliseconds. Another interesting way of testing the abovementioned hypothesis is the measurement of dynamic order parameters via e.g. 1H-13C dipolar couplings that could identify the difference in dynamics of the protein in frozen solution above the protein-solvent glass transition and at very low temperatures.
In summary, we have characterized the 13C linewidth of ubiquitin and its dependence on non-frozen solvent dynamics in frozen pure H2O and glycerol-water solutions at different temperatures. In pure H2O solutions, after an abrupt line broadening due to the freezing of the bulk solvent, the protein 13C linewidth broadens continuously when lowering the temperature. This line broadening is inhomogeneous and independent of 1H decoupling as confirmed with Hahn echo experiments and perdeuterated samples, respectively. The 13C linewidth of a protein in frozen solution does not follow the pronounced line broadening we observed of the hydration shell 1H and 2H line around 240 K. We hypothesize that the 13C line broadening may be related to solvent motions other than those we observed using 1H and 2H NMR. In this picture, the protein 13C linewidth depends first on the freezing point of the solvent, arresting the protein to a confined space and, after the bulk solvent is frozen, on the local dynamics of the protein and its hydration shell. The glycerol-water mixture does not undergo a sharp phase transition and we consequently did not observe an abrupt 13C line broadening as in pure H2O. Generally, the 13C linewidth in glycerol-water was smaller than in pure H2O at the same temperature but the linewidth increased when lowering the temperature analogous to the pure H2O solution.
Materials and Methods
Sample Preparation
Uniformly 13C-15N labeled ubiquitin was expressed and purified as described earlier [25]. The lyophilized protein was dissolved in deionized water and 1∶1 v/v glycerol-water at final concentrations of 35 mg/ml and 32 mg/ml, respectively.
NMR
Solid-state 13C and 1H NMR spectra were recorded on a Bruker 750 MHz Advance spectrometer using a 4 mm double resonance probe operating at 12 kHz MAS. The sample temperatures were calibrated externally using Pb(NO3)2 [38]. 1H 1D spectra and saturation recovery curves were recorded using hard pulses of 100 kHz. Protein 1D 13C spectra in frozen solutions were recorded using 1H-13C CP experiments with a contact time of 1 ms and rf-field strengths of 50 and 62 kHz for 13C and 1H, respectively. Equivalent 13C 1D spectra of ubiquitin solutions above the freezing point were recorded using direct excitation via a 90° pulse of 50 kHz. Spinal64 [39] decoupling with a 1H rf-field strength of 100 kHz was used during all 13C detection periods. The 13C T2’ relaxation of ubiquitin and glycerol were measured with CP step followed by a simple 13C Hahn echo element and detection on 13C.
The 2D DARR spectra of Figure 3 were recorded with a mixing time of 20 ms. The spectral width was 50 kHz in both dimensions and 1536 and 1024 points were acquired in the t1 and t2 dimensions, respectively. For each t1 increment 16 and 64 scans were acquired for spectra at 213 K and 264 K, respectively.
Deuterium spectra were recorded on a Varian 600 MHz InfinityPlus spectrometer using a static 2H probe. T1 was measured by saturation-recovery followed by a quadrupolar echo with t = 23 µs. The T1 of non-frozen water and of ice differ by several orders of magnitude making it is easy to separate the spectra of each component.
Acknowledgments
We thank Boris Itin and Mike Goger for technical assistance in the NMR data collection.
Funding Statement
This work was supported by National Science Foundation (NSF) mcb 0316248 and National Institutes of Health (NIH) r01 gm 88724. The funders had no role in study design, data collection and analysis, decision to publish, or preparation of the manuscript.
References
- 1. Long HW, Tycko R (1998) Biopolymer conformational distributions from solid-state NMR: α-helix and 310-helix contents of a helical peptide. J Am Chem Soc 120: 7039–7048 doi:10.1021/ja974277j. [Google Scholar]
- 2. Havlin RH, Tycko R (2005) Probing site-specific conformational distributions in protein folding with solid-state NMR. Proc Natl Acad Sci U S A 102: 3284–3289 doi:10.1073/pnas.0406130102. [DOI] [PMC free article] [PubMed] [Google Scholar]
- 3. Hu K-N, Yau W-M, Tycko R (2010) Detection of a transient intermediate in a rapid protein folding process by solid-state nuclear magnetic resonance. J Am Chem Soc 132: 24–25 doi:10.1021/ja908471n. [DOI] [PMC free article] [PubMed] [Google Scholar]
- 4. Sharpe S, Yau W-M, Tycko R (2006) Structure and dynamics of the HIV-1 Vpu transmembrane domain revealed by solid-state NMR with magic-angle spinning. Biochemistry 45: 918–933 doi:10.1021/bi051766k. [DOI] [PubMed] [Google Scholar]
- 5. Havlin RH, Blanco FJ, Tycko R (2007) Constraints on protein structure in HIV-1 Rev and Rev-RNA supramolecular assemblies from two-dimensional solid state nuclear magnetic resonance. Biochemistry 46: 3586–3593 doi:10.1021/bi0622928. [DOI] [PubMed] [Google Scholar]
- 6. Barnes AB, De Paëpe G, van der Wel PCA, Hu K-N, Joo C-G, et al. (2008) High-field dynamic nuclear polarization for solid and solution biological NMR. Appl Magn Reson 34: 237–263 doi:10.1007/s00723-008-0129-1. [DOI] [PMC free article] [PubMed] [Google Scholar]
- 7. Sharpe S, Kessler N, Anglister JA, Yau W-M, Tycko R (2004) Solid-state NMR yields structural constraints on the V3 loop from HIV-1 Gp120 bound to the 447–52D antibody Fv fragment. J Am Chem Soc 126: 4979–4990 doi:10.1021/ja0392162. [DOI] [PubMed] [Google Scholar]
- 8. Siemer AB, McDermott AE (2008) Solid-state NMR on a type III antifreeze protein in the presence of ice. J Am Chem Soc 130: 17394–17399 doi:10.1021/ja8047893. [DOI] [PubMed] [Google Scholar]
- 9. Tournier AL, Xu J, Smith JC (2003) Translational hydration water dynamics drives the protein glass transition. Biophys J 85: 1871–1875 doi:10.1016/S0006-3495(03)74614-1. [DOI] [PMC free article] [PubMed] [Google Scholar]
- 10. Atilgan C, Aykut AO, Atilgan AR (2008) How a vicinal layer of solvent modulates the dynamics of proteins. Biophys J 94: 79–89 doi:10.1529/biophysj.107.116426. [DOI] [PMC free article] [PubMed] [Google Scholar]
- 11. Vitkup D, Ringe D, Petsko GA, Karplus M (2000) Solvent mobility and the protein “glass” transition. Nat Struct Mol Biol 7: 34–38 doi:10.1038/71231. [DOI] [PubMed] [Google Scholar]
- 12. Heugen U, Schwaab G, Bründermann E, Heyden M, Yu X, et al. (2006) Solute-induced retardation of water dynamics probed directly by terahertz spectroscopy. Proc Natl Acad Sci USA 103: 12301–12306 doi:10.1073/pnas.0604897103. [DOI] [PMC free article] [PubMed] [Google Scholar]
- 13. Gabel F, Bicout D, Lehnert U, Tehei M, Weik M, et al. (2002) Protein dynamics studied by neutron scattering. Q Rev Biophys 35: 327–367 doi:10.1017/S0033583502003840. [DOI] [PubMed] [Google Scholar]
- 14.Halle B (2004) Protein hydration dynamics in solution: a critical survey. Philos Trans R Soc Lond, B, Biol Sci 359: 1207–1223; discussion 1223–1224, 1323–1328. doi:10.1098/rstb.2004.1499. [DOI] [PMC free article] [PubMed]
- 15. Krushelnitsky A, Zinkevich T, Mukhametshina N, Tarasova N, Gogolev Y, et al. (2009) 13C and 15N NMR study of the hydration response of T4 lysozyme and alphaB-crystallin internal dynamics. J Phys Chem B 113: 10022–10034 doi:10.1021/jp900337x. [DOI] [PubMed] [Google Scholar]
- 16. Nucci NV, Pometun MS, Wand AJ (2011) Site-resolved measurement of water-protein interactions by solution NMR. Nat Struct Mol Biol 18: 245–249 doi:10.1038/nsmb.1955. [DOI] [PMC free article] [PubMed] [Google Scholar]
- 17. Vogel M (2008) Origins of apparent fragile-to-strong transitions of protein hydration waters. Phys Rev Lett 101: 225701 doi:10.1103/PhysRevLett.101.225701. [DOI] [PubMed] [Google Scholar]
- 18. Goddard YA, Korb J-P, Bryant RG (2009) Water molecule contributions to proton spin-lattice relaxation in rotationally immobilized proteins. J Magn Reson 199: 68–74 doi:10.1016/j.jmr.2009.04.001. [DOI] [PMC free article] [PubMed] [Google Scholar]
- 19. Kennedy SD, Bryant RG (1990) Structural effects of hydration: Studies of lysozyme by 13C solids NMR. Biopolymers 29: 1801–1806 doi:10.1002/bip.360291411. [DOI] [PubMed] [Google Scholar]
- 20. Ringe D, Petsko GA (2003) The “glass transition” in protein dynamics: what it is, why it occurs, and how to exploit it. Biophys Chem 105: 667–680 doi:10.1016/S0301-4622(03)00096-6. [DOI] [PubMed] [Google Scholar]
- 21. Doster W (2010) The protein-solvent glass transition. Biochim Biophys Act 1804: 3–14 doi:10.1016/j.bbapap.2009.06.019. [DOI] [PubMed] [Google Scholar]
- 22. Shinyashiki N, Yamamoto W, Yokoyama A, Yoshinari T, Yagihara S, et al. (2009) Glass transitions in aqueous solutions of protein (bovine serum albumin). J Phys Chem B 113: 14448–14456 doi:10.1021/jp905511w. [DOI] [PubMed] [Google Scholar]
- 23. Frauenfelder H, Chen G, Berendzen J, Fenimore PW, Jansson H, et al. (2009) A unified model of protein dynamics. Proc Natl Acad Sci USA 106: 5129–5134 doi:10.1073/pnas.0900336106. [DOI] [PMC free article] [PubMed] [Google Scholar]
- 24. Tompa K, Bánki P, Bokor M, Kamasa P, Lasanda G, et al. (2009) Interfacial water at protein surfaces: wide-line NMR and DSC characterization of hydration in ubiquitin solutions. Biophys J 96: 2789–2798 doi:10.1016/j.bpj.2008.11.038. [DOI] [PMC free article] [PubMed] [Google Scholar]
- 25. Siemer AB, Huang K-Y, McDermott AE (2010) Protein-ice interaction of an antifreeze protein observed with solid-state NMR. Proc Natl Acad Sci USA 107: 17580–17585 doi:10.1073/pnas.1009369107. [DOI] [PMC free article] [PubMed] [Google Scholar]
- 26. Georgieva ER, Roy AS, Grigoryants VM, Borbat PP, Earle KA, et al. (2012) Effect of freezing conditions on distances and their distributions derived from Double Electron Electron Resonance (DEER): a study of doubly-spin-labeled T4 lysozyme. J Magn Reson 216: 69–77 doi:10.1016/j.jmr.2012.01.004. [DOI] [PMC free article] [PubMed] [Google Scholar]
- 27.Abragam A (1961) The Principles of Nuclear Magnetic Resonance. Oxford University Press, USA.
- 28. Doster W, Settles M (2005) Protein–water displacement distributions. Biochimica et Biophysica Acta (BBA) - Proteins & Proteomics 1749: 173–186 doi:10.1016/j.bbapap.2005.03.010. [DOI] [PubMed] [Google Scholar]
- 29. Jansson H, Bergman R, Swenson J (2005) Relation between solvent and protein dynamics as studied by dielectric spectroscopy. J Phys Chem B 109: 24134–24141 doi:10.1021/jp052418v. [DOI] [PubMed] [Google Scholar]
- 30. Maus DC, Copié V, Sun B, Griffiths JM, Griffin RG, et al. (1996) A solid-state NMR study of tungsten methyl group dynamics in [W(η5-c5Me5)Me4][Pf6]. J Am Chem Soc 118: 5665–5671 doi:10.1021/ja960248h. [Google Scholar]
- 31. Vugmeyster L, Ostrovsky D, Ford JJ, Lipton AS (2010) Freezing of dynamics of a methyl group in a protein hydrophobic core at cryogenic temperatures by deuteron NMR spectroscopy. J Am Chem Soc 132: 4038–4039 doi:10.1021/ja909599k. [DOI] [PubMed] [Google Scholar]
- 32. Trejo González JA, Longinotti MP, Corti HR (2011) The viscosity of glycerol−water mixtures including the supercooled region. J Chem Eng Data 56: 1397–1406 doi:10.1021/je101164q. [Google Scholar]
- 33. Bertini I, Luchinat C, Parigi G, Ravera E, Reif B, et al. (2011) Solid-state NMR of proteins sedimented by ultracentrifugation. Proc Natl Acad Sci USA 108: 10396–10399 doi:10.1073/pnas.1103854108. [DOI] [PMC free article] [PubMed] [Google Scholar]
- 34. Debelouchina GT, Bayro MJ, van der Wel PCA, Caporini MA, Barnes AB, et al. (2010) Dynamic nuclear polarization-enhanced solid-state NMR spectroscopy of GNNQQNY nanocrystals and amyloid fibrils. Phys Chem Chem Phys 12: 5911–5919 doi:10.1039/c003661g. [DOI] [PMC free article] [PubMed] [Google Scholar]
- 35. Zech SG, Wand AJ, McDermott AE (2005) Protein structure determination by high-resolution solid-state nmr spectroscopy: application to microcrystalline ubiquitin. J Am Chem Soc 127: 8618–8626 doi:10.1021/ja0503128. [DOI] [PubMed] [Google Scholar]
- 36. Linden AH, Franks WT, Akbey Ü, Lange S, Rossum B-J, et al. (2011) Cryogenic temperature effects and resolution upon slow cooling of protein preparations in solid state NMR. J Biomol NMR 51: 283–292 doi:10.1007/s10858-011-9535-z. [DOI] [PubMed] [Google Scholar]
- 37. Bajaj VS, van der Wel PCA, Griffin RG (2009) Observation of a low-temperature, dynamically driven, structural transition in a polypeptide by solid state nmr spectroscopy. J Am Chem Soc 131: 118–128 doi:10.1021/ja8045926. [DOI] [PMC free article] [PubMed] [Google Scholar]
- 38. Bielecki A, Burum DP (1995) Temperature dependence of 207 Pb MAS spectra of solid lead nitrate. an accurate, sensitive thermometer for variable-temperature MAS. J Magn Reson A 116: 215–220. [Google Scholar]
- 39. Fung BM, Khitrin AK, Ermolaev K (2000) An improved broadband decoupling sequence for liquid crystals and solids. J Magn Reson 142: 97–101 doi:10.1006/jmre.1999.1896. [DOI] [PubMed] [Google Scholar]


