Abstract
Classical detection thresholds do not predict liking, as they focus on the presence or absence of a sensation. Recently however, Prescott and colleagues described a new method, the rejection threshold, where a series of forced choice preference tasks are used to generate a dose-response function to determine hedonically acceptable concentrations. That is, how much is too much? To date, this approach has been used exclusively in liquid foods. Here, we determined group rejection thresholds in solid chocolate-flavored compound coating for bitterness. The influences of self-identified preferences for milk or dark chocolate, as well as eating style (chewers versus melters) on rejection thresholds were investigated. Stimuli included milk chocolate-flavored compound coating spiked with increasing amounts of sucrose octaacetate (SOA), a bitter GRAS additive. Paired preference tests (blank vs. spike) were used to determine the proportion of the group that preferred the blank. Across pairs, spiked samples were presented in ascending concentration. We were able to quantify and compare differences between two self-identified market segments. The rejection threshold for the dark chocolate preferring group was significantly higher than the milk chocolate preferring group (p = 0.01). Conversely, eating style did not affect group rejection thresholds (p = 0.14), although this may reflect the amount of chocolate given to participants. Additionally, there was no association between chocolate preference and eating style (p = 0.36). Present work supports the contention that this method can be used to examine preferences within specific market segments and potentially individual differences as they relate to ingestive behavior.
Keywords: Bitterness, rejection threshold, food preference, psychophysics, methodology
Introduction
Recently, Prescott and colleagues conceptualized a new psychophysical method, the rejection threshold (RjT), that combines both dose-response and preference measures (Prescott and others 2005). In this method, a forced choice preference task is used to generate a dose-response function to determine acceptable concentrations. This method avoids the disconnect between detection thresholds and hedonics. Detection thresholds frequently fail to predict suprathreshold intensity (Bartoshuk 1978; Frijters 1978) or food liking (Duffy and others 2004; Lucas and others 2011). This suggests trying to predict product acceptability via detection thresholds is likely to fail. For example, even if I can detect a hint of cork taint in a wine, the amount of cork taint may not be sufficient to make the wine objectionable (see Prescott and others 2005). Using a detection threshold to try to determine acceptability ignores this subtle but important distinction. Thus, instead of making this flawed assumption, the rejection threshold method directly assesses `how much is too much?' by asking the participant to make a hedonic judgement. To date, all applications of rejection thresholds have been in liquid food systems (Prescott and others 2005; Lee and others 2008; Saliba and others 2009; Harwood and others 2012). Here, we apply this method in a solid food system.
Rejection thresholds have been successfully used to investigate group rejection thresholds based on different market segments (Harwood and others 2012) as well as differences in PROP taster status (Lee and others 2008). These studies suggest that the rejection threshold method may be a powerful tool for the investigation of other individual differences that influence preference and potentially ingestive behavior.
For chocolate products, one behavior of particular interest is eating style. Rates of mastication and differences in melting have the ability to influence flavor release and overall perception of a product (Wilson and Brown 1997; Afoakwa and others 2007). A recent study characterized chocolate eating patterns, using cluster analysis to identify three main behaviors relating to mastication and swallowing that occur when people eat chocolate (Carvalho-da-Silva and others 2011). Variation in eating style could potentially alter the perception of and therefore rejection or acceptance of chocolate products. Here, we explore this possibility without advancing any specific a priori hypotheses.
The objective of this study was to investigate the effects of self-identified preference for milk or dark chocolate as well as eating style on group rejection thresholds for bitterness in solid chocolate-flavored compound coatings. Our aim was to quantify and compare differences between these self-declared groups. A secondary goal of this study was to confirm the utility of this method for use with solid samples.
Materials and Methods
Overview of Methods
Commercially available solid milk chocolate compound was chosen as the sample matrix for ease of sample preparation as chocolate-flavored compound coating does not require tempering before molding. (Chocolate differs from compound coating in regard to the fat source; where cocoa butter must be used in chocolate, compound coating can be made from other fats with similar melting characteristics such as palm kernel oil. We will refer to this material as solid milk chocolate compound for the rest of the article.) Sucrose octaacetate (SOA) was used as a model bitter compound as it is highly bitter and generally recognized as safe (GRAS) as both a direct and indirect food additive (21 CFR 172.515 and 21 CFR 175.105). The tests were carried out in individual booths in the Sensory Evaluation Center in the Department of Food Science at Penn State. Procedures were exempted from Institutional Review Board review by the Penn State Office of Research Protections under the wholesome foods/approved food additives exemption in 45 CFR 46.101(b)(6).
Participants
Eighty-five individuals (22 men) aged between 18 – 45 years old who were reportedly healthy, non-smoking, chocolate consumers participated in the study. The participants were recruited from the campus and community surrounding the Pennsylvania State University via email. All participants provided informed consent and were paid for their time.
Stimuli
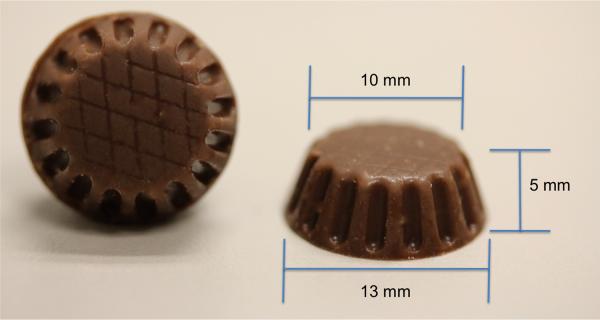
Solid milk chocolate compound was obtained from a commercial source (Chocoley.com), melted down, spiked with varying concentrations of SOA, molded, and stored for 2 weeks at ambient temperature (23°C) before the test. The concentrations of SOA used were 0 μM (blank), 7.5 μM, 15 μM, 30 μM, 60 μM, and 120 μM. These concentrations were chosen based on rejection thresholds for SOA reported in chocolate milk (Harwood and others 2012) and adjusted for solid chocolate via informal bench testing. Samples were 10mm × 5mm × 13mm, and ~0.63g each (Figure 1). Each individual sample was presented as one piece to prevent re-tasting, in a small, clear plastic cup with a lid that was labeled with a random three-digit blinding code. All samples were served at ambient temperature under white light.
1. Sample Dimensions.
Shape and Measurements: One sample piece is shown from above and another is shown from a side-view with references for the dimensions of the samples, which are 10 × 13 × 5 mm. Each sample piece was approximately 0.63g.
Procedures
A Two-Alternative Forced Choice (2-AFC) test was performed to measure preference of the spiked samples compared to the blank samples (rejection thresholds). This test was carried out in accordance with American Society for Testing and Materials (ASTM) standard method E-2263 (ASTM 2004). Each participant was served five pairs of samples total, each pair containing a blank and a spike. Pairs were presented in order of ascending concentration. Sample order within a pair was randomized to avoid order effects. All of the samples were presented on a single tray, and the participants were asked to taste from left to right and front to back, tasting one pair at a time and indicating on the computer which of the two samples they preferred before moving on to the next pair. Compusense five software v5.2 (Guelph, ONT) was used for sample randomization and data collection. As discussed previously, a `no preference' option was not provided (Harwood and others 2012).
At the conclusion of the test session, the participants were then asked to indicate their preference for milk or dark chocolate. They were also asked to identify the best descriptor of their chocolate eating style from a list of three descriptions. The eating style descriptions were based on the results of a recent study on chocolate eating styles by Carvalho-da-Silva and colleagues (2011). Participants were asked to select one of the following descriptors: `I chew the chocolate until smooth before swallowing,' `I chew the chocolate quickly,' or `I suck on/melt the chocolate in my mouth before chewing/swallowing'.
Statistical Analysis
To determine the group rejection thresholds, we used the sigmoid curve fitting approach described previously (Harwood and others 2012), with the minimum and maximum values constrained to their theoretical values (0.5 and 1.0, respectively). To investigate the breakdown of participants into eating style groups, Fisher's exact test (2-tailed) was performed based on eating style and preference for milk or dark chocolate.
Results and Discussion
Results
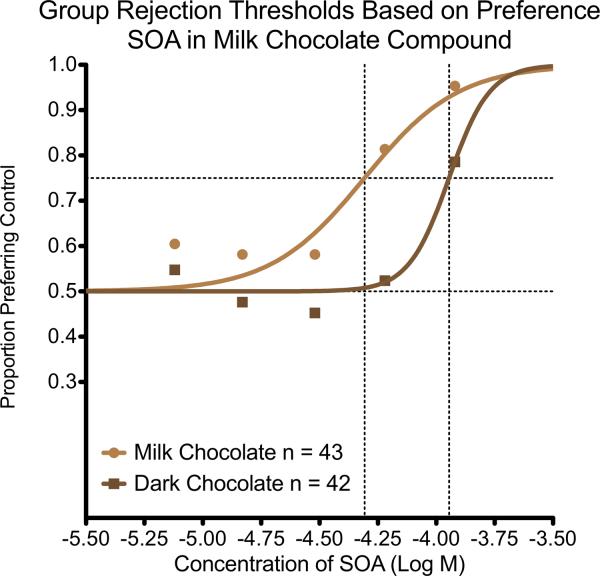
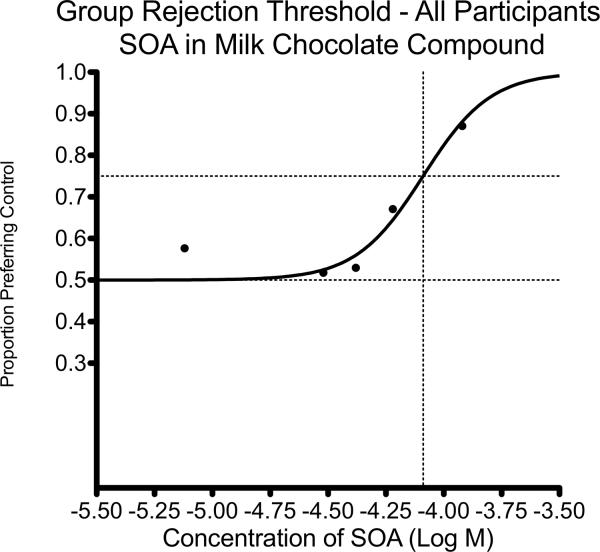
The rejection thresholds for the group as a whole, as well as for preference groups and each eating style group are summarized in Table 1. As expected, as the concentration of SOA increased, the rejection of the spiked samples also increased (see Figures 2 and 3). Across all 85 participants, 43 reported preferring milk chocolate and 42 reported preferring dark chocolate. There was a significant difference between the rejection thresholds based on preference, where the dark chocolate preferring group had a RjT significantly higher than the milk chocolate preferring group [F(1,6)=13.37; p=0.0106] (see Figure 2).
Tables 1.
Rejection Thresholds by Group
| Group | n | Rejection Threshold | p-value |
|---|---|---|---|
| All Participants | 85 | 81.5 μM | n/a |
|
Milk Chocolate
Preferring |
43 | 43.9 μM | 0.011a |
|
Dark Chocolate
Preferring |
42 | 113.5 μM | |
| Thorough Chewers | 45 | 70.0 μM | 0.144 |
| Quick Chewers | 8 | – | |
| Melters | 32 | 93.3 μM |
Statistically significant across the respective groups.
2.
Group Rejection Thresholds Based on Preference for SOA in Solid Chocolate Proportion of participants preferring the un-spiked samples is plotted against concentration of SOA in the spiked sample. The circles (light brown) represent individuals who prefer milk chocolate when eating solid chocolate; the squares (dark brown) represent those who prefer dark chocolate. The chance-corrected concentration at which 50% of participants preferred the control, the rejection threshold, was significantly higher for those who prefer dark chocolate (p = .01).
3.
Group Rejection Threshold of all Participants for SOA in Solid Chocolate Proportion of participants preferring the un-spiked samples is plotted against concentration of SOA in the spiked sample. The concentration at which 50% of participants preferred the control after correcting for chance represents the rejection threshold. The rejection threshold for the entire sample combined (n = 85) was 81.4 μM.
Among those preferring milk chocolate, 26 were thorough chewers, 2 were quick chewers, and 15 were melters; for those preferring dark chocolate, the respective numbers were 19, 6, and 17. A Fisher's exact test suggested there was no association between milk/dark preference and self identified eating style (p=0.36). When comparing the thorough chewers and the melters, there were no significant differences in the rejection thresholds based on the identified eating style [F(1,6)=2.819; p=0.1441]. A rejection threshold was not determined for the quick chewers due to the low number of participants in this group (n=8).
Discussion
The present study successfully utilized the rejection threshold to investigate the effects of self-identified preference for milk/dark chocolate as well as eating style on group rejection thresholds for bitterness in solid chocolate compound. Our aim was to quantify and compare differences between these self-identified groups.
We were able to successfully employ the rejection threshold method in solid chocolate compound, satisfying the secondary aim of this work. Consistent with the reported rejection thresholds for SOA in chocolate milk (Harwood and others 2012), we saw that the RjT for the dark chocolate preferring group was approximately 2.58 times higher than that of the milk chocolate preferring group, a significant difference indicating that those who prefer dark chocolate are much more tolerant of bitterness in chocolate products. Although the current study did not specifically test for differential ability to detect SOA, it seems unlikely that this would explain the difference in rejection thresholds across the two groups. In fluid milk, we observed a similarly sized difference (~2.3 fold) in rejection threshold between the two groups, in spite of the groups having detection thresholds that were functionally identical (Harwood and others 2012). This indicates the increased tolerance for bitterness is not dependent on differences in sensory ability. Additionally, the group RjTs were much higher in the solid chocolate product (here, 43.9 and 113.5 μM) compared to fluid milk (3.95 and 9.00 μM) (Harwood and others 2012), as might be expected as solid chocolate is a more complex stimuli. These data suggest the slope of the indifference-rejection function for bitterness is much shallower in solid chocolate than in chocolate milk.
We failed to find any evidence that rejection threshold varies across eating style, although this may be result of the size of our samples. Because our samples were quite small (~0.63g), they effectively melted as soon as they were placed in the mouth. Thus, while useful in removing any potential confound from eating style in the present data, caution should be taken in generalizing to larger samples. It remains possible that given larger pieces, there may be more differences in perception and therefore rejection thresholds may vary with eating style. Here, we deliberately used small samples to prevent re-tasting.
Present work partially confirms the findings of Carvalho-da-Silva and colleages (2011) on chocolate eating styles. They found approximately half of their participants were quick chewers, with smaller numbers of thorough chewers (~36%) and melters (~15%). In our participants, thorough chewers were the largest group (53%), followed by melters (38%) and quick chewers (9%). Whether this discrepancy results from classification method (EMG/EEG versus self report), chocolate size and/or type, or culture (UK versus US) is unclear. In particular, the higher number of melters in our study may be an artifact of the small amount of chocolate we provided. One potential limitation of this study is the fact that eating style was determined via self-report. Differing amounts of self-awareness while eating, as well as difficulty of characterizing one's own behavior, may have been limiting factors. Here, only three options were provided; hopefully, these choices adequately described all potential eating styles. Also, asking participants to describe their eating style after consuming 10 small samples of chocolate may have altered their response pattern; whether these self-identified styles are stable over time is unknown. Another potential limitation relates to the size of our stimuli; as noted above, we cannot speculate on whether eating style might influences rejection thresholds when larger samples are provided.
Conclusion
This work further validates the use of rejection thresholds to study market segmentation, and extends it to solid foods. We believe this method has broad applicability to the sensory specialist and product developer by providing a means to identifying how much is too much when formulating products. This method could also be used in more basic research to study individual differences as they relate to ingestive behavior.
Practical Application.
This work makes use of the rejection threshold method to study market segmentation, extending its use to solid foods. We believe this method has broad applicability to the sensory specialist and product developer by providing a process to identify how much is too much when formulating products, even in the context of specific market segments. We illustrate this in solid chocolate-flavored compound coating, identifying substantial differences in the amount of acceptable bitterness in those who prefer milk chocolate versus dark chocolate. This method provides a direct means to answer the question of how much is too much.
Acknowledgments
This manuscript was completed in partial fulfillment of the requirements for a Master of Science degree at the Pennsylvania State University by MLH. The authors would like to thank Samantha Bennett, Nadia Byrnes, Alissa Allen, and Elise Boretz for their assistance in sample preparation and data collection. We also thank our study participants for their time and participation.
MLH is supported by funds from the Pennsylvania Manufacturing Confectioners' Association (PMCA) and JEH and GRZ receive support from the Pennsylvania State University. JEH received additional support from National Institutes of Health grant number DC010904.
References
- Afoakwa EO, Paterson A, Fowler M. Factors Influencing Rheological and Textural Qualities in Chocolate, A Review. Trends in Food Science, & Technology. 2007;18(6):290–298. [Google Scholar]
- ASTM . Standard E-2263: Paired Preference Test. ASTM International; West Conshohocken, PA: 2004. [Google Scholar]
- Bartoshuk LM. The psychophysics of taste. The American Journal of Clinical Nutrition. 1978;31(6):1068–1077. doi: 10.1093/ajcn/31.6.1068. [DOI] [PubMed] [Google Scholar]
- Carvalho-da-Silva AM, Van Damme I, Wolf B, Hort J. Characterisation of Chocolate Eating Behaviour. Physiol Behav. 2011;104(5):929–933. doi: 10.1016/j.physbeh.2011.06.001. [DOI] [PubMed] [Google Scholar]
- Duffy VB, Peterson JM, Bartoshuk LM. Associations Between Taste Genetics, Oral Sensation and Alcohol Intake. Physiol Behav. 2004;82(2–3):435–445. doi: 10.1016/j.physbeh.2004.04.060. [DOI] [PubMed] [Google Scholar]
- Frijters JER. Critical analysis of odor unit number and its use. Chemical Senses, & Flavour. 1978;3(2):227–233. [Google Scholar]
- Harwood ML, Ziegler GR, Hayes JE. Rejection Thresholds in Chocolate Milk: Evidence for Segmentation. Food Quality and Preference. 2012;26(1):128–133. doi: 10.1016/j.foodqual.2012.04.009. [DOI] [PMC free article] [PubMed] [Google Scholar]
- Lee YM, Prescott J, Kim KO. PROP Taster Status and the Rejection of Foods with Added Tastants. Food Sci Biotechnol. 2008;17(5):1066–1073. [Google Scholar]
- Lucas L, Riddell L, Liem G, Whitelock S, Keast R. The Influence of Sodium on Liking and Consumption of Salty Food. J Food Sci. 2011;76(1):S72–S76. doi: 10.1111/j.1750-3841.2010.01939.x. [DOI] [PubMed] [Google Scholar]
- Prescott J, Norris L, Kunst M, Kim S. Estimating a “Consumer Rejection Threshold” for Cork Taint in White Wine. Food Quality and Preference. 2005;16(4):345–349. [Google Scholar]
- Saliba AJ, Bullock J, Hardie WJ. Consumer Rejection Threshold for 1,8-cineole (Eucalyptol) in Australian Red Wine. Food Quality and Preference. 2009;20(7):500–504. [Google Scholar]
- Wilson CE, Brown WE. Influence of Food Matrix Structure and Oral Breakdown During Mastication on Temporal Perception of Flavor. Journal of Sensory Studies. 1997;12(1):69–86. [Google Scholar]


