Abstract
We have investigated the amplitude and phase of spontaneous low-frequency oscillations (LFOs) of the cerebral deoxy- and oxy-hemoglobin concentrations ([Hb] and [HbO]) in a human sleep study using near-infrared spectroscopy (NIRS). Amplitude and phase analysis was based on the analytic signal method, and phasor algebra was used to decompose measured [Hb] and [HbO] oscillations into cerebral blood volume (CBV) and flow velocity (CBFV) oscillations. We have found a greater phase lead of [Hb] vs. [HbO] LFOs during non-REM sleep with respect to the awake and REM sleep states (maximum increase in [Hb] phase lead: ~π/2). Furthermore, during non-REM sleep, the amplitudes of [Hb] and [HbO] LFOs are suppressed with respect to the awake and REM sleep states (maximum amplitude decrease: 87%). The associated cerebral blood volume and flow velocity oscillations are found to maintain their relative phase difference during sleep, whereas their amplitudes are attenuated during non-REM sleep. These results show the potential of phase-amplitude analysis of [Hb] and [HbO] oscillations measured by NIRS in the investigation of hemodynamics associated with cerebral physiology, activation, and pathological conditions.
Keywords: cerebral hemodynamics, low-frequency oscillations, near-infrared spectroscopy, diffuse optical imaging, instantaneous phase, phasor analysis, sleep
Introduction
Near-Infrared Spectroscopy (NIRS) is a non-invasive optical method capable of measuring tissue concentrations of oxy-hemoglobin ([HbO]) and deoxy-hemoglobin ([Hb]), as well as tissue hemoglobin saturation (StO2). Functional imaging of the brain is one of the applications of NIRS in the field of biomedical imaging/monitoring. NIRS can monitor the hemodynamics associated with the resting state or with brain activation by specific stimuli/tasks (Hoshi and Tamura 1993; Chance et al., 1993; Villringer et al., 1993). NIRS techniques are progressively attracting more interest because of their high temporal resolution (ms), portability, non-invasiveness, low cost and relative insensitivity to subject’s movements. The main drawback of NIRS is its limited sensitivity to deep tissues (beyond ~2cm), which, however, does not prevent non-invasive sampling of most of the brain cortex. The use of NIRS in conjunction with other technologies revealed the validity of the optical data while also showing NIRS as a potential complementary modality to other brain imaging techniques such as positron emission tomography (PET) (Hock et al., 1997) and functional magnetic resonance imaging (fMRI) (Kleinschmidt et al., 1996). The ability of NIRS to measure both oxy-hemoglobin and deoxy-hemoglobin concentration changes in brain tissue may be used to better understand the interplay of changes in cerebral blood volume (CBV), cerebral blood flow velocity (CBFV) and cerebral metabolic rate of oxygen (CMRO2) during different physiological/pathological states or in response to brain activation. The quest for separating the contributions from physiological underlying processes to measured signals in the fields of fMRI and NIRS has prompted the development of a number of mathematical models for signal interpretation (Buxton et al., 1998; Mandeville et al., 1999; Fantini, 2002; Diamond et al., 2009).
The frequency spectrum of spontaneous hemodynamic oscillations in the brain features three main bands. The first frequency band, around ~1 Hz, is due to the arterial pulsation associated with the heartbeat. The second band, at frequencies around 0.2-0.4 Hz, is due to vascular oscillations and blood pooling associated with respiration. The third band, at frequencies around ~0.06-0.12 Hz, represents so-called low frequency oscillations (LFOs) that have been the focus of a number of NIRS brain studies (Sassaroli et al., 2011). One important research area is that of functional connectivity, which aims at mapping resting-state and activation-state networks of the human brain. LFOs have played a major role in a number of functional connectivity studies. There is a vast literature of functional connectivity studies based on fMRI (Beckmann et al., 2005), which has been recently complemented by NIRS studies (White et al., 2009; Lu et al., 2010). Functionally connected brain networks are usually defined as sets of cortical regions that feature highly correlated hemodynamic changes, with a special emphasis on the LFOs frequency band (Biswal et al., 1995; Zhang and Raichle, 2010). Even though the role and origin of the LFOs are not completely understood (Nilsson and Aalkjaer 2003), they have been linked to Mayer waves (M-waves) and to the phenomenon of vasomotion (Mayhew et al., 1996). In fact, spontaneous LFOs in cerebral hemodynamics are considered to result from a combination of spontaneous brain activity and a systemic common mode component, which some studies have attempted to discriminate using fMRI (Fox et al., 2009) or NIRS data (Katura et al., 2006).
Phase analysis of LFOs for cerebral [Hb] and [HbO] in human subjects has been reported in several NIRS studies over the last two decades (Elwell et al., 1996; Obrig et al., 2000; Taga et al., 2000; Reinhard et al., 2006). The phase relationship between slow oscillatory components of [Hb] and [HbO] is related to the interplay of cerebral hemodynamics parameters such as CBV, CBFV and CMRO2 associated with the auto-regulatory system, spontaneous brain activation, and systemic physiological components. In the NIRS literature, several studies reported a stable phase difference between spontaneous [Hb] and [HbO] oscillations in the LFOs frequency range. Specifically, in a study conducted on infants during quiet sleeping (non-REM stages), [Hb] LFOs were found to lead [HbO] LFOs by about 3π/4 (135°) in the occipital cortex over a time window of 100 s (Taga et al., 2000). Obrig et al. (Obrig et al., 2000) reported a phase lead of ~π/3 (60°) for [Hb] vs. [HbO] LFOs centered at 0.1 Hz, during both visual stimulations and rest. In the study of Obrig et al. (Obrig et al., 2000) a phase difference between [Hb] and [HbO] was only detected at a source-detector separation of 30 mm, while no phase difference was observed at a shorter source-detector separation of 5 mm. Furthermore, no phase differences were observed at the frequency bands associated with cardiac pulsation. In a resting condition experiment, Tian et al. (Tian et al., 2011) performed NIRS measurements at source-detector separations of 1 and 4 cm, and reported that the phase lead of [Hb] vs. [HbO] spontaneous LFOs increased with source-detector separation; ~1 rad (57°) at 1 cm, and ~2.2 rad (126°) at 4 cm. In a study of 0.1 Hz LFOs induced by paced breathing, Reinhard et al. observed a phase difference between [Hb] and [HbO] LFOs around π (180°) in healthy subjects and 2π/3 (120°) in patients with carotid obstructions (Reinhard et al., 2006). This latter study included measurements of low frequency oscillations in arterial blood pressure (ABP) (as measured by finger photoplethysmography) and cerebral blood flow velocity (CBFV) (as measured in the middle cerebral artery by transcranial Doppler ultrasonography). The relative phase between ABP and CBFV provides a measure of cerebral autoregulation (Giller and Mueller, 2003; Latka et al., 2005). While not reporting phase differences between [Hb] and [HbO] oscillations, a number of other studies have investigated low frequency oscillations in ABP and CBFV concurrently with NIRS measurements of cerebral [HbO] (Rowley et al., 2007, Peng et al., 2008) and either tissue oxygenation (Tachtsidis et al., 2004) or differential measurements of [HbO] and [Hb] (referred to as [Hbdiff]) (Payne et al., 2011).
Out of phase oscillatory components of [Hb] and [HbO] in the LFO frequency range raise a question as to what the underlying physiological and hemodynamic mechanisms may be. We have previously argued that out-of-phase oscillations of measured [Hb] and [HbO] cannot be the result of the inherent approximations associated with the modified Beer-Lambert law (mBLL), but must reflect actual out-of-phase oscillations of [Hb] and [HbO] in tissue, either localized or distributed over the probed tissue region (Zheng et al., 2010). This observation follows from the fact that physiological hemodynamic mechanisms in specific vascular compartments induce either no phase difference between [Hb] and [HbO] oscillations (for example for blood volume changes) or a phase difference of π (for example for changes in the speed of blood flow or oxygen consumption) (Fantini, 2002). In this work, we have built on our approach to studying and interpreting oscillatory components of [Hb] and [HbO] and their relative phase difference through the different sleep stages of an all-night sleep study. We believe that the phase difference between the oscillatory components of [Hb] and [HbO] is the key to interpreting and better understanding the interplay between underlying hemodynamic mechanisms that regulate the cerebral blood flow and perfusion.
Several NIRS sleep studies have been conducted on human subjects. Some of them focused on sleep disorders such as sleep apnea (Hayakawa et al., 1996; Hausser-Hauw et al., 2000; Michalos et al., 2000; Matsuo et al., 2010) and neurological conditions such as Rett syndrome (Murakami et al., 1998). The majority of these NIRS sleep studies investigated cerebral [Hb] and [HbO] changes associated with transitions across different sleep stages, and interpreted these changes in terms of CBV, CBFV and CMRO2. The increase in [Hb] and decrease in [HbO] found by Fantini et al. (Fantini et al., 2003) and Shiotsuka et al. (Shiotsuka et al., 1998) immediately after sleep onset were assigned to a decrease in the CBF during the first non-REM sleep stages (Fantini, et al., 2003). An opposite trend (decrease in [Hb], increase in [HbO]) associated with transitions to deepest, slow-wave sleep stages was considered to be consistent with a decrease of CMRO2 (Madsen et al., 1991b). REM stages showed an increase in [HbO] and a decrease in [Hb] consistent with an increase of the cerebral blood flow (Onoe et al., 1991). In another study on sleep stage transitions, Uchida-Ota et. al. (Uchida-Ota et. al., 2008) showed a high correlation between neural and vascular changes during transitions from waking to sleep and sleep to waking. NIRS sleep studies have typically focused on identifying patterns or trends in hemodynamic changes within specific sleep stages without consideration of their frequency band. One study based on a frequency dependent analysis (LFOs) across sleep stages, has reported a decreased hemodynamic activity during sleep with respect to waking condition, and a lower activity during deeper sleep stages with respect to light sleep or REM sleep (Nasi et al., 2011).
In this work, we investigate LFO components of [Hb] and [HbO]. This selective strategy allowed us to investigate the phase relationship between [Hb] and [HbO] oscillations over different sleep stages as opposed to general temporal trends. We also propose a phasor-based analysis that builds on previous work by Zheng et al. (Zheng et al., 2010) to interpret the relative amplitude and phase of measured [Hb] and [HbO] oscillations in terms of underlying cerebral hemodynamic oscillations of CBV and CBFV. In this work we aim at identifying blood volume and blood flow velocity contributions to the measured concentrations of [Hb] and [HbO] with a focus on low frequency oscillations.
Materials and Methods
A. Experimental Setup and Measurement Protocol
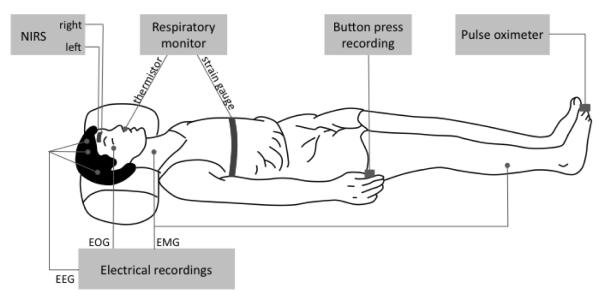
The NIRS measurements were performed with a commercial frequency-domain, multi-channel tissue spectrometer (OxiplexTS, ISS, Inc., Champaign, IL). The instrument featured sixteen intensity-modulated laser diodes, eight emitting at 690 nm and eight at 830 nm, and two photomultiplier tubes as optical detectors. Two multi-distance optical probes were placed on the left and right sides of the forehead of each subject. The experimental setup is shown in Fig. 1. The optical probes contained four source-detector separations of 1.0, 1.5, 2.0 and 2.5 cm. At each source location, two optical fibers delivered light at 690 and 830 nm. The eight sources on each optical probe were multiplexed (on-time of 10 ms per laser diode) to time share the optical detector resulting in a temporal resolution of 80 ms (sampling frequency: 12.5 Hz). In order to have a stable optical coupling between the optical fibers and the subject’s skin, the probes were kept in good contact with the subject’s forehead with a black flexible band. Simultaneously with the NIRS measurements, polysomnography data were acquired including electro-encephalography (EEG), electro-oculography (EOG), electro-myography (EMG), pulse oximetry, and monitoring of heart rate and respiration. EEG electrodes were placed on the scalp to cover the frontal, central and occipital areas of the brain. Specific electrodes were placed near the eyes (EOG), and additional electrodes were placed on both chin and legs to collect measurements of muscle activity (EMG). Synchronous acquisition of NIRS and EEG data was obtained by using a trigger signal from a button that was pressed at the beginning and at the end of each session. This button, which generated a pulse on both optical and electrical data recordings, was also available to the subject who pressed it every time he/she woke up during the night. Respiratory monitoring consisted of measurements with a strain gauge placed around the chest and with a thermistor placed at the subject’s nose. A pulse oximeter continuously monitored the heart rate, arterial pulsation, and arterial saturation. An experienced clinician used polysomnography data to perform sleep staging. Consecutive time windows of 30 s, covering the entire measurement session, were assigned to one of six options (awake, sleep stages 1, 2, 3, 4, and rapid eye movement (REM) sleep) according to standard criteria of Rechtschaffen and Kales (Rechtschaffen and Kales 1968). Although the American Academy of Sleep Medicine (AASM) has introduced a new sleep classification in 2007 (Iber et al. 2007), we have decided to retain the Rechtschaffen and Kales criteria as they were the clinical standard at the time of sleep classification reported in this work. As a point of reference, we note that in the new AASM guidelines, sleep stage 1 (indicated as N1) is generally known as somnolence (Kjaer et al., 2002), stage 2 (indicated as N2) is sometimes referred to as light sleep state (Madsen et al., 1991a), sleep stages 3 and 4 are combined into a slow-wave sleep state (indicated as N3), and REM sleep is indicated as stage R (Tasali et al., 2008).
Fig. 1.
Experimental arrangement for the all-night study with near-infrared spectroscopy (NIRS) measurements on the subject’s forehead and polysomnography recordings. Two optical probes were placed on the right and left sides of the subject’s forehead, each probe featuring multiple source-detector separations of 1.0, 1.5, 2.0, 2.5 cm. Electro-encephalography (EEG), electro-oculography (EOG) and electro-myography (EMG) electrodes were placed on the subject’s head, chin, and legs. Arterial saturation and heart rate were recorded from a toe with a pulse-oxymeter. A button press recording used to synchronize EEG and NIRS acquisitions, and to record subject’s awakenings, was positioned on the bed for easy reach with a hand by the subject.
During the entire night, the subjects were videotaped with a recorded time signature to allow for subsequent assessment of subject’s movement. Data were acquired during all-night sleep sessions on five healthy human subjects, indicated by the letters F, D, C, G and E. The duration of the measurements and relevant information on the sessions for the five subjects are reported in Table I. The New England Medical Center (NEMC), currently Tufts Medical Center, Institutional Review Board approved the protocol. All measurements were collected at the EEG Laboratory of the NEMC in Boston, MA, and all subjects gave their written informed consent.
Table I.
Relevant information on the five subjects and whole-night sleep measurement sessions.
| Duration of individual stages (min) |
|||||||||||
|---|---|---|---|---|---|---|---|---|---|---|---|
| ID | Gender (M/F) |
Age (yrs) |
Sleep apnea |
Mismatch with sleep propensity onset (hrs) |
Total duration (hrs) |
Awake | S1 | S2 | S3 | S4 | REM |
| F | F | 36 | NO | −0.5 | 7.2 | 68 | 32 | 180 | 51 | 27 | 74 |
| D | F | 29 | NO | −1.5 | 8.4 | 22 | 62 | 219 | 46 | 75 | 82 |
| C | M | 36 | NO | +1 | 8.5 | 75 | 63 | 246 | 56 | 17 | 53 |
| G | M | 44 | NO | +2 | 7.5 | 27 | 77 | 203 | 58 | 19 | 66 |
| E | M | 52 | YES | +2.5 | 6.4 | 69 | 140 | 124 | 32 | - | 19 |
B. Data analysis
Light intensity changes at each wavelength (690 and 830 nm) were measured with respect to a baseline value given by the average over an initial time window of 20 s, and translated into absorption changes by applying the modified Beer-Lambert law (mBLL) (Delpy et al., 1988; Sassaroli and Fantini 2004). The mBLL requires knowledge of the differential optical pathlength (DPF), which was obtained for each subject from multi-distance, frequency-domain measurements of the absolute optical properties (absorption and reduced scattering coefficients) measured at rest before sleep onset. Specifically, the DPF was calculated by using explicit expressions as a function of the tissue optical properties, as derived from diffusion theory (Fantini et al., 1999).
Third-order polynomial detrending was applied to the absorption changes in order to eliminate temporal drifts. Detrending procedures are extremely important especially when Fourier analysis is performed. In fact, adding a linear trend to a sinusoidal wave introduces spectral contributions over the entire frequency axis, especially in the low-frequency range, thus significantly affecting the frequency spectrum (Lo et al., 2009). Additionally, a linear trend contributes to the Fourier phase with a phase estimated to be in the range π/2-π as shown by Lo et al. (Lo et al., 2009). This fact should be considered when a frequency analysis is conducted, and especially in the study of phase relationships between signals using Fourier methods such as Transfer Function Analysis (TFA). In TFA, non-removed trends in the signals may result in an overestimation of the phase shift between the measured signals. The detrended absorption changes were processed by a linear-phase finite impulse response (FIR) filter based on the Parks-McClellan algorithm (Parks and McClellan 1972) restricted to the LFOs range, which in our study was chosen as 0.04-0.12 Hz, where most of the spectral power was found. Measured oxy-hemoglobin and deoxy-hemoglobin concentrations ([HbO]M and [Hb]M, respectively) were quantified in terms of the absorption coefficients at the two wavelengths ( and ) as follows:
| (1) |
| (2) |
where , , , are the molar extinction coefficients of HbO and Hb at 690 and 830 nm as indicated by the subscripts and superscripts. The phase difference between the LFOs of and , and between the LFOs of [Hb]M and [HbO]M in the selected frequency band (0.04-0.12 Hz) was determined by the analytic signal method. This method has been previously applied to brain studies. Examples are EEG recordings aimed at evaluating synchronization between cortical states on the scalp (Freeman et al., 2003), and magnetoencephalography (MEG) studies on patients affected by Parkinson’s disease (Tass et al., 1998). This method was also applied to a NIRS study where the instantaneous phase difference was measured between [Hb]M and [HbO]M oscillations (~0.1Hz) on sleeping infants (Taga et al., 2000). The analytic signal, v(t), is a complex extension of a real signal s(t) where the imaginary part is given by the Hilbert Transform of the real signal, s̃(t) (Gabor 1946):
| (3) |
| (4) |
Equation (3) defines the instantaneous amplitude A(t)(also known as the envelope of the real signal s(t)) and the instantaneous phase of the signal Φ(t). Equation (4) gives the Hilbert Transform of the original signal and represents its quadrature components (P.V. indicates that the integral is taken in the sense of the Cauchy principal value). We note that while any signal can be extended according to Eq. (3), the amplitude and phase do not always have a meaningful physical meaning unless the Fourier spectra of A(t) and Φ(t) are non-overlapping, a condition commonly fulfilled by band-limited signals (Boashash 1992). Additionally, it is important to point out that biological systems are usually characterized by non-stationary behaviors. Phase measurements based on Fourier analysis do not emphasize any local signal non-stationarities since the signal is fitted with cosine waves of different amplitudes and frequencies concurrently for its entire duration. Methods based on Fourier analyses, such as the TFA (Obrig et al., 2000; Tian et al., 2011), present some limitations associated with the assumptions of linearity and stationarity of the data. They also do not allow for measurements of instantaneous phase. By contrast, the analytic signal approach affords instantaneous phase measurements, monitoring the time evolution of non-stationary data and provides data suitable for statistical analysis. Synchronization of two signals is indicated by a peaked distribution of the phase difference of the two signals, whereas a uniform phase distribution implies no synchronization.
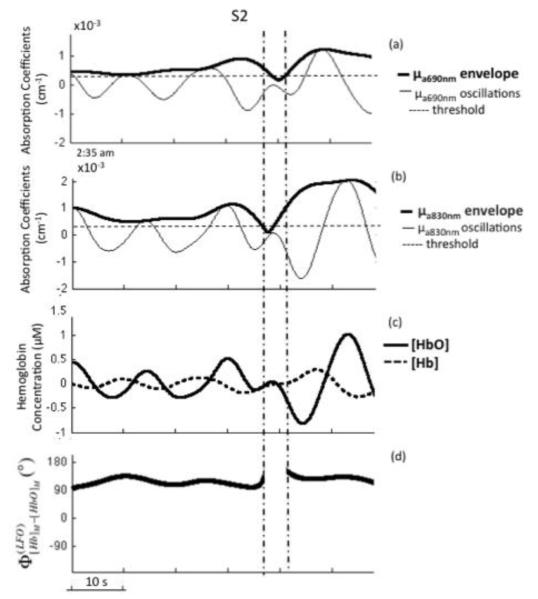
Phase analysis was performed only under restricted conditions that guarantee that the examined signals do have significant oscillatory components over the LFOs frequency band. Both amplitudes of the analytic signals associated with and were required to be above a given threshold (representing instrumental noise), set at 2.5×10⁻⁴cm−1 on the basis of previous measurements on tissue-like phantoms (Fig. 2). We did not perform phase analysis on portions of the data affected by artifacts associated with subject’s motion, as identified by a removal algorithm based on a moving standard deviation and spline interpolation (Scholkmann et al., 2010).
Fig. 2.
Band-pass filtered (0.04-0.12 Hz) time traces of absorption coefficients at 690 nm () (panel (a)), and at 830 nm () (panel (b)) measured on the left side of the forehead of subject F during sleep stage 2 (S2). Thick lines in panels (a) and (b) are the envelope traces as given by the magnitude of the corresponding analytic signal. The horizontal dashed lines at 2.5×10⁻⁴ cm−1 indicate the threshold value that was applied to identify oscillations with an amplitude above noise level. (c) Corresponding low frequency oscillations of oxy-hemoglobin and deoxy-hemoglobin concentrations ([HbO] and [Hb]). (d) Instantaneous phase difference between the LFOs of [Hb] and [HbO], showing the gap between vertical lines, when not both absorption oscillations amplitudes were above threshold.
To investigate the physiological origin of the LFOs for the measured concentrations of HbO and Hb, we applied a previously proposed phasor representation (Zheng et al., 2010). Here, we assume that the measured spontaneous LFOs of [HbO] and [Hb] result from LFOs in the local blood flow velocity and blood volume, since it is expected that other parameters such as oxygen consumption, arterial saturation, and blood hemoglobin concentration do not feature spontaneous oscillations at the low-frequencies examined here. As a result, all LFOs associated with measured hemoglobin concentrations (subscript “M”), and with hemoglobin concentrations due to local blood flow velocity (subscript “F”), and local blood volume (subscript “V”) can be represented by phasors that obey the following vectorial relationships:
| (5) |
| (6) |
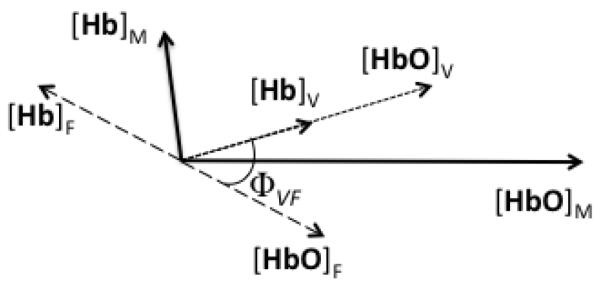
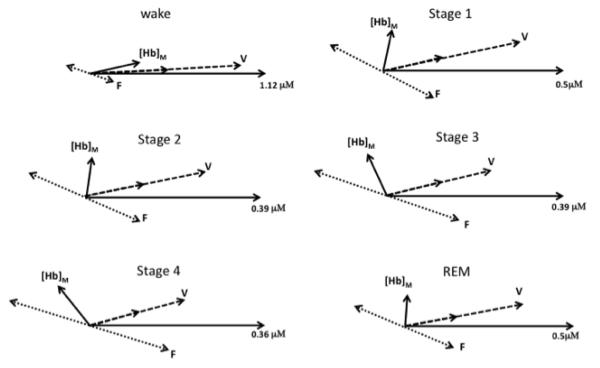
This is illustrated in Fig. 3, where all phasors rotate counterclockwise at the frequency of the LFOs (for phasors, the superscript LFO is implied). From Eqs. (5) and (6), one can write the amplitudes of the measured hemoglobin concentration phasors ( and ), and the tangent of their phase difference () in terms of the amplitudes of the blood volume ( and ) and blood flow velocity ( and ) hemoglobin concentration phasors, and their relative phase ΦVF:
| (7) |
| (8) |
| (9) |
where k = (1-SO2V)/SO2V, with SO2V representing the hemoglobin saturation of the blood compartment associated with the volume oscillations (i.e. ). We observe here that blood volume oscillations are associated with phasors [HbO]V and [Hb]V that are in phase with each other and that have relative amplitudes determined by . Blood flow velocity oscillations were found to be associated with phasors [HbO]F and [Hb]F that are out of phase by π and have equal amplitudes () (see Fig. 3). It is a phase difference between flow velocity and blood volume oscillations that induces out-of-phase measured phasors [HbO]M and [Hb]M. Because the left hand sides of Eqs. (7)-(9) are measured, by assuming a value for the saturation of the oscillating blood compartment (SO2V), one can use the nonlinear system of Eqs. (7)-(9) to obtain the amplitudes of the oxy-hemoglobin concentration LFOs associated with blood volume and flow velocity LFOs ( and ) and their relative phase (ΦVF). The corresponding deoxy-hemoglobin concentration LFOs are then given by the phasor relationships [Hb]V = k[HbO]V and [Hb]F = −[HbO]F
Fig. 3.
Phasor representation of low frequency oscillations (LFOs) of [HbO] and [Hb] associated with local blood flow velocity LFOs (subscript “F”) and local blood volume LFOs (subscript “V”), which combine by vector summation into the measured phasors of [HbO] and [Hb] (subscript “M”). In equations:, and. The angle is the [HbO]M = [HbO]F + [HbO]V, and [Hb]M = [Hb]F + [Hb]V. The angle ΦVF is the relative phase of blood volume vs. flow velocity LFOs.
We used circular statistics for the analysis of phase data (Zar 1999), and a circular histogram representation for the distribution of phase values. The circular histograms report the frequency of phase observations within thirty-six 10-degree bins that cover the entire angle range of 0°-360°. By indicating the frequency of observations for bin i with fi (= ni/N with ni number of measurements in bin i and N total number of measurements), we also define a resultant vector r as follows:
| (10) |
where Φi is the center angle of bin. The phase of the vector r, which is also indicated in the circular histograms, is the average phase of the distribution, while its magnitude gives a measure of the level of phase synchronization. The magnitude of r ranges between 0 and 1, 0 for uniform or π-symmetrical phase distributions and 1 for a phase distribution peaked within a single bin. The standard error for both linear and angular data (required by the statistical t-tests) was estimated by taking into account the level of autocorrelation intrinsically introduced by the filtering process. Indeed, when data are autocorrelated, the theoretical standard error needs to be modified as follows considering the autocorrelation function of the data (Wei 1994):
| (11) |
where is the standard error, σ is the sample standard deviation, n is the sample size, k is the kth time-lag of the autocorrelation function and φk is the value of the autocorrelation function at k. Here φk is normalized so that the self-covariance at zero lag is equal to 1. On the basis of random number simulations, we have retained only γk values above a threshold of 0.2 in the application of Eq. (11) for the standard error evaluation. The angular standard deviation was calculated as according to circular statistics theory (Zar 1999).
Independent two samples t-tests for unequal sample sizes were performed to test whether the difference between the amplitude means of two sleep stages were statistically significant. Watson’s test (Zar 1999) was used to test the null hypothesis that the mean phases of two distributions are the same.
Results
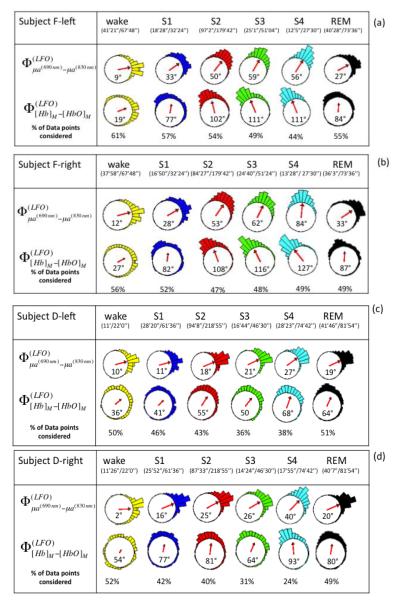
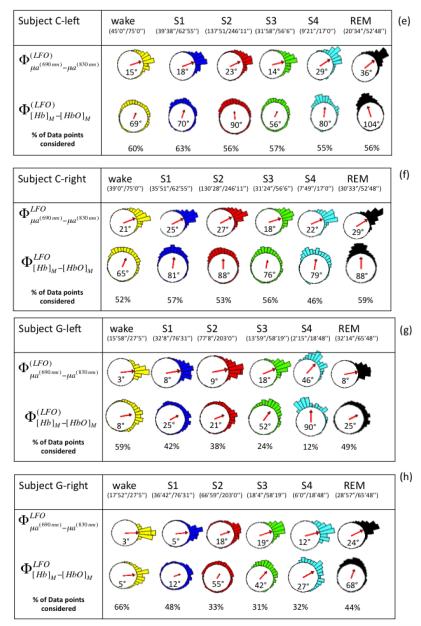
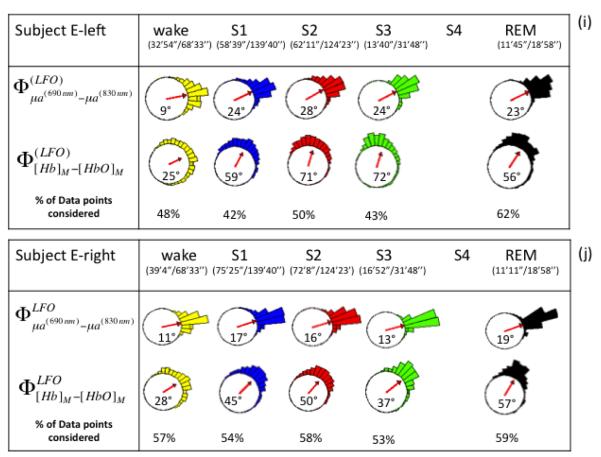
Figure 2 shows representative absorption LFOs at 690 nm (panel (a)) and 830 nm (panel (b)), together with their envelopes (amplitude of the analytic signal) and the threshold values that identify reliable oscillations for phase analysis. Associated [Hb] and [HbO] oscillations are shown in Fig. 2(c), and their relative phase is shown in Fig. 2(d). These representative traces were measured on subject F, left side during sleep stage 2 (S2). Figure 2 illustrates the threshold criteria for phase analysis; no phase measurements were performed between the two vertical lines in Fig. 2, where the amplitudes of the absorption oscillations are not both above threshold. We performed phase analysis to measure the relative phase of absorption LFOs (690 nm vs. 830 nm) and measured LFOs of hemoglobin concentrations ( vs. ). First, instantaneous phase values were calculated for each signal based on Eq. (3), and then the relative phase values were obtained by taking their instantaneous difference. On the left and right sides for all five subjects, Figure 4 reports the circular histograms of the relative phase of absorption LFOs () and hemoglobin LFOs () for the largest source-detector separation of 2.5 cm. We report relative phase measurements of both absorption coefficients (690 vs. 830nm) and hemoglobin concentrations ([Hb] vs [HbO]) to guarantee that the phase measurements are not dominated by noise and to monitor the relationship between these two phase measurements (Pierro et al, SPIE 2011). The percentage of data points that fulfills the threshold requirement for phase analysis is provided in all panels of Fig. 4 as “% of points considered” for each subject’s state (awake, S1-S4, REM) for which the total duration is also indicated in minutes and seconds. The histograms of Fig. 4 are peaked, and are associated with resultant vectors r (defined in Eq. (10)) that have magnitudes that are significantly greater than 0. All subjects showed average phase differences (indicated by the angles of the resultant vectors r displayed inside the circles) indicating that absorption LFOs at 690 nm lead those at 830 nm, whereas [Hb] LFOs lead [HbO] LFOs. More specifically, across all subjects the average phase difference ranges between 2° and 84°, while the average phase difference ranges between 5° and 127°. By observing the evolution of the average absorption and hemoglobin LFOs phase over the awake state (wake), non-REM sleep stages 1-4 (S1-S4), and REM sleep (REM), similar trends are found on the left side (Fig. 4(a), (c), (e), (g), (i)) and right side (Fig. 4(b), (d), (f), (h), (j)). Significant phase differences were observed across sleep stages. Observed in all subjects on both forehead sides, is an increasing trend in both absorption and hemoglobin concentration LFO phase differences going from awake conditions to deeper sleep stages (S3 and S4). In most cases (subject F both sides, subject D both sides, subject G left side, subject E left side), REM sleep features a partial recovery of the absorption and hemoglobin phase difference toward the awake phase values, while in the other cases (subject C both sides, subject G right side, subject E right side) the phase during REM sleep remains at values comparable or even greater than those of deep sleep stages.
Fig. 4.
(a)-(j) Circular histograms and vector representation of the phase difference of μa690 vs. μa830 (φμa690-φμa830) and [Hb] vs. [HbO] (φ[Hb]-φ[HbO])) in the LFO frequency range for all subjects (F, D, C, G, E) during awake condition, non-REM sleep stages (S1, S2, S3, S4), and REM sleep. Vectors inside the circular histogram point to the average angles and their length is related to the variance of the distribution. Below each state (wake, S1, S2, S3, S4, REM), we report the time length of the data suitable for phase analysis and the total duration of that state. The percentage of points that fulfills the criteria for phase analysis is shown in the last row of each panel (% of data points condered). Data from the left and right sides for each subject are shown.
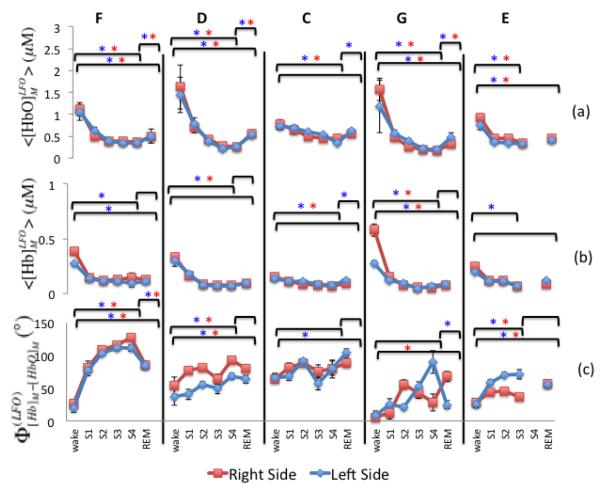
Amplitude values of the measured [HbO] and [Hb] LFOs ( and ) were calculated using Eq. (3) (i.e. envelope values) and averaged over each sleep condition for the farthest source-detector distance (2.5 cm). Results are displayed in Fig. 5(a) for and Fig. 5(b) for . A common trend is observed for both species of hemoglobin across all subjects, and for both left and right hemispheres. From the wake condition to slow-wave sleep stages (S3, S4) there is a progressive decrease in the amplitude of the LFOs of hemoglobin concentrations that is statistically significant in all subjects for , and in three subjects (F, C and G) for . A significant increase from stage 4 to REM sleep is observed in four subjects (F, D, C, G), whereas only subject C featured a significant increase in . It is interesting to note the similarity of and changes over different sleep stages measured on the two sides of the forehead (Figs. 5(a) and 5(b)). These results are consistent with those reported by Nasi et al. (Nasi et al., 2011) who found the power levels of both [Hb] and [HbO] oscillations to progressively decrease from the awake conditions into REM and deep sleep stages. Figure 5(c) reports the average phase difference between and over the various sleep states for all subjects and for both left and right sides, at a source-detector distance of 2.5 cm. Left and right hemispheres displayed similar phase trends except for Subject G, where opposite trends were found for S4 and REM stages. Figure 5(c) illustrates how wake conditions can be discriminated from slow-wave sleep stages (wake vs. S4 was statistically tested) on the basis of the relative phase of [Hb] and [HbO] low frequency oscillations.
Fig. 5.
Low frequency oscillation measurements. Average and standard error of (a) amplitude of measured [HbO], (b) amplitude of measured [Hb], and (c) phase difference between measured [Hb] and [HbO]. The letters F, D, C, G, E indicate the five subjects, and data from both sides are shown; left (dark gray) and right (light gray). The sleep state is indicated on the x axis. Significant differences between wake-S4, wake-REM, and S4-REM (p < 0.05) are indicated by * for the left side and * for the right side.
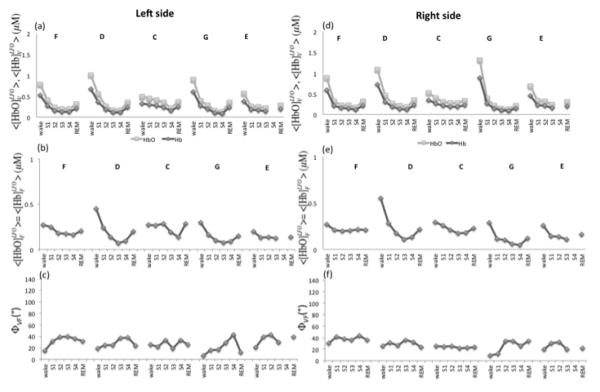
By applying Eqs. (7)-(9) with an assumed value of 60% for SO2V, we have determined the amplitude and the phase of the LFOs of oxy- and deoxy-hemoglobin associated with blood volume ([HbO]V and [Hb]V) and flow velocity ([HbO]F and [Hb]F). This choice for SO2V is based on the assumption that the largest contribution to blood volume changes derives mainly from the venous compartment since it has the largest compliance (Hall 2011). Figure 6 shows the results for the amplitudes of [HbO]V, [Hb]V, [HbO]F, and [Hb]F, as well as the phase (ΦVF) between the cerebral blood volume and flow velocity oscillations (as illustrated in the phasor diagram of Fig. 3). [HbO] and [Hb] oscillation amplitudes associated with blood volume LFOs (Fig. 6(a), Fig. 6(d)), and with flow velocity LFOs (Fig. 6(b), Fig. 6(e)) show the same trend as those of measured LFOs of oxy- and deoxy-hemoglobin concentrations (Figs. 5(a) and 5(b)), namely a decrease during non-REM sleep with partial recovery in REM sleep. By contrast, no significant changes are observed in the phase difference between the cerebral blood volume and the cerebral blood flow velocity (Figs. 6(c), 6(f)) during the various sleep stages. Our results indicate that the amplitude and phase changes observed in the measured LFOs of [Hb] and [HbO] during sleep are mainly a result of changes in the amplitude rather than the relative phase of volume and flow velocity oscillations.
Fig. 6.
(a) Left and (d) right side amplitudes of [HbO] and [Hb] oscillations associated with cerebral blood volume (CBV) LFOs for all subjects (F, D, C, G, E). In (a) and (d), [HbO]V is light grey and [Hb]V is dark grey. (b) Left and (e) right side amplitudes of [HbO] and [Hb] oscillations associated with cerebral blood flow velocity (CBFV) LFOs for all subjects (F, D, C, G, E). In (b) and (e), [HbO]F = [Hb]F. (c) Left and (f) right side phase differences between the LFOs associated with CBV and CBFV.
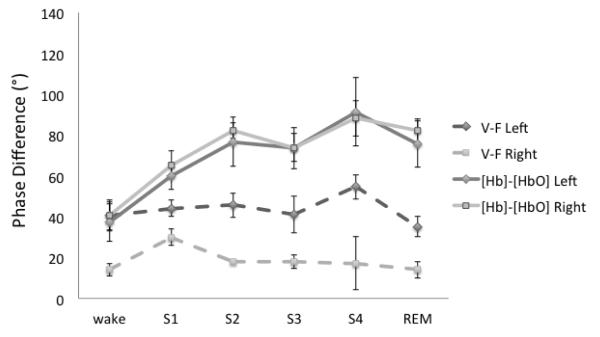
Figure 7 shows the phasor analysis for the awake state and various sleep stages for a representative case, subject F, right side. These phasor diagrams represent the solution of Eqs. (7)-(9). Figure 7 allows for a visual interpretation of the results of Fig. 4. In fact, the increase in the phase difference between [Hb]M and [HbO]M from stage 1 to stage 4 is mostly the result of amplitude changes of volume oscillations and flow velocity oscillations rather than changes in their relative phase. For the reported example, amplitude values of volume and flow velocity oscillations change by as much as 60%, whereas their relative phase (ΦVF) changes by a maximum of 12°. A summary of the phase measurements on both right and lefts sides is reported in Fig. 8 as an average across all subjects. Figure 8 shows that the relative phase of [Hb]M and [HbO]M LFOs changes significantly during sleep, while the relative phase of blood volume and flow velocity LFOs stays approximately constant during awake conditions and all sleep stages.
Fig. 7.
Phasor representation of the LFOs during various sleep conditions (wake, Stage1, Stage 2, Stage 3, Stage 4, REM). The numerical concentration quantifies the radial coordinate by specifying the amplitude of [HbO]M (the phasor of measured [HbO]) which is taken as the phase reference and thus is always represented by a horizontal phasor. The phasor of measured [Hb] is indicated by [Hb]M. The oxy-hemoglobin phasors associated with blood volume LFOs ([HbO]V) are indicated with V, while those associated with flow velocity ([HbO]F) are indicated with F. The corresponding deoxy-hemoglobin phasors are readily identified in the figure by recalling that [Hb]V = k[HbO]V and [Hb]F = −[HbO]F (see text for details).
Fig. 8.
Average across subjects for the low frequency oscillations phase of [Hb]M vs [HbO]M (φ[Hb]-φ[HbO]: solid lines), and blood volume vs flow velocity (ΦVF : dashed lines) during the various sleep conditions. Right side: squares; left side: diamonds.
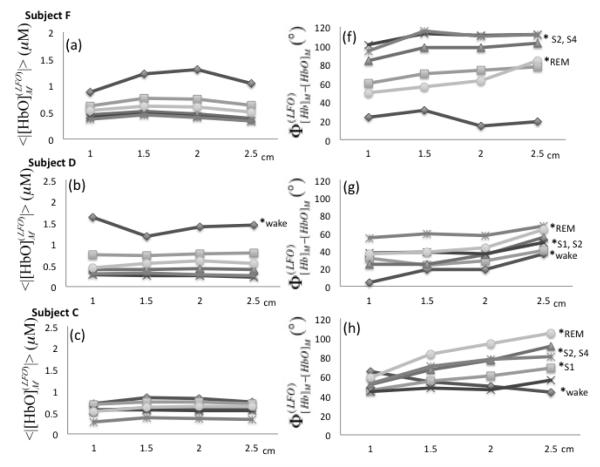
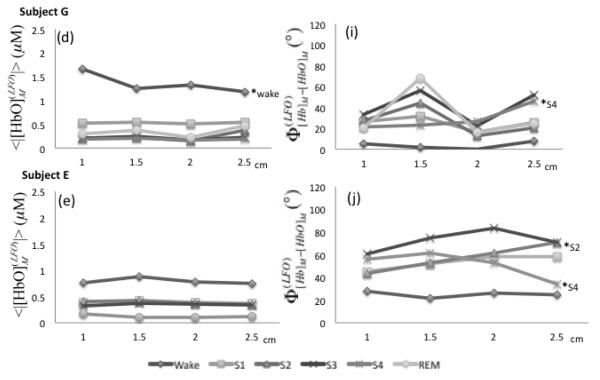
We have measured the amplitude and phase of [Hb]M and [HbO]M at four source-detector distances. Figure 9 (panels (a)-(e)) displays the amplitude of [HbO]M as a function of source-detector distance, where every continuous line represents a given condition (awake, sleep stages 1-4, REM sleep). The amplitude of [Hb]M is not shown because it features trends that are similar to those of [HbO]M. Results are shown for the left side only, as similar results were found on the right side. As reported in Fig. 5, there is a decreasing trend of the amplitudes from wake condition to non-REM sleep stages and a partial recovery in REM sleep. However, Fig. 9 shows that the amplitude values do not change significantly within the same stage at the four source-detector distances considered here (1.0-2.5 cm). These results are consistent with a spatially homogeneous distribution of the LFOs over the probed tissue. Phase analysis at different distances revealed two subjects (D and C) with significant phase differences between the shortest and farthest source-detector separation distance in most of the sleep stages (except S3 and S4 for subject D and S3 for subject C). Subject F also featured significant phase differences () for S2, S4 and REM sleep stages between data collected at 1 and 2.5 cm source-detector separation distance. These increasing phase differences as a function of source-detector separation are in agreement with results reported in two previous NIRS studies (Obrig et al., 2000)(Tian et al., 2011).
Fig. 9.
(a)-(e) Amplitudes of measured [HbO] LFOs as a function of source-detector distance in the range 1.0-2.5 cm (left side). (f)-(j) Phase difference between measured [Hb] and [HbO] LFOs. Sleep stages are indicated by different symbols. The shortest (1 cm) and farthest (2.5 cm) source-detector separation distances were compared within each sleep stage by t and U2 tests (p < 0.05 indicated by a * followed by the associated sleep stage).
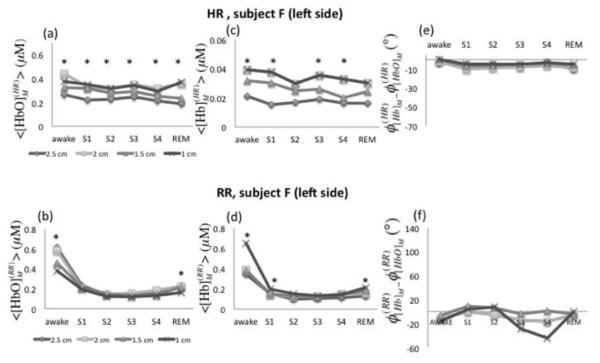
Oscillations of oxy- and deoxy-hemoglobin concentrations were also investigated for two additional frequency bands: the respiration rate (RR) frequency band (0.2-0.4 Hz) and the heart rate (HR) frequency band (0.8-1.2 Hz). Figure 10 shows the average amplitudes of [HbO]M and [Hb]M at the HR (panels (a) and (b)) and RR (panels (c) and (d)) for a representative case (subject F, left side), at the four source-detector distances and for all conditions. The amplitudes of [HbO]M and [Hb]M at the respiration rate (, , Figs. 10(b) and 10(d)) followed the negative trend observed for the LFOs. Similarly to the LFOs, 1.0 cm vs. 2.5 cm source-detector separation distances yielded a significant difference during awake and REM stages. Amplitudes values investigated at the heart rate frequency () showed significant differences through all of the stages at the shortest and farthest distances (1.0 vs. 2.5 cm) (Fig. 10(a)). also showed a significant difference (except S2 and REM) at 1.0 vs. 2.5 cm source-detector separation (Fig. 10(c)). In particular, the greater amplitude values found at the shortest distance are consistent with a superficial, extracerebral tissue origin of the hemodynamic changes at the heart beat frequency. Heart rate oscillations of oxy- and deoxy-hemoglobin concentrations did not show significant phase differences across sleep stages, which supports that hemodynamic changes originated in one compartment only (arterial). The fact that oscillations of [HbO]M and [Hb]M at the cardiac frequency are in phase is a robust result, which was also observed by Tian (Tian et al., 2011) and Obrig (Obrig et al., 2000).
Fig. 10.
Amplitude and relative phase of measured [HbO] and [Hb] oscillation at the heart rate (HR: ~1 Hz) and respiratory rate (RR: ~0.3 Hz) at four source-detector separations of 1.0, 1.5, 2.0, and 2.5 cm. (a) [HbO]M, (b) [Hb]M and (c) φ[Hb] - φ[HbO] of measured oscillations at the heart rate as a function of sleep stages. (b) [HbO]M, (d) [Hb]M and (f) φ[Hb]-φ[HbO] of measured oscillations at the respiratory rate as a function of sleep stages. Different distance values are displayed with different symbols. The shortest (1 cm) and farthest (2.5 cm) source-detector separation distances were compared within each sleep stage by t and U2 tests (p < 0.05 indicated by *).
Discussion
Our results demonstrate the power of phase analysis of low-frequency hemodynamic oscillations using the analytic signal approach. The application of this method to NIRS data from the prefrontal cortical region of human subjects during sleep has yielded two main results. The first result is that during non-REM sleep, there is a greater phase difference between [Hb] and [HbO] LFOs with respect to the awake and REM sleep states (Fig. 4, Fig. 5(c)). The second result is that during non-REM sleep, the amplitudes of [Hb] and [HbO] LFOs are suppressed with respect to the awake and REM sleep states (Fig. 5(a), (b)). A phasor representation (Fig. 3, Fig. 7) has allowed for the interpretation of these results in terms of cerebral blood volume and flow velocity oscillations, which are found to maintain their relative phase difference during sleep, whereas their amplitudes are attenuated during non-REM sleep (Fig. 6, Fig. 7). This latter result, which is the culmination of our phase analysis and phasor algebra decomposition, is consistent with a reported decrease in cerebral blood flow velocity during non-REM sleep (Kuboyama et al., 1997) even though our findings refer to oscillatory components of blood volume and flow velocity rather than stationary values. As a result, the methods presented here can provide information on a broader range of cerebral hemodynamic processes, as opposed to time-averaged, stationary values.
As mentioned above, the application of phasor algebra (Eqs. (5)-(9)) was based on the assumptions of a well-defined frequency of oscillations and a known saturation of the volume-oscillating vascular compartment. In the case of spontaneous oscillations, like the ones considered in this work, the first assumption is met by applying relatively narrow frequency band-pass filters. We have also considered narrower filters than the one reported in this work (0.04-0.12 Hz) and found comparable results. However, it is important to verify that the oscillations under analysis have a well-defined frequency in order to apply phasor algebra to interpret the data. In the case of forced or elicited oscillations, such as the case of paced breathing or evoked brain activation in regular block protocols, regular hemoglobin concentration oscillations may be induced that intrinsically lend themselves to phasor analysis. Regarding the second assumption, the saturation of the volume-oscillating vascular compartment, we argue that the venous compartment, being characterized by a compliance that is ~24 times larger than that of the arterial compartment (Hall 2011) is the one that is most susceptible to pressure-induced volume oscillations. This is why we have assumed a value of SO2V = 0.6, associated with jugular vein saturation (Gibbs et al., 1942), for the saturation of the volume-oscillating blood compartment. However, we have also investigated the sensitivity of our analysis to this choice. To this aim, we have repeated the analysis based on Eqs. (7-9) using SO2V values of 0.80 (indicative of a combination of capillary bed, venules, and arterioles), and 0.99 (indicative of arterial blood). The assumed value of SO2V has an effect on the recovered amplitude and relative phase of volume and flow velocity oscillations, with amplitude and phase that vary by as much as 50% and 80°, respectively, over the examined range 0.60-0.99 for SO2V. However, the effects of different values for SO2V are close to being offsets (multiplicative for the amplitude, additive for the phase) that do not affect the qualitative trends observed over the awake/sleep states. This analysis confirms the validity of our results even in the presence of physiological variability in the cerebral tissue oxygenation. Such variability may be significant especially in a sleep study of subjects with sleep apnea (as was the case for subject E in this study). We verified, however, that even in the case of subject E, cerebral tissue oxygenation did not vary by more than 10% over the entire measurement time, thus not affecting the validity of our analysis.
Another critical issue associated with our phasor analysis is the assumed linear combination of the contributions from blood volume and flow velocity oscillations to the measured [Hb] and [HbO] oscillations. For the small hemodynamic changes associated with the physiological oscillations of interest here, the non-linear relationships between blood volume and blood flow (Grubb et al., 1974), and between diffuse optical intensity and local tissue absorption changes (Delpy et al, 1988) are closely approximated by linear relationships. Such changes in the concentrations of oxy- and deoxy-hemoglobin are in the order of 1-2% at most (see Fig. 5, which shows amplitudes of hemoglobin concentration oscillations in the order of 0.1-1 μM out of baseline concentrations of ~50 μM), so that non-linearities become negligible. In particular, we have shown that the changes in [Hb] and [HbO] measured with NIRS are just a linear combination of the changes in tissue [Hb] and [HbO] (see Eqs. (3) and (4) in Zheng et al., 2010).
Due to the dependence of diffuse optical signals on the spatial location of the hemodynamic changes in tissue, the effects of a pure blood volume change in one tissue area and a pure flow velocity change in a different tissue area cannot just be summed as we are doing in our phasor addition. The blood volume contributions from one area and the flow velocity contribution from a different area would need to be assigned different and unknown weights in the linear superposition of phasors. By contrast, a straightforward phasor addition is fully justified for co-localized blood volume and flow velocity oscillations (Zheng et al., 2010). This co-localization assumption is reasonable given the strong interplay between blood volume changes (vascular dilation/contraction, opening/closing of capillaries) and blood flow velocity changes in the associated vasculature.
The phasor model presented here describes hemoglobin saturation (StO2) oscillations by being able to directly determining them from oscillations in [Hb] and [HbO]. If the oscillations in tissue [Hb] and [HbO], in addition to blood volume and flow velocity oscillations, also include contributions from oscillations in oxygen consumption, one needs to add two more unknowns (namely the amplitude and the phase of [HbO] changes induced by oxygen consumption oscillations) into the set of Equations (7)-(9). Consequently, to solve these equations one has to introduce additional constraints between the relative amplitude and/or phase of oscillations associated with blood volume, flow velocity, oxygen consumption. Alternatively, one may consolidate flow-velocity and oxygen-consumption contributions into one single pair of antiparallel [Hb] and [HbO] phasors which would take the place of [Hb]F and [HbO]F in Eqs. (7)-(9). However, we point out that even in the case of brain activation, which involves local changes in oxygen consumption, blood volume and flow velocity changes dominate the hemodynamic response measured by NIRS [Villringer and Chance, 1997]. Furthermore, oxygen consumption changes during motor cortex activation were found to be tightly coupled to blood flow changes (Buxton et al., 1997). If this is the case also for low frequency oscillations of cerebral hemodynamics (or their component associated with spontaneous brain activity), then the relative phase of blood volume and flow velocity reported in this work is minimally affected by neglecting oxygen consumption oscillations.
NIRS data collected on the adult’s head are sensitive to both extracerebral and cerebral tissue regions. The origin of the measured oscillations of oxy- and deoxy-hemoglobin concentrations can be localized in brain tissue, superficial extracerebral tissue layers, or a combination of them. The lack of depth discrimination is a common limitation of NIRS data. An effort in this direction, however, has been made in this study where data were collected using four source-detector separation distances. LFOs were detected at all distances and comparable concentration amplitudes were observed at each source-detector separation (Fig. 9). This result suggests a homogeneous distribution of the LFOs through the different interrogated layers, which is in agreement with high coherence values between measured at different depths as reported by Tian et al. (Tian et al., 2011). In fact, it has been observed that spontaneous low-frequency oscillations do have a systemic contribution that is not spatially localized (Katura et al., 2006). The dependence on source-detector separation of the amplitude and phase of the hemoglobin-related LFOs reported by Obrig et al. (Obrig et al., 2000) may reflect variability across subjects and spatial location on the head (Obrig et al. studied the visual cortex).
Conclusions
We have presented a non-invasive optical study of the phase and amplitude from oscillatory components of cerebral hemodynamics during sleep in human subjects. The analytical tools presented in this work, which are based on the analytic signal and phasor algebra, open up new opportunities in the field of functional NIRS studies of the brain. While this work has focused on the characterization of the phase and amplitude of spontaneous LFOs during the wake state, non-REM sleep stages, and REM sleep, the concepts presented here can be applied to a broad range of functional NIRS studies. Firstly, a robust method for instantaneous phase measurements lends itself to studies of temporal coherence and relative delay of signals measured at any given location, as well as studies of spatial connectivity from measurements that are spatially distributed over the brain cortex. Secondly, phasor analysis allows for the decomposition of measured oscillations in [Hb] and [HbO] at a specific frequency into oscillatory components associated with blood volume, flow velocity, oxygen consumption, etc. This is a powerful tool for the investigation of the physiological and metabolic origin of hemoglobin concentrations measured with NIRS, with direct applications to autoregulation and functional brain studies. In addition to spontaneous oscillations, one can elicit oscillations at well-defined frequencies by specific block protocols. Autoregulation studies (which investigate the relationship between blood pressure and blood flow velocity) would directly benefit from this novel tool that can provide local measurements as opposed to systemic or whole-organ measurements. Functional studies (which elicit blood volume, flow velocity, and oxygen consumption changes) can also benefit from a tool that can separate contributions from these underlying physiological processes. In this work, the application of these concepts to a sleep study has shown that the phase difference between spontaneous LFOs of cerebral [Hb] and [HbO] results from out-of-phase oscillations of cerebral blood volume and flow velocity. During non-REM sleep, these blood volume and flow velocity oscillations maintain a constant phase difference whereas their amplitudes decrease.
Acknowledgments
We thank Pamela G. Anderson for her critical review of the manuscript. This research is supported by NIH Grants R01-NS059933 and R03-MH093846, and by NSF Award IIS-1065154.
Footnotes
Publisher's Disclaimer: This is a PDF file of an unedited manuscript that has been accepted for publication. As a service to our customers we are providing this early version of the manuscript. The manuscript will undergo copyediting, typesetting, and review of the resulting proof before it is published in its final citable form. Please note that during the production process errors may be discovered which could affect the content, and all legal disclaimers that apply to the journal pertain.
References
- Biswal B, Yetkin FZ, Haughton VM, Hyde JS. Functional connectivity in the motor cortex of resting human brain using echo-planar MRI. Magnetic Resonance in Medicine: Official Journal of the Society of Magnetic Resonance in Medicine/Society of Magnetic Resonance in Medicine. 1995;34(4):537–541. doi: 10.1002/mrm.1910340409. [DOI] [PubMed] [Google Scholar]
- Beckmann CF, DeLuca M, Devlin TJ, Smith SM. Investigations into resting-state connectivity using independent component analysis. Phil. Trans. R. Soc. B. 2005;360:1001–1013. doi: 10.1098/rstb.2005.1634. [DOI] [PMC free article] [PubMed] [Google Scholar]
- Boashash B. Estimating and interpreting the instantaneous frequency of a signal. I. fundamentals. Proceedings of the IEEE. 1992;80(4):520–538. [Google Scholar]
- Buxton RB, Wong EC, Frank LR. Dynamics of blood flow and oxygenation changes during brain activation: The balloon model Magn. Reson. Med. 1998;39:855–864. doi: 10.1002/mrm.1910390602. [DOI] [PubMed] [Google Scholar]
- Chance B, Zhuang Z, UnAh C, Alter C, Lipton L. Cognition-activated low-frequency modulation of light absorption in human brain. Proceedings of the National Academy of Sciences of the United States of America. 1993;90(8):3770–3774. doi: 10.1073/pnas.90.8.3770. [DOI] [PMC free article] [PubMed] [Google Scholar]
- Delpy DT, Cope M, van der Zee P, Arridge S, Wray S, Wyatt J. Estimation of optical pathlength through tissue from direct time of flight measurement. Physics in Medicine and Biology. 1988;33(12):1433–1442. doi: 10.1088/0031-9155/33/12/008. [DOI] [PubMed] [Google Scholar]
- Diamond SG, Perdue LK, Boas DA. A cerebrovascular response model for functional neuroimaging including dynamic cerebral autoregulation. Math. Biosci. 2009;220:102–117. doi: 10.1016/j.mbs.2009.05.002. [DOI] [PMC free article] [PubMed] [Google Scholar]
- Elwell CE, Owen-Reece H, Wyatt JS, Cope M, Reynolds EO, Delpy DT. Influence of respiration and changes in expiratory pressure on cerebral haemoglobin concentration measured by near infrared spectroscopy. Journal of Cerebral Blood Flow and Metabolism: Official Journal of the International Society of Cerebral Blood Flow and Metabolism. 1996;16(2):353–357. doi: 10.1097/00004647-199603000-00022. [DOI] [PubMed] [Google Scholar]
- Fantini S, Hueber D, Franceschini MA, Gratton E, Rosenfeld W, Stubblefield PG, Maulik D, Stankovic MR. Non-invasive optical monitoring of the newborn piglet brain using continuous-wave and frequency-domain spectroscopy. Physics in Medicine and Biology. 1999;44(6):1543–1563. doi: 10.1088/0031-9155/44/6/308. [DOI] [PubMed] [Google Scholar]
- Fantini S. A haemodynamic model for the physiological interpretation of in vivo measurements of the concentration and oxygen saturation of haemoglobin. Physics in Medicine and Biology. 2002;47(18):N249–57. doi: 10.1088/0031-9155/47/18/402. [DOI] [PubMed] [Google Scholar]
- Fantini S, Aggarwal P, Chen K, Franceschini MA, Ehrenberg BL. Near-infrared spectroscopy and polysomnography during all-night sleep in human subjects. 2003:155–162. [Google Scholar]
- Freeman WJ, Burke BC, Holmes MD. Aperiodic phase re-setting in scalp EEG of beta-gamma oscillations by state transitions at alpha-theta rates. Human Brain Mapping. 2003;19(4):248–272. doi: 10.1002/hbm.10120. [DOI] [PMC free article] [PubMed] [Google Scholar]
- Gabor D. Theory of communication. J. IEEE. 1946;93:429. [Google Scholar]
- Gibbs EL, Lennox WG, Nim,s LF, Gibbs FA. Arterial and cerebral venous blood: Arterial-venous differences in man. Journal of Biological Chemistry. 1942;144:325–332. [Google Scholar]
- Giller CA, Mueller M. Linearity and non-linearity in cerebral hemodynamics. Medical Engineering & Physics. 2003;25(8):633–646. doi: 10.1016/s1350-4533(03)00028-6. [DOI] [PubMed] [Google Scholar]
- Grubb RL, Jr, Raichle ME, Eichling JO, Ter-Pogossian MM. The effects of changes in PaCO2 on cerebral blood volume, blood flow, and vascular mean transit time. Stroke; a Journal of Cerebral Circulation. 1974;5(5):630–639. doi: 10.1161/01.str.5.5.630. [DOI] [PubMed] [Google Scholar]
- Hall JE. Guyton and hall textbook of medical physiology. 12th edition W.B. Saunders Company; 2011. [Google Scholar]
- Hausser-Hauw C, Rakotonanahary D, Fleury B. Obstructive-sleep apnea syndrome: Brain oxygenation measured with near-infrared spectroscopy. preliminary results. Neurophysiologie Clinique = Clinical Neurophysiology. 2000;30(2):113–118. doi: 10.1016/s0987-7053(00)00063-0. [DOI] [PubMed] [Google Scholar]
- Hayakawa T, Terashima M, Kayukawa Y, Ohta T, Okada T. Changes in cerebral oxygenation and hemodynamics during obstructive sleep apneas. Chest. 1996;109(4):916–921. doi: 10.1378/chest.109.4.916. [DOI] [PubMed] [Google Scholar]
- Hock C, Villringer K, Muller-Spahn F, Wenzel R, Heekeren H, Schuh-Hofer S, Hofmann M, Minoshima S, Schwaiger M, Dirnagl U, Villringer A. Decrease in parietal cerebral hemoglobin oxygenation during performance of a verbal fluency task in patients with alzheimer’s disease monitored by means of near-infrared spectroscopy (NIRS)--correlation with simultaneous rCBF-PET measurements. Brain Research. 1997;755(2):293–303. doi: 10.1016/s0006-8993(97)00122-4. [DOI] [PubMed] [Google Scholar]
- Hoshi Y, Tamura M. Detection of dynamic changes in cerebral oxygenation coupled to neuronal function during mental work in man. Neuroscience Letters. 1993;150(1):5–8. doi: 10.1016/0304-3940(93)90094-2. [DOI] [PubMed] [Google Scholar]
- Iber C, Ancoli-Israel IL, et al. The AASM manual for the scoring of sleep and associated events: Rules, terminology, and technical specification. 1st, american academy of sleep medicine; westchester: 2007. [Google Scholar]
- Katura T, Tanaka N, Obata A, Sato H, Maki A. Quantitative evaluation of interrelations between spontaneous low-frequency oscillations in cerebral hemodynamics and systemic cardiovascular dynamics. NeuroImage. 2006;31(4):1592–1600. doi: 10.1016/j.neuroimage.2006.02.010. [DOI] [PubMed] [Google Scholar]
- Kjaer TW, Law I, Wiltschiotz G, Paulson OB, Madsen PL. Regional cerebral blood flow during light sleep--a H(2)(15)O-PET study. Journal of Sleep Research. 2002;11(3):201–207. doi: 10.1046/j.1365-2869.2002.00303.x. [DOI] [PubMed] [Google Scholar]
- Kleinschmidt A, Obrig H, Requardt M, Merboldt KD, Dirnagl U, Villringer A, Frahm J. Simultaneous recording of cerebral blood oxygenation changes during human brain activation by magnetic resonance imaging and near-infrared spectroscopy. Journal of Cerebral Blood Flow and Metabolism: Official Journal of the International Society of Cerebral Blood Flow and Metabolism. 1996;16(5):817–826. doi: 10.1097/00004647-199609000-00006. [DOI] [PubMed] [Google Scholar]
- Kuboyama T, Hori A, Sato T, Mikami T, Yamaki T, Ueda S. Changes in cerebral blood flow velocity in healthy young men during overnight sleep and while awake. Electroencephalography and Clinical Neurophysiology. 1997;102(2):125–131. doi: 10.1016/s0921-884x(96)95054-7. [DOI] [PubMed] [Google Scholar]
- Latka M, Turalska M, Glaubic-Latka M, Kolodziej W, Latka D, West BJ. Phase dynamics in cerebral autoregulation. Am. J. Physiol. Heart Circ. Physiol. 2005;289:H2272–H2279. doi: 10.1152/ajpheart.01307.2004. [DOI] [PubMed] [Google Scholar]
- Lo MT, Novak V, Peng CK, Liu Y, Hu K. Nonlinear phase interaction between nonstationary signals: A comparison study of methods based on hilbert-huang and fourier transforms. Physical Review.E, Statistical, Nonlinear, and Soft Matter Physics. 2009;79(6 Pt 1):061924. doi: 10.1103/PhysRevE.79.061924. [DOI] [PMC free article] [PubMed] [Google Scholar]
- Lu CM, Zhang YJ, Biswal BB, Zang YF, Peng DL, Zhu CZ. Use of fNIRS to assess resting state functional connectivity. Journal of Neuroscience Methods. 2010;186(2):242–249. doi: 10.1016/j.jneumeth.2009.11.010. [DOI] [PubMed] [Google Scholar]
- Madsen PL, Schmidt JF, Holm S, Vorstrup S, Lassen NA, Wildschiodtz G. Cerebral oxygen metabolism and cerebral blood flow in man during light sleep (stage 2) Brain Research. 1991a;557(1-2):217–220. doi: 10.1016/0006-8993(91)90137-k. [DOI] [PubMed] [Google Scholar]
- Madsen PL, Schmidt JF, Wildschiodtz G, Friberg L, Holm S, Vorstrup S, Lassen NA. Cerebral O2 metabolism and cerebral blood flow in humans during deep and rapid-eye-movement sleep. Journal of Applied Physiology (Bethesda, Md.: 1985) 1991b;70(6):2597–2601. doi: 10.1152/jappl.1991.70.6.2597. [DOI] [PubMed] [Google Scholar]
- Mandeville JB, Marota JJA, Ayata C, Zaharchuk G, Moskowitz MA, Rosen BR, Weisskoff RM. Evidence of a cerebrovascular postarteriole windkessel with delayed compliance. J. Cereb. Blood Flow Metab. 1999;19:679–689. doi: 10.1097/00004647-199906000-00012. [DOI] [PubMed] [Google Scholar]
- Matsuo A, Inoue Y, Namba K, Chiba H. Changes in cerebral hemoglobin indices in obstructive sleep apnea syndrome with nasal continuous positive airway pressure treatment. Sleep & Breathing = Schlaf & Atmung. 2010 doi: 10.1007/s11325-010-0367-y. [DOI] [PubMed] [Google Scholar]
- Mayhew JE, Askew S, Zheng Y, Porrill J, Westby GW, Redgrave P, Rector DM, Harper RM. Cerebral vasomotion: A 0.1-hz oscillation in reflected light imaging of neural activity. NeuroImage. 1996;4(3 Pt 1):183–193. doi: 10.1006/nimg.1996.0069. [DOI] [PubMed] [Google Scholar]
- Michalos A, Paunescu LA, Wolf M, Wolf U, Toronov V, Gratton E. Assessment of cerebral oxygenation and hemodynamics in obstructive sleep apnea syndrome. Biomedical Optical Spectroscopy and Diagnostics. 2000;38:SuH16. [Google Scholar]
- Murakami Y, Yamashita Y, Matsuishi T, Iwanaga R, Kato H. Cerebral oxygenation and hemodynamics during hyperventilation and sleep in patients with rett syndrome. Brain & Development. 1998;20(8):574–578. doi: 10.1016/s0387-7604(98)00053-9. [DOI] [PubMed] [Google Scholar]
- Nasi T, Virtanen J, Noponen T, Toppila J, Salmi T, Ilmoniemi RJ. Spontaneous hemodynamic oscillations during human sleep and sleep stage transitions characterized with near-infrared spectroscopy. PloS One. 2011;6(10):e25415. doi: 10.1371/journal.pone.0025415. [DOI] [PMC free article] [PubMed] [Google Scholar]
- Nilsson H, Aalkjaer C. Vasomotion: Mechanisms and physiological importance. Molecular Interventions. 2003;3(2):79–89. 51. doi: 10.1124/mi.3.2.79. [DOI] [PubMed] [Google Scholar]
- Obrig H, Neufang M, Wenzel R, Kohl M, Steinbrink J, Einhaupl K, Villringer A. Spontaneous low frequency oscillations of cerebral hemodynamics and metabolism in human adults. NeuroImage. 2000;12(6):623–639. doi: 10.1006/nimg.2000.0657. [DOI] [PubMed] [Google Scholar]
- Onoe H, Watanabe Y, Tamura M, Hayaishi O. REM sleep-associated hemoglobin oxygenation in the monkey forebrain studied using near-infrared spectrophotometry. Neuroscience Letters. 1991;129(2):209–213. doi: 10.1016/0304-3940(91)90463-4. [DOI] [PubMed] [Google Scholar]
- Parks T, McClellan J. Chebyshev approximation for nonrecursive digital filters with linear phase. Circuit Theory, IEEE Transactions on. 1972;19(2):189–194. [Google Scholar]
- Payne SJ, Mohammad J, Tisdall MM, Tachtsidis I. Effects of arterial blood gas levels on cerebral blood flow and oxygen transport. Biomedical Optics Express. 2011;2(4):966–979. doi: 10.1364/BOE.2.000979. [DOI] [PMC free article] [PubMed] [Google Scholar]
- Peng T, Ainslie PN, Cotter JD, Murrell C, Thomas K, Williams MJ, George K, Shave R, Rowley AB, Payne SJ. The effects of age on the spontaneous low-frequency oscillations in cerebral and systemic cardiovascular dynamics. Physiological Measurement. 2008;29(9):1055–1069. doi: 10.1088/0967-3334/29/9/005. [DOI] [PubMed] [Google Scholar]
- Pierro M, Sassaroli A, Zheng F, Fantini S. Phase characterization of oscillatory components of the cerebral concentrations of oxy- and deoxy-hemoglobin. Proc. SPIE. 2011;7896:78960G–1-G-7. [Google Scholar]
- Rechtschaffen A, Kales A. A manual of standardized terminology subjects. UCLA brain information Service/Brain research institute; Los Angeles: 1968. [Google Scholar]
- Reinhard M, Wehrle-Wieland E, Grabiak D, Roth M, Guschlbauer B, Timmer J, Weiller C, Hetzel A. Oscillatory cerebral hemodynamics--the macro- vs. microvascular level. Journal of the Neurological Sciences. 2006;250(1-2):103–109. doi: 10.1016/j.jns.2006.07.011. [DOI] [PubMed] [Google Scholar]
- Rowley AB, Payne SJ, Tachtsidis I, Ebden MJ, Whiteley JP, Gavaghan DJ, Tarassenko L, Smith M, Elwell CE, Delpy DT. Synchronization between arterial blood pressure and cerebral oxyhaemoglobin concentration investigated by wavelet cross-correlation. Physiological Measurement. 2007;28(2):161–173. doi: 10.1088/0967-3334/28/2/005. [DOI] [PubMed] [Google Scholar]
- Sassaroli A, Fantini S. Comment on the modified beer-lambert law for scattering media. Physics in Medicine and Biology. 2004;49(14):N255–7. doi: 10.1088/0031-9155/49/14/n07. [DOI] [PubMed] [Google Scholar]
- Sassaroli A, Pierro M, Bergethon P, Fantini S. Low-frequency spontaneous oscillations of cerebral hemodynamics investigated with near-infrared spectroscopy: A review. Institute of Electrical and Electronics Engineers. 2011 In press. [Google Scholar]
- Scholkmann F, Spichtig S, Muehlemann T, Wolf M. How to detect and reduce movement artifacts in near-infrared imaging using moving standard deviation and spline interpolation. Physiol. Meas. 2010;31:649–662. doi: 10.1088/0967-3334/31/5/004. [DOI] [PubMed] [Google Scholar]
- Shiotsuka S, Atsumi Y, Ogata S, Yamamoto R, Igawa M, Takahashi K, Hirasawa H, Koyama K, Maki A, Yamashita Y. Cerebral blood volume in the sleep measured by near-infrared spectroscopy. Psychiatry and Clinical Neurosciences. 1998;52(2):172–173. doi: 10.1111/j.1440-1819.1998.tb01012.x. others. [DOI] [PubMed] [Google Scholar]
- Tachtsidis I, Elwell CE, Leung TS, Lee CW, Smith M, Delpy DT. Investigation of cerebral haemodynamics by near-infrared spectroscopy in young healthy volunteers reveals posture-dependent spontaneous oscillations. Physiological Measurement. 2004;25(2):437–445. doi: 10.1088/0967-3334/25/2/003. [DOI] [PubMed] [Google Scholar]
- Taga G, Konishi Y, Maki A, Tachibana T, Fujiwara M, Koizumi H. Spontaneous oscillation of oxy- and deoxyhemoglobin changes with a phase difference throughout the occipital cortex of newborn infants observed using non-invasive optical topography. Neuroscience Letters. 2000;282(1-2):101–104. doi: 10.1016/s0304-3940(00)00874-0. [DOI] [PubMed] [Google Scholar]
- Tasali E, Leproult R, Ehrmann DA, Van Cauter E. Slow-wave sleep and the risk of type 2 diabetes in humans. Proceedings of the National Academy of Sciences of the United States of America. 2008;105(3):1044–1049. doi: 10.1073/pnas.0706446105. [DOI] [PMC free article] [PubMed] [Google Scholar]
- Tass P, Rosenblum MG, Weule J, Kurths J, Pikovsky A, Volkmann J, Schnitzler A, Freund H-J. Detection of n:M phase locking from noisy data: Application to magnetoencephalography. Phys. Rev. Lett. 1998;81:3291. [Google Scholar]
- Tian F, Niu H, Khan B, Alexandrakis G, Behbehani K, Liu H. Enhanced functional brain imaging by using adaptive filtering and a depth compensation algorithm in diffuse optical tomography. IEEE Transactions on Medical Imaging. 2011;30(6):1239–1251. doi: 10.1109/TMI.2011.2111459. [DOI] [PubMed] [Google Scholar]
- Uchida-Ota M, Tanaka N, Sato H, Maki A. Intrinsic correlations of electroencephalography rhythms with cerebral hemodynamics during sleep transitions. NeuroImage. 2008;42(1):357–368. doi: 10.1016/j.neuroimage.2008.03.055. [DOI] [PubMed] [Google Scholar]
- Villringer A, Planck J, Hock C, Schleinkofer L, Dirnagl U. Near infrared spectroscopy (NIRS): A new tool to study hemodynamic changes during activation of brain function in human adults. Neuroscience Letters. 1993;154(1-2):101–104. doi: 10.1016/0304-3940(93)90181-j. [DOI] [PubMed] [Google Scholar]
- Villringer A, Chance B. Non-invasive optical spectroscopy and imaging of human brain function. Trends Neurosci. 1997;20:435–442. doi: 10.1016/s0166-2236(97)01132-6. [DOI] [PubMed] [Google Scholar]
- White BR, Snyder AZ, Cohen AL, Petersen SE, Raichle ME, Schlaggar BL, Culver JP. Resting-state functional connectivity in the human brain revealed with diffuse optical tomography. NeuroImage. 2009;47(1):148–156. doi: 10.1016/j.neuroimage.2009.03.058. [DOI] [PMC free article] [PubMed] [Google Scholar]
- Wei William W. S. Time series analysis. Addison-Wesley Publishing Company; 1994. [Google Scholar]
- Zar JH. Biostatistical anlysis. 4th Edition Prentice Hall; 1999. [Google Scholar]
- Zhang D, Raichle ME. Disease and the brain’s dark energy. Nat. Rev. Neurol. 2010;6:15–28. doi: 10.1038/nrneurol.2009.198. [DOI] [PubMed] [Google Scholar]
- Zheng F, Sassaroli A, Fantini S. Phasor representation of oxy- and deoxyhemoglobin concentrations: What is the meaning of out-of-phase oscillations as measured by near-infrared spectroscopy? Journal of Biomedical Optics. 2010;15(4):040512. doi: 10.1117/1.3483466. [DOI] [PMC free article] [PubMed] [Google Scholar]


