Abstract
Freshly isolated adult rabbit sinoatrial node cells (f-SANC) are an excellent model for studies of autonomic signaling, but are not amenable to genetic manipulation. We have developed and characterized a stable cultured rabbit SANC (c-SANC) model that is suitable for genetic manipulation to probe mechanisms of spontaneous action potential (AP) firing.
After 48 hours in culture, c-SANC generate stable, rhythmic APs at 34±.5°C, at a rate that is 50% less than f-SANC. In c- vs. f-SANC: AP duration is prolonged; phosphorylation of phospholamban at Ser16 and type2 ryanodine receptor (RyR2) at Ser2809 are reduced; and the level of type2 regulator of G-protein signaling (RGS2), that facilitates adenylyl cyclases/cAMP/protein kinase A (PKA) via Gi inhibition, is substantially reduced. Consistent with the interpretation that cAMP/PKA signaling becomes impaired in c-SANC, acute β-adrenergic receptor stimulation increases phospholamban and RyR2 phosphorylation, enhances RGS2-labeling density, and accelerates the AP firing rate to the similar maximum in c- and f-SANC. Specific PKA inhibition completely inhibits all β-adrenergic receptor effects. Adv-RGS2 infection, or pertussis toxin treatment to disable Gi-signaling, each partially rescues the c-SANC spontaneous AP firing rate.
Thus, a Gi-dependent reduction in PKA-dependent protein phosphorylation, including that of Ca2+ cycling proteins, reduces the spontaneous AP firing rate of c-SANC, and can be reversed by genetic or pharmacologic manipulation of PKA signaling.
Keywords: cultured adult rabbit sinoatrial node cells, Action Potential firing rate, PKA-dependent protein phosphorylation, type2 regulator of G-protein signaling
1. Introduction
Genetic engineering of mice or gene manipulation via acute vector-directed gene transfer system in cells, are important tools to study mechanisms involved in cardiac pacemaker function. Adult rabbit sinoatrial node cells (SANC) are an excellent model for the study of pacemaker function [1–4], and may be superior to rodents (rats, mice…), because rabbit pacemaker cells generate action potentials with human-like characteristics. Freshly isolated adult rabbit SANC (f-SANC) usually maintain functional integrity up to 8 hours without culture when stored at 4°C in cardioplegic high potassium zero sodium Kraft-Bruhe solution, and are suitable for acute studies in electrophysiology, intracellular Ca2+ dynamics and cell molecular studies [5–8]. Based on the studies in f-SANC, it has been proposed that a coupled SYSTEM of intracellular Ca2+ clocks and surface membrane voltage clocks controls the heart's pacemaker mechanism [9]. In particular, protein kinase A (PKA)-dependent phosphorylation is a key regulator of the coupled clock system, and thus of spontaneous AP firing rate, even in the absence of β-adrenergic receptor (β-AR) stimulation.
Vector-directed gene transfer and subsequent functional characterization require that adult SANC be healthy and functional for at least 24 hours. A well-characterized model of cultured, isolated rabbit SANC, therefore, is essential for genetic manipulation of these cells. Although the technique for primary culture of ventricular, atrial and vascular smooth muscle cells from rat, mouse or rabbit is well established and routinely implemented [10–12], little information is currently available on cultured adult rabbit SANC [13,14]. Culturing adult SANC is more challenging than that of other cardiac cell types [10], as roughly only 10–15% of normally appearing f-SANC are capable of generating spontaneous and rhythmic action potentials (APs) under physiological conditions.
In the present study, we have developed a practical and reliable method for short-term culture (up to 8 days) of adult rabbit SANC (c-SANC) that retain their physiological integrity, have characterized the properties of c-SANC by comparing these to f-SANC, and have discovered mechanisms underlying differences in the spontaneous AP firing rate between c- and f-SANC. Finally, we have also successfully overexpressed proteins in c-SANC via an adenovirus directed acute gene transfer technique and demonstrated practical rescue of functional defects that are conferred by culture in vitro.
2. Materials and methods
2.1. Cell isolation, cell culture and adenoviral infection
Animals were treated in accordance with the NIH Guide for the Care and Use of Laboratory Animals (animal protocol number: 034LCS2013). Single, spindle-shaped, spontaneously beating SANC were isolated from the hearts of 2.8–3.1 kg New Zealand rabbits (Charles River Laboratories, Wilmington, MA) as described previously [15,16]. Cells were kept in Kraft-Bruhe solution at 4°C for up to 1 hour. Following centrifugation, freshly isolated SANC were plated at a density of 0.5×10⁴/cm2 on laminin pre-coated (10–20 μg/ml, Sigma) glass-bottom dishes for culture. The serum-containing medium used in previous studies [11,13,14] was modified to a 73% salt solution (containing (in mmol/L): NaCl 116, KCl 5.4, MgCl2 0.8, NaH2PO4 0.9, D-Glucose 5.6, Hepes 20, CaCl2 1.8, NaHCO3 26), 20% M199 (Sigma, in the presence of (in mmol/L) creatine 5, L-carnitine 2, taurine 5, insulin-transferrin-selenium-× 0.1%), 4% fetal bovine serum, 2% horse serum, and 1% penicillin and streptomycin (pH=7.4 at 37°C). Cells were incubated in a serum-containing medium for the first 24 hours, and then cultured in a serum-free medium.
For endogenous protein overexpression, cells were infected with adenoviral vectors at a multiplicity of infection of 100 (or otherwise indicated) in a serum-free medium for at least 24 hours. The adenovirus of green fluorescent protein (GFP) was purchased from VectorBiolabs, and the type2 regulator of G-protein signaling (RGS2)-adenovirus was a kind gift from Dr. Ulrike Mende from the Cardiovascular Research Center, Rhode Island Hospital and Alpert Medical School of Brown University. All experiments were performed with cells cultured for 48 or 72 hours (or otherwise indicated, up to 8 days).
2.2. Immunolabeling and other methods
An expanded Methods section detailing immunolabeling [11], spontaneous AP recording [17], is available in the Online Data Supplement.
2.3. Statistics
Data were reported as mean ± SEM. A Student's t test, or, when appropriate, one-way ANOVA, was applied to determine statistical significance of the differences. A p value < 0.05 was considered statistically significant.
3. Results
3.1. Basic characteristics of cultured SANC
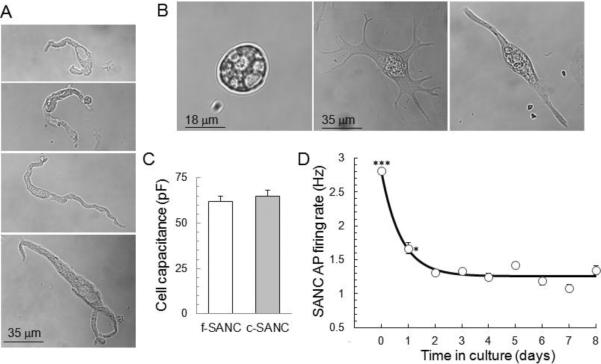
During the first day in culture, most c-SANC lose the spindle-shape of f-SANC (Fig.1 A&B), while the shape of atrial cells, used as a reference in the same culture dish, remains unchanged (suppl. Fig.S1A). After 2 days in culture, about 81% (a total of 261 cells from 25 rabbits) spread out with more than 3 projections, and this feature seems to result from loss of the cell connections in vivo (as f-SANC also tend to develop projections if they are bathed in normal perfusion solution for patch clamp recording more than 2 hours); about 11% cells become spherical, and about 8% grow only 1 or 2 projections and retain a similar appearance to f-SANC, i.e. spindle shape. These percentages remain constant for up to 8 days in culture. The average cell size of c- and f-SANC is similar measured by membrane capacitance (Fig.1C, p=0.56), regardless of the shape change and projections developed in culture. Of note, when c-SANC are plated at a density twice that used for our experiments, they develop connections with each other, and beat synchronously (data not shown).
Fig. 1.
Morphology and AP firing rate of cultured SANC. A. Typical examples of f-SANC. B. Several transmission images of spontaneously beating c-SANC. The cells are grouped into 3 types according to their shape: Spherical (~8%), Spread (~81%) and Spindle shaped (~11%). One-way ANOVA of AP firing rate distributions at 34 ± 0.5°C showed no significant difference among the 3 c-SANC types (suppl. Fig.1B). C. Bar graph of cell capacitance for f-SANC (n=68) and c-SANC (n=36). D. Average spontaneous AP firing rate versus culture time (n=49−265 SANC from 3 to 18 rabbits for each data point) at 34 ± 0.5°C. `0 day' corresponds to f-SANC (***, p<0.001, *, p<0.05, compared to any other data points via one-way ANOVA).
Regardless of their shape, however, single, non-confluent c-SANC at 34 ± 0.5°C retain the ability to beat spontaneously and rhythmically. Approximately 60.7 ± 6.1% of c-SANC (a total of 380 cells from 15 rabbits) are from the central region of the sinoatrial node, as evidenced by the lack of immunolabeling of gap junction protein connexin 43 [18], which is similar to the percentage of f-SANC (62.6 ± 4.6%, 427 cells from 13 rabbits in total, p=0.78). Of note, there is also no significant difference in the spontaneous AP firing rate between connexin 43-negative and connexin 43-positive c-SANC (p=0.46). There also are no significant differences in terms of the spontaneous AP firing rate (suppl. Fig.S1B) or any critical functional protein expression, e.g. type2 ryanodine receptor (RyR2, data not shown), among the differently shaped c-SANC. Thus, the cultured cells of different shapes were considered as a single group with respect to AP firing rate and protein expression.
Other cell types are also present in the culture system, including fibroblasts and myofibroblasts, identified by the presence of specific molecular markers (suppl. Fig.S1 C&D). These cells never beat spontaneously under any experimental conditions applied in this report.
As shown in Fig.1D, the spontaneous AP firing rate of c-SANC decreases sharply during the first day in culture, and remains steady from days 2 thorough 8. The spontaneous AP firing rate is measured by a line-scan transmission image of cell contractions (suppl. Fig.S2) in dye-free cells, or by AP cycle length during patch clamp AP recordings. Unless otherwise indicated, the data for c-SANC were obtained from cells cultured for 2 or 3 days. The average spontaneous AP firing rate of c-SANC (1.35 ± 0.02Hz, n=804 over 2 to 8 days in culture) is roughly 50% of that of f-SANC (2.79 ± 0.04Hz, n=203, p<0.001). Although c-SANC beat at a lower frequency, this is not attributable to a reduction of some essential structure or function proteins, as c-SANC retained the density of essential proteins detected by immunolabeling, such as RyR2 (immuno-density data not shown, p=0.41), phospholamban (PLB, immuno-density data not shown, p=0.48), and caveolin and connexin 43 (suppl. Fig.S1 E&F). c-SANC retain a similar response to ryanodine application as f-SANC [19]: a 15 min superfusion of 3 μmol/L ryanodine decreased the AP firing rate by ~52% as predicted, similar to the average effect in f-SANC in prior studies [8]; a 2 min superfusion of 10 μmol/L ryanodine resulted in cessation of spontaneous AP firing of 26 out of 35 c-SANC, and the remainder beat irregularly.
3.2. Characteristics of AP in c-SANC
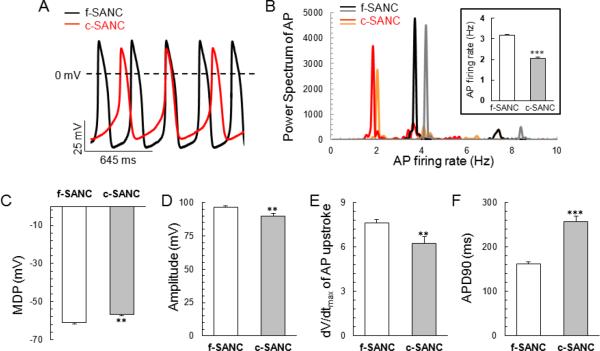
Fig.2A illustrates representative AP recordings in a subset of c- and f-SANC. Power Spectral Analysis indicated that the average primary rhythmic period was 2.04 0.07Hz (n=36) and 3.17 0.06Hz (n=79, p<0.001, Fig.2B) in c-SANC and f-SANC, respectively. While spontaneous, rhythmic APs generated by c-SANC have an AP overshoot similar to that of f-SANC, APs of c-SANC have less negative maximum diastolic potential and reduced amplitude compared to f-SANC (p<0.01, Fig.2 C&D). In addition, the maximum upstroke velocity is slower and the AP duration at 90% repolarization of c-SANC is prolonged compared to f-SANC (p<0.01, Fig.2 E&F).
Fig. 2.
Action potentials' rate and parameters. A. Representative recordings of spontaneous APs of c-SANC and f-SANC measured via perforated patch-clamp. B. Two representative Power Spectrum for c-SANC (red and orange) or f-SANC (black and gray), respectively, with the insert showing the averaged AP firing rate obtained by Power Spectrum analysis in c-SANC (n=36) vs. f-SANC (n=79), respectively (***, p<0.001). C–F. Bar graphs of maximum depolarization potentials (MDP), amplitude, maximum speed of upstroke and duration of AP recordings in c-SANC vs. f-SANC, respectively (p<0.01).
3.3. cAMP/PKA signaling pathway is down-regulated in c-SANC and is acutely rescued by β-AR stimulation
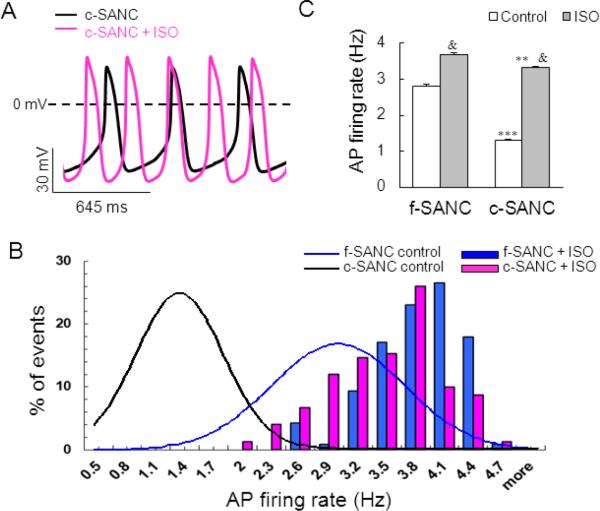
It has been well documented that the levels of cAMP in f-SANC are higher than in ventricular myocytes, in part, due to constitutive Ca2+ activation of adenylyl (A) cyclases in the former, but not in the latter [20,21]. Previous studies in f-SANC indicate that the β-AR stimulation-induced increase in the AP firing rate is accompanied by an increase of PLB phosphorylation [22]. On the other hand, the spontaneous AP firing rate of f-SANC decreases by 60% in the presence of a specific peptide inhibitor of PKA (PKI, 5 μmol/L) [22], i.e., to a level even lower than the basal AP firing rate of c-SANC. Thus, as indicated by prior studies [21], the status of PLB phosphorylation, which modulates the SR Ca2+ pumping rate, is a key determinant of the AP cycle length. We hypothesized that the low AP firing rate of c-SANC might possibly be due to a down-regulation of basal cAMP/PKA signaling in culture, and that this could be reversed by maneuvers that rescue cAMP/PKA signaling. As the first test of our hypothesis, we stimulated β-AR with 1 μmol/L isoproterenol (ISO, 10 min) and measured AP firing rate. As shown in the representative examples in Fig.3A and suppl. Fig.S3, and average data in Fig.3 B&C, acute application (10 min) of ISO accelerates the spontaneous AP firing rate to the similar maximum level in c- and f-SANC. The average AP parameters of f-SANC and c-SANC after acute ISO application are shown in suppl. Fig.S4.
Fig. 3.
Acute β-AR stimulation by ISO accelerates the AP firing rate to a similar maximum in c-SANC and f-SANC. A. Representative recordings of spontaneous APs from a c-SANC before (black line) and 10 min after 1 μmol/mL ISO superperfusion (pink line). B. Acute ISO stimulation shifts the histogram distribution of AP firing rate rightward from control (Gaussian-fitted curves) for both c-SANC and f-SANC. C. Bar graphs of AP firing rate under control and ISO stimulation in c-SANC and f-SANC, respectively (n=126−804 for each data point. **, p<0.01 or ***, p<0.001 comparing c- vs. f-SANC within treatment; &, p<0.001, the treatment effect within cell type).
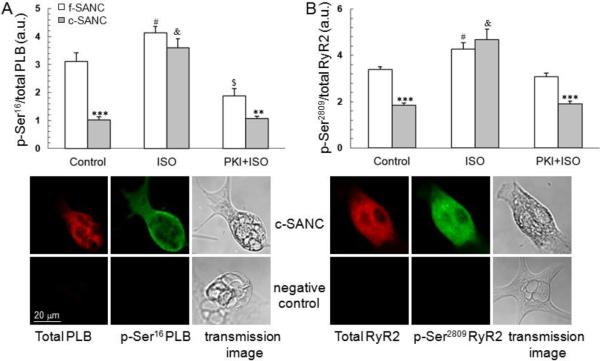
We next evaluated PLB phosphorylation states in single SANC. Although the total PLB expression level of c-SANC is similar to f-SANC, the basal phosphorylation level of PLB at PKA-specific site Ser16, indexed by the average fluorescence density of phosphorylated PLB at Ser16 normalized to total PLB fluorescence density of a given cell, is reduced by 67% in c-SANC (Fig.4A). Moreover, acute β-AR stimulation by ISO (1 μmol/L, 10 min), increases PLB phosphorylation at Ser16 to the same maximum in c- and f-SANC. Pre-treatment of SANC with PKI (10 μmol/L, 10 min), inhibits the β-AR stimulation effect and preserves the reduced basal level of PLB phosphorylation at Ser16 in c- and f-SANC (Fig.4A), e.g., PKI reduces PLB phosphorylation of both c-SANC and f-SANC, but to a greater extent in f-SANC.
Fig. 4.
Basal state phosphorylation of PLB and RyR2 are reduced in c-SANC and the deficit is abolished by ISO. A. Phosphorylation of PLB at Ser16, the PKA-specific site, under different experimental conditions (n=48 to 88 SANC for each data point. **, p<0.01, ***, p<0.001 c- vs. f-SANC within treatment; #, p<0.05, $, p<0.01, or &, p<0.001, treatment versus control within cell type. The phosphorylation level was indexed by the average fluorescence density of phosphorylated PLB at Ser16 normalized by the total PLB fluorescence density of a given cell; One set of confocal images is shown for the immunolabeling of total PLB and phosphorylated PLB at Ser16 in one c-SANC. Only the 2nd antibody was applied to the negative control. See suppl. Fig.S5 for the comparison of negative controls, among the negative control for which the primary antibody is omitted, and the negative controls where the primary antibody incorporated with epitope peptides. B. Phosphorylation level of RyR2 at Ser2809, in f- and c-SANC (n=23 to 93 for each data point. ***, p<0.001 comparing c- and f-SANC by treatment; #, p<0.05 or &, p<0.001, the treatment effect within c- or f-SANC).
We also measured the phosphorylation level of RyR2 at Ser2809, which is not specific to PKA signaling, indexed by the fluorescence density of phosphorylated RyR2 at Ser2809 normalized to total RyR2 fluorescence density (Fig.4B). Although the total RyR2 immuno-fluorescence density is similar in c- and f-SANC, the RyR2 phosphorylation under basal condition is reduced in c- vs. f-SANC, i.e., similar to PLB phosphorylation. In response to β-AR stimulation, as in the case of PLB phosphorylation, RyR2 phosphorylation levels in c- and f-SANC converge to the same maximum. When β-AR-induced PKA phosphorylation is inhibited by PKI during β-AR stimulation, RyR2 phosphorylation levels in c- and f-SANC, again mimic their basal levels, being reduced in the former vs. the latter (Fig.4B). The phospho-immunolabeling results in Fig.4, together with the functional data in Fig.3, support the idea that cAMP/PKA signaling is down-regulated in c-SANC vs. f-SANC, and that this reduction of PKA-dependent phosphorylation of key SR Ca2+ cycling proteins in c-SANC, and the reduced spontaneous AP firing rate can be acutely rescued by β-AR stimulation.
3.4. Rescue of c-SANC AP firing rate by RGS2 over-expression or disabling Gi signaling
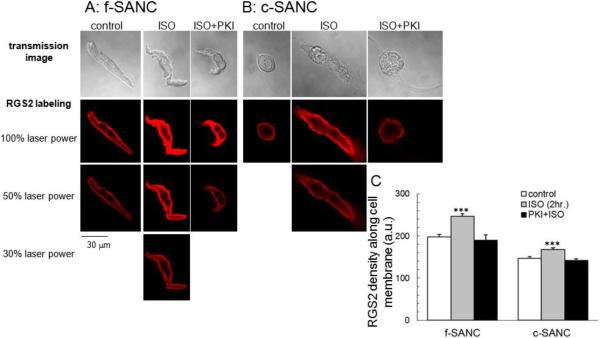
Potential mechanisms that may underlie the down-regulation of PKA-dependent phosphorylation in cultured pacemaker cells were explored next. We had previously demonstrated that basal Gi signaling in f-SANC is inactive [23], because pertussis toxin (PTX) is without effect on the basal spontaneous AP firing rate. But activation of Gi signaling in f-SANC by cholinergic receptor stimulation leads to a reduction in cAMP-mediated, PKA-dependent phosphorylation of PLB and of the AP firing rate, and both effects are blocked by PTX [23]. Since RGS2 has been implicated in suppression of Gi signaling [24], and activation of Gi signaling suppresses cAMP-mediated, PKA-dependent AP firing, we hypothesized that RGS2 might become reduced in cultured SANC. Indeed, the average density of RGS2 protein immunolabeling within 0.5 μm of the cell surface, the predominant location of RGS2 (Fig.5 A&B), is lower in c-SANC than in f-SANC (Fig.5C). Interestingly, two hours of incubation with 1 μmol/L ISO enhances the immunolabeling of RGS2 in both c- and f-SANC, and this effect is completely inhibited by PKI pre-treatment (10 μmol/L, 10 min, Fig.5).
Fig. 5.
RGS2 expression in f- and c-SANC. A & B. Immunolabeling of RGS2 and transmission images in f-SANC and c-SANC under different treatment, respectively. Note: Some images were obtained with reduced laser power (50% or 30%), as indicated, if the signal was saturated when sampled using the same condition as c-SANC control under 100% laser power. C. Average data of the RGS2 density near the cell membrane of panels A and B (n=28 to 99 SANC for each group, ***, p<0.001 vs. other control or PKI+ISO within cell type). See suppl. Fig.S8 for the adjustment of the RGS2 density between different laser powers.
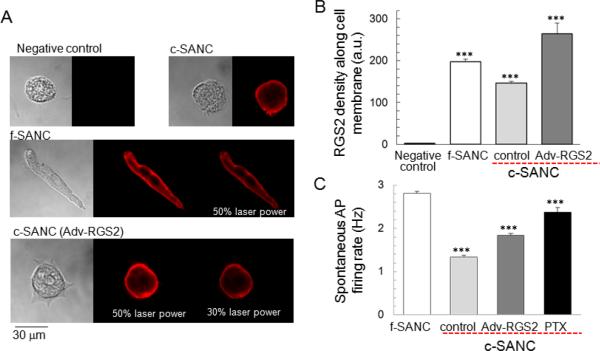
We attempted to increase the RGS2 protein level in c-SANC via genetic manipulation by employing an adenovirus-directed acute gene-transfer technique (Ad-RGS2). Typical images and the average immunolabeling density are shown in Fig.6 A&B, and indicate that it, too, is enriched near the cell membrane, like native RGS2 (Fig.5 A&B). RGS2 over-expression increases the spontaneous AP firing rate of cultured SANC by 40% (Fig.6C, suppl. Fig.S3 & S4). Note that the expression of a negative control of GFP via Adv-GFP (suppl. Fig.S6 & Fig.S7A), does not affect the AP firing rate, and that there is no correlation between AP firing rate and GFP expression level (suppl. Fig.S7B).
Fig. 6.
Partial rescue of c-SANC AP firing rate by RGS2 over-expression or PTX treatment. A. Immunolabeling of RGS2 and transmission images in c-SANC, f-SANC and RGS2 overexpression. Note: Some images were obtained with reduced laser power (50% or 30%), as indicated, if the signal was saturated when sampled using the same condition as negative control and c-SANC control groups under 100% laser power. B. Average data of the RGS2 density near the cell membrane of panel A (n=28 to 99 SANC for each group, ***, p<0.001 vs. any other group). See suppl. Fig.S8 for the adjustment of the RGS2 density between different laser powers. C. Partial rescue of c-SANC AP firing rate by Adv-RGS2 or PTX treatment (n=45 to 201 SANC for each group, ***, p<0.001 vs. any other group via one-way ANOVA).
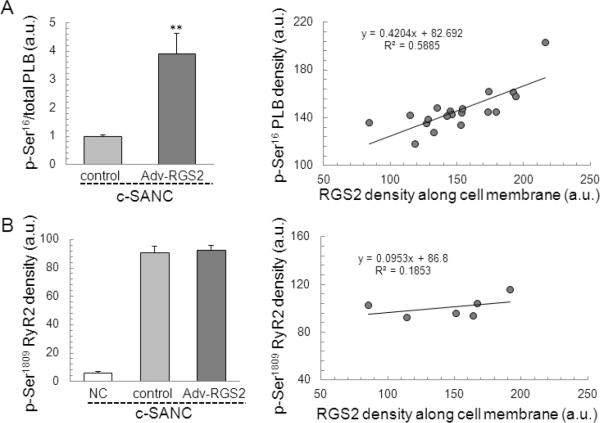
RGS2 overexpression dramatically increases the phosphorylation level of PLB at Ser16 (the ratio of phosphorylated PLB at Ser16 to total PLB) in c-SANC (p<0.01, Fig. 7A), which is similar to c-SANC with ISO application (3.91 ± 0.71 (n=17, Adv-RGS2) vs. 3.60 0.32(n=85, c-SANC+ISO), p=0.69). The density of phosphorylated PLB at Ser16 is positively correlated with the RGS2 expression level in the Adv-RGS2 infected c-SANC group. Surprisingly, RGS2 overexpression does not change the phosphorylation level of RyR2 at Ser2809 in c-SANC (p=0.75, Fig. 7B), and accordingly, there is no correlation between the density of phosphorylated RyR2 at Ser2809 and RGS2 expression level in Adv-RGS2 infected c-SANC group.
Fig. 7.
RGS2 overexpression in c-SANC increases PLB phosphorylation at Ser16 but not RyR2 phosphorylation at Ser2809. A. The phosphorylation of PLB at Ser16, normalized by the total PLB fluorescence density of a given cell, is significant higher in RGS2 overexpression than c-SANC control (n=5 to 17 for each data point. **, p<0.01). Left panel shows the correlation between PLB phosphorylation at Ser16 and RGS2 overexpression. B. Phosphorylation level of RyR2 at Ser2809, (n=9 to 25 for each data point, p=0.75 between c-SANC control and RGS2 overexpression). Left panel shows no correlation between RyR2 phosphorylation at Ser2809 and RGS2 over-expression.
The results in Fig.6 suggest that, unlike in f-SANC, Gi signaling might be activated in c-SANC because of the reduced RGS2 expression, even in the absence of cholinergic receptor stimulation. Indeed, exposure of c-SANC to 0.4 μg/ml PTX (overnight at 37°C) to functionally disable Gi signaling increases the spontaneous AP firing rate of c-SANC and to ~85% of that of f-SANC (Fig.6C, suppl. Fig. S3 & S4). The partial rescue of c-SANC AP firing rate by RGS2 overexpression or PTX treatment suggests that the activation of Gi signaling in c-SANC is due, in part at least, to down-regulation of RGS2, and that this is a mechanism that underlies the reduced AP firing rate of c-SANC.
4. Discussion
We modified the previously published methods [11,13,14] to culture rabbit adult SANC. Similar to f-SANC, c-SANC generate spontaneous APs, and beat spontaneously and rhythmically at a physiological temperature, but at a lower frequency (Fig.1 &2). The reduction of AP firing rate (prolongation of cycle length) in c- vs. f-SANC is consistent with a partial uncoupling in culture of the coupled clock system [9] that drives normal automaticity of SANC. This uncoupling relates, in part at least, to the changes in Ca2+ cycling in culture, similar to its partial uncoupling in stem cell-derived cardiac cells [25]. This uncoupling may be attributable to the observed reduction in PKA-dependent phosphorylation of PLB and RyR2. Indeed, β-AR stimulation with ISO, which augments cAMP and cAMP-mediated PKA-dependent PLB and RyR2 phosphorylation, rescues the reduction in PLB and RyR2 phosphorylation of c-SANC (Fig.4), and rescues the prolonged AP cycle length (Fig.3). c-SANC may also have reductions in phosphorylation of other proteins not measured in the present study, e.g. the surface membrane L-type Ca2+ ion channels or phospholemman, which modulates the Na/K-ATPase [26,27]. The prolongation of AP repolarization time in c-SANC vs. f-SANC, might also reflect a reduction of PKA-dependent regulation of IK in c-SANC [28]. Of note, the shift in AP repolarization time affects the kinetics of net Ca2+ flux via sodium-calcium exchanger, due to its voltage dependence.
Prior studies indicate that basal Gi signaling is suppressed in f-SANC [23]. Its activation in response to low-dose cholinergic receptor stimulation inhibits A cyclase and PKA-dependent PLB phosphorylation, effects closely linked to a concurrent reduction in AP firing rate [23]. The results of the present study suggest that basal Gi signaling becomes active in culture, because even in the absence of cholinergic receptor stimulation, inactivation of Gi signaling by PTX, which has no effect in f-SANC [23], markedly increases the reduced AP firing rate phenotype of c-SANC.
Our study also provides evidence for a mechanism whereby Gi activation becomes increased in c-SANC. RGS are GTPase-activating proteins that reconstitute the G protein complex and terminate G protein signaling [29–31]. Prior studies have established the important role of RGS4 in regulating sinus rhythm by inhibiting G protein-coupled inward rectifying potassium channel and acetylcholine-sensitive potassium current activity [30,31]. It has also recently been demonstrated that RGS2 is a physiologic inhibitor of Gi signaling [24]. Our study shows that RGS2 protein levels are reduced in c-SANC, and this reduction is a possible mechanism for elevated basal Gi signaling that results in PTX sensitivity of the AP firing rate in c-SANC. We employed two strategies to override this apparent reduction in RGS2 signaling. Firstly, we exposed c-SANC to prolonged exposure (2 hours) to β-AR stimulation, shown previously to an increase in RGS2 protein expression [24]. Prolonged ISO rescued the reduction of GRS2 protein in c-SANC, elevating it to the level of f-SANC (Fig.5). Of note, sustained β1-AR stimulation (24 hours) may shift PKA signaling to calmodulin/Ca2+-dependent kinase II (CAMKII) signaling, as previously demonstrated in cultured rat ventricular myocytes [32], thereby implicating a potential role of CAMKII in an ISO-induced RGS2 rescue. A second strategy that we employed was to genetically manipulate the level of RGS2 in c-SANC. Infection of c-SANC with adv-RGS2 for 24 hours in culture increased RGS2 protein expression, and this was associated with a partial rescue of the reduced AP firing rate of c-SANC.
It is intriguing to note that prolonged culture leads to a down-regulation of RGS2 in adult rabbit c-SANC (Fig. 5 A&B), but leads to an up-regulation of RGS2 in rat ventricular myocytes [24]. The difference mainly results from cell type-specific regulation of RGS2 in cell culture systems, and not from different species, as culture also leads to an up-regulation in rabbit ventricular myocytes (unpublished data). However, the underlying mechanism remains unclear at this moment. Since PKA-related phosphorylation in f-SANC is higher than in fresh ventricular myocytes [20,21], the lack of sympathetic stimulation in culture probably plays an important role in contributing to the difference.
In summary, we have defined important characteristics of a cultured rabbit SANC model, in which altered cAMP/PKA modulation that develops in culture reduces the AP firing rate. Specifically, a Gi-dependent, PTX-sensitive reduction in PKA-dependent Ca2+-cycling protein phosphorylation, likely due, in part at least, to a reduced RGS2 signaling, effects a reduction of the spontaneous AP firing rate. Differences between c- and f-SANC spontaneous firing rates can be rescued by β-AR stimulation in culture. The altered phenotypes of c-SANC, and their rescue by the maneuvers employed provide additional support for the coupled-clock hypothesis of pacemaker cells. We have also demonstrated that genetic manipulation, via an adenovirus-directed acute gene transfer technique can lead to successful overexpression of proteins in adult c-SANC. Specifically, we have shown that Ad-GRS2, which inhibits Gi signaling, partially rescues the functional deficits in c-SANC. These novel findings are intimately linked to pacemaker function and support the novel concept that robust pacemaker function occurs in the context of a complex system that is driven by constitutive Ca2+ --A Cyclase, PKA signaling. This signaling becomes damped in culture because Gi activation occurs and this reduces A Cyclase activation, leading to a reduction in PKA dependent phosphorylation of coupled-pacemaker clock proteins and Ca2+ cycling, which causes the AP firing rate to become reduced. Thus, cultured SANC appear as if their post cholinergic receptor signaling is being activated [23]. This culture model will enable future studies in which genetic manipulation of adult pacemaker cells can be employed to glean novel mechanistic insights into adult pacemaker cell function.
Supplementary Material
Highlights
Deficient PKA signaling induces the reduction in AP firing rate of SANC in culture
Reduction of cAMP/PKA signaling in c-SANC is Gi-dependent
Reduced AP firing rate is rescued by pertussis toxin treatment
Cultured SANC is an excellent model for genetic manipulation
Reduced AP firing rate of cultured SANC is alleviated by RGS2 overexpression
Acknowledgements
This work was supported by the Intramural Research Program of the National Institute on Aging, NIH. D.Y. was supported in part by an appointment to the Oak Ridge Associated Universities' Research Associates/Specialists Program at NIH.
We sincerely appreciate Veena Shetty (M.P.H.) for statistical support, Robert Monticone (M.S.) and Ruth Sadler for editing assistance, Dr. Harold A. Spurgeon for technical support, and Dr. Victor A. Maltsev for providing a program for AP parameters analysis. We are grateful to Drs. Rui-Ping Xiao, Ulrike Mende and Wei-zhong Zhu for providing the RGS2 adenovirus, to Dr. John Colyer from Badrilla Ltd. (UK) for providing epitope peptides, and to Dr. Didier X.P. Brochet for helpful comments and thoughtful reading of the manuscript.
Glossary
- A cyclase
Adenylyl cyclase
- AP
action potential
- β-AR
β-adrenergic receptor
- CAMKII
calmodulin/Ca2+-dependent kinase II
- c-SANC
cultured rabbit sinoatrial node cells
- f-SANC
freshly isolated rabbit sinoatrial node cells
- GFP
green fluorescent protein
- ISO
isoproterenol
- PKA
protein kinase A
- PKI
peptide inhibitor of PKA
- PLB
phospholamban
- PTX
pertussis toxin
- RGS2
type2 regulator of G-protein signaling
- RyR2
type2 ryanodine receptor
- SANC
sinoatrial node cells
- SR
sarcoplasmic reticulum
Footnotes
Publisher's Disclaimer: This is a PDF file of an unedited manuscript that has been accepted for publication. As a service to our customers we are providing this early version of the manuscript. The manuscript will undergo copyediting, typesetting, and review of the resulting proof before it is published in its final citable form. Please note that during the production process errors may be discovered which could affect the content, and all legal disclaimers that apply to the journal pertain.
Disclosures None
Appendix: Supplementary data Supplementary data to this article can be found online.
References
- [1].Masson-Pevet M, Bleeker WK, Besselsen E, Treytel BW, Jongsma HJ, Bouman LN. Pacemaker cell types in the rabbit sinus node: a correlative and electrophysiological study. J Mol Cell Cardiol. 1984;16:53–63. doi: 10.1016/s0022-2828(84)80714-2. [DOI] [PubMed] [Google Scholar]
- [2].Bleeker WK, Mackaay AJ, Masson-Pevet M, Bouman LN, Becker A. Functional and morphological organization of the rabbit sinus node. Circ Res. 1980;46:11–22. doi: 10.1161/01.res.46.1.11. [DOI] [PubMed] [Google Scholar]
- [3].Noma A. Ionic mechanisms of the cardiac pacemaker potential. Jpn Heart J. 1996;37:673–682. doi: 10.1536/ihj.37.673. [DOI] [PubMed] [Google Scholar]
- [4].Irisawa H, Brown HF, Giles W. Cardiac pacemaking in the sinoatrial node. Physiol Rev. 1993;73:197–227. doi: 10.1152/physrev.1993.73.1.197. [DOI] [PubMed] [Google Scholar]
- [5].Lakatta EG, DiFrancesco D. What keeps us ticking: a funny current, a calcium clock, or both? J Mol Cell Cardiol. 2009;47:157–70. doi: 10.1016/j.yjmcc.2009.03.022. [DOI] [PMC free article] [PubMed] [Google Scholar]
- [6].Vinogradova TM, Maltsev VA, Bogdanov KY, Lyashkov AE, Lakatta EG. Rhythmic Ca2+ oscillations drive sinoatrial nodal cell pacemaker function to make the heart tick. Ann. N.Y. Acad. Sci. 2005;1047:138–156. doi: 10.1196/annals.1341.013. [DOI] [PubMed] [Google Scholar]
- [7].Lakatta EG, Vinogradova TM, Lyashkov AE, Sirenk S, Zhu W, Ruknudin A, et al. The integration of spontaneous intracellular Ca2+ cycling and surface membrane ion channel activation entrains normal automaticity in cells of the heart's pacemaker. Ann. N.Y. Acad. Sci. 2006;1080:178–206. doi: 10.1196/annals.1380.016. [DOI] [PubMed] [Google Scholar]
- [8].Vinogradova TM, Lakatta EG. Regulation of basal and reserve cardiac pacemaker function by interactions of cAMP-mediated PKA-dependent Ca2+ cycling with surface membrane channels. J Mol Cell Cardiol. 2009;47:456–474. doi: 10.1016/j.yjmcc.2009.06.014. [DOI] [PMC free article] [PubMed] [Google Scholar]
- [9].Lakatta EG, Maltsev VA, Vinogradova TM. A coupled SYSTEM of intracellular Ca2+ clocks and surface membrane voltage clocks controls the timekeeping mechanism of the heart's pacemaker. Circ. Res. 2010;106:659–673. doi: 10.1161/CIRCRESAHA.109.206078. [DOI] [PMC free article] [PubMed] [Google Scholar]
- [10].Zhou YY, Wang SQ, Zhu WZ, Chruscinski A, Kobilka BK, Ziman B, et al. Culture and adenoviral infection of adult mouse cardiac myocytes: methods for cellular genetic physiology. Am J Physiol. 2000;279:H429–H436. doi: 10.1152/ajpheart.2000.279.1.H429. [DOI] [PubMed] [Google Scholar]
- [11].Yang D, Song LS, Zhu WZ, Chakir K, Wang W, Wu C, et al. Calmodulin regulation of excitation-contraction coupling in cardiac myocytes. Circ. Res. 2003;92(6):659–667. doi: 10.1161/01.RES.0000064566.91495.0C. [DOI] [PubMed] [Google Scholar]
- [12].Spinetti G, Wang M, Monticone R, Zhang J, Zhao D, Lakatta EG. Rat aortic MCP-1 and its receptor CCR2 increase with age and alter vascular smooth muscle cell function. Arterioscler Thromb Vasc Biol. 2004;24(8):1397–402. doi: 10.1161/01.ATV.0000134529.65173.08. [DOI] [PubMed] [Google Scholar]
- [13].Muramatsu H, Zou AR, Berkowitz GA, Nathan RD. Characterization of a TTX-sensitive Na+ current in pacemaker cells isolated from rabbit sinoatrial node. Am. J. Physiol. 1996;270:H2108–H2119. doi: 10.1152/ajpheart.1996.270.6.H2108. [DOI] [PubMed] [Google Scholar]
- [14].Liu ZW, Zou AR, Demir SS, Clark JW, Nathan RD. Characterization of a hyperpolarization-activated inward current in cultured pacemaker cells from the sinoatrial node. J. Mol. Cell. Cardiol. 1996;28:2523–2535. doi: 10.1006/jmcc.1996.0244. [DOI] [PubMed] [Google Scholar]
- [15].Ito H, Ono K. Role of rapidly activating delayed rectifier K1 current in sinoatrial node pacemaker activity. Am J Physiol. 1995;269:H443–H452. doi: 10.1152/ajpheart.1995.269.2.H443. [DOI] [PubMed] [Google Scholar]
- [16].Vinogradova TM, Zhou YY, Bogdanov KY, Yang D, Kuschel M, Cheng H, et al. Sinoatrial node pacemaker activity requires Ca2+/calmodulin-dependent protein kinase II activation. Circ. Res. 2000;87(9):760–767. doi: 10.1161/01.res.87.9.760. [DOI] [PubMed] [Google Scholar]
- [17].Bogdanov KY, Maltsev VA, Vinogradova TM, Lyashkov AE, Spurgeon HA, Stern MD, et al. Membrane potential fluctuations resulting from submembrane Ca2+ releases in rabbit sinoatrial nodal cells impart an exponential phase to the late diastolic depolarization that controls their chronotropic state. Circ. Res. 2006;99:979–987. doi: 10.1161/01.RES.0000247933.66532.0b. [DOI] [PubMed] [Google Scholar]
- [18].Lyashkov AE, Juhaszova M, Dobrzynski H, Vinogradova TM, Maltsev VA, Juhasz O, et al. Calcium cycling protein density and functional importance to automaticity of isolated sinoatrial nodal cells are independent of cell size. Circ Res. 2007;100:1723–1731. doi: 10.1161/CIRCRESAHA.107.153676. [DOI] [PubMed] [Google Scholar]
- [19].Lakatta EG, Maltsev VA, Bogdanov KY, Stern MD, Vinogradova TM. Cyclic variation of intracellular calcium: a critical factor for cardiac pacemaker cell dominance. Circ. Res. 2003;92:45–50. doi: 10.1161/01.res.0000055920.64384.fb. [DOI] [PubMed] [Google Scholar]
- [20].Vinogradova TM, Zhou YY, Maltsev V, Lyashkov A, Stern M, Lakatta EG. Sinoatrial pacemaker cells do not require membrane depolarization. Circ. Res. 2004;94:802–809. doi: 10.1161/01.RES.0000122045.55331.0F. [DOI] [PubMed] [Google Scholar]
- [21].Vinogradova TM, Lyashkov AE, Zhu W, Ruknudin AM, Sirenko S, Yang D, et al. High basal protein kinase A-dependent phosphorylation drives rhythmic internal Ca2+ store oscillations and spontaneous beating of cardiac pacemaker cells. Circ. Res. 2006;98(4):505–514. doi: 10.1161/01.RES.0000204575.94040.d1. [DOI] [PubMed] [Google Scholar]
- [22].Vinogradova TM, Sirenko S, Lyashkov AE, Younes A, Li Y, Zhu W, et al. Constitutive phosphodiesterase activity restricts spontaneous beating rate of cardiac pacemaker cells by suppressing local Ca2+ releases. Circ. Res. 2008;102:761–769. doi: 10.1161/CIRCRESAHA.107.161679. [DOI] [PubMed] [Google Scholar]
- [23].Lyashkov AE, Vinogradova TM, Zahanich I, Li Y, Younes A, Nuss HB, et al. Cholinergic receptor signaling modulates spontaneous firing of sinoatrial nodal cells via integrated effects on PKA-dependent Ca2+ cycling and IKACh. Am J Physiol. 2009;297:H949–H959. doi: 10.1152/ajpheart.01340.2008. [DOI] [PMC free article] [PubMed] [Google Scholar]
- [24].Chakir K, Zhu W, Tsang S, Woo AY, Yang D, Wang X, et al. RGS2 is a primary terminator of β2-adrenergic receptor-mediated Gi signaling. J Mol Cell Cardiol. 2011;50:1000–1007. doi: 10.1016/j.yjmcc.2011.01.015. [DOI] [PMC free article] [PubMed] [Google Scholar]
- [25].Zahanich I, Sirenko SG, Maltseva LA, Tarasova YS, Spurgeon SA, Boheler KR, et al. Rhythmic beating of stem cell-derived cardiac cells requires dynamic coupling of electrophysiology and Ca cycling. J Mol Cell Cardiol. 2011;50:66–76. doi: 10.1016/j.yjmcc.2010.09.018. [DOI] [PMC free article] [PubMed] [Google Scholar]
- [26].Despa S, Bossuyt J, Han F, Ginsburg KS, Jia LG, Kutchai H, et al. Phospholemman-phosphorylation mediates the beta-adrenergic effects on Na/K pump function in cardiac myocytes. Circ Res. 2005;97(3):252–9. doi: 10.1161/01.RES.0000176532.97731.e5. [DOI] [PubMed] [Google Scholar]
- [27].Bers DM, Despa S. Na/K-ATPase--an integral player in the adrenergic fight-or-flight response. Trends Cardiovasc Med. 2009;19(4):111–8. doi: 10.1016/j.tcm.2009.07.001. [DOI] [PMC free article] [PubMed] [Google Scholar]
- [28].Rose J, Armoundas AA, Tian Y, DiSilvestre D, Burysek M, Halperin V, et al. Molecular correlates of altered expression of potassium currents in failing rabbit myocardium. Am J Physiol Heart Circ Physiol. 2005;288(5):H2077–87. doi: 10.1152/ajpheart.00526.2003. [DOI] [PMC free article] [PubMed] [Google Scholar]
- [29].Zhang W, Anger T, Su J, Hao J, Xu X, Zhu M, et al. Selective loss of fine tuning of Gq/11 signaling by RGS2 protein exacerbates cardiomyocyte hypertrophy. J Biol Chem. 2006;281(9):5811–20. doi: 10.1074/jbc.M507871200. [DOI] [PubMed] [Google Scholar]
- [30].Cifelli C, Rose RA, Zhang H, Voigtlaender-Bolz J, Bolz SS, Backx PH, et al. RGS4 regulates parasympathetic signaling and heart rate control in the sinoatrial node. Circ. Res. 2008;103:527–535. doi: 10.1161/CIRCRESAHA.108.180984. [DOI] [PubMed] [Google Scholar]
- [31].Jaén C, Doupnik CA. RGS3 and RGS4 differentially associate with G Protein-coupled Receptor-Kir3 channel signaling complexes revealing two modes of RGS modulation: PRECOUPLING and COLLISION coupling. J Biol Chem. 2006;281(45):34549–34560. doi: 10.1074/jbc.M603177200. [DOI] [PubMed] [Google Scholar]
- [32].Wang W, Zhu W, Wang S, Yang D, Michael TC, Xiao RP, et al. Sustained β1-adrenergic stimulation modulates cardiac contractility by Ca2+/Calmodulin kinase signaling pathway. Circ. Rese. 2004;95(8):798–806. doi: 10.1161/01.RES.0000145361.50017.aa. [DOI] [PubMed] [Google Scholar]
Associated Data
This section collects any data citations, data availability statements, or supplementary materials included in this article.


