

Abstract
Metabolic syndrome is a condition that typically includes central obesity, insulin resistance, glucose intolerance, dyslipidemia, and hypertension. Disruption of the hypothalamic–pituitary–adrenal axis, a regulator of corticosterone secretion, occurs in some cases of metabolic syndrome and obesity, and Cushing hypercortisolemia is associated with obesity and metabolic disorders. We therefore assessed anatomic and clinical pathology in C57BL/6NCrl mice to evaluate the effects of chronic corticosterone in the drinking water at doses of 25, 50, and 100 μg/mL for 25 d. Treated mice developed obesity, glucose intolerance, electrolyte aberrations, and dyslipidemia that were dose-dependent and most severe in the 100-μg/mL treatment group. To evaluate return to normal function, additional C57BL/6NCrl mice received corticosterone-free water for 2 wk after the 25-d treatment period. According to results of gross examination, mice appeared to recover within days of exogenous corticosterone withdrawal; however, adrenal gland vacuolation and protein, lipid, and electrolyte abnormalities persisted. Together, these findings support chronic corticosterone exposure through the drinking water as a potentially useful, noninvasive method to induce some features of metabolic syndrome.
Obesity and associated metabolic dysfunctions are an increasing public health concern in modern Western society. In humans, obesity and metabolic syndrome heighten the risk of developing debilitating and costly illness including diabetes, cardiovascular disease, stroke, and some forms of cancer.2,20 Mounting evidence indicates that stress and associated hormones such as cortisol (corticosterone in rodents) contribute to the development of metabolic syndrome. Furthermore, regional glucocorticoid metabolism in adipocytes is proposed to be involved in the pathogenesis of metabolic syndrome.6,16,17,27,56 Cushing syndrome, iatrogenic hypercortisolemia, and metabolic syndrome share clinical and physiologic similarities, including central obesity, insulin resistance, glucose intolerance, dyslipidemia, and hypertension.1,2,31,35,41,46 How glucocorticoids contribute to the development of these problems remains unclear.
Numerous clinical and experimental studies have linked stress, diet, and lifestyle choices to changes in risk factors associated with the development of metabolic disorders.1,3,7,10,21,33,36,42,55 How corticosterone influences this risk remains unclear. Although corticosterone has beneficial short-term effects, long-term corticosterone exposure can result in damage to the physiologic systems it protects acutely.27 Disruption of this physiologic signal occurs in numerous disparate disorders, ranging from depression to Cushing syndrome.16,22,36,54 Therefore, understanding the effects of chronic high corticosterone on metabolism and physiology is of key importance.
To clarify how chronic treatment with corticosterone alters the physiology of an organism, we treated adrenally intact adult male mice with corticosterone in drinking water for 4 wk. Furthermore, we examined the return of physiology 2 wk after withdrawal of chronic corticosterone administration. We used this approach as a rapid (3- to 4-wk), noninvasive method of altering plasma corticosterone levels that enabled us to retain some integrity in the diurnal rhythm present in normal animals.
We previously characterized the gross metabolic consequences of exogenous noninvasive corticosterone delivery in the drinking water.20,28 In those studies, we found that high doses of corticosterone (100 μg/mL) resulted in rapid and dramatic hyperphagia; weight gain; increased adiposity; elevated plasma corticosterone, leptin, insulin, and triglyceride levels; and decreased homecage locomotion.20 Moreover, several studies have shown that a lower dose of corticosterone (25 μg/mL) resulted in an intermediate phenotype in some of these measures but had no effect on others.12,14,20,23,28,38,42,47 As such, the high corticosterone dose results in a phenotype that satisfies most of the criteria for metabolic syndrome as defined by the National Heart, Lung, and Blood Institute and the American Heart Association.15 However, little information is available on the resulting histologic, hematologic, and serum chemical profiles associated with this treatment. We sought to more fully characterize this model to support selection of the model that most accurately reflects the human disease conditions under study. In-depth characterization of the model also provides more precise measurements of response to therapies intended to ameliorate the effects of the treatment.
The current study provides a detailed examination of the physiologic effect of 3 dosages of corticosterone—low (25 μg/mL), intermediate (50 μg/mL), and high (100 μg/mL) doses—in drinking water. The goal was to extend the previous findings that established this regimen as a model of metabolic syndrome by exploring the detailed physiologic changes associated with this model and to assess whether and how treated mice recover after withdrawal of the corticosterone treatment. We propose that the physiologic changes observed in the mice treated with high-dose corticosterone approximate changes observed in human patients with metabolic syndrome and that these mice potentially serve as a model for hypercortisolemia and associated obesity. In addition, we hypothesized that 2 wk of recovery from corticosterone treatment would not completely resolve cellular and clinical pathologies characterized during treatment, given the numerous changes in physiology.
Materials and Methods
Animals.
Animal research was conducted in an AAALAC-accredited facility and was IACUC-approved. The study population included 81 adrenally intact male C57BL/6nCrl mice (weight, 19 to 21 g; age, 35 to 42 d at arrival; Charles River, Kingston, NY). Mice were specified by the vendor to be free of mouse hepatitis virus, mouse parvovirus, minute virus of mice, reovirus, Sendai virus, Ectromelia virus, murine rotavirus, lymphocytic choriomeningitis virus, murine norovirus, pneumonia virus of mice, Mycoplasma pulmonis, and bacterial and parasitic infections. Mice were housed 4 per cage in open top, static cages (Thoren, Hazleton, PA). A lightbox cabinet (Phenome Technologies, Lincolnshire, IL) system was used as a secondary enclosure. All effluent air was exhausted directly into the building's HVAC system. Animals were housed on irradiated corncob bedding (Bed-o'cobs and Pure-o'cel, The Andersons, Maumee, OH) with supplemental synthetic absorbent materials (ALPHA-dri, Shepherd Specialty Papers, Milford, NJ) and were provided free access to a standard irradiated diet (LabDiet 5053, Purina Mills International, St Louis, MO) and municipal tap water. Environmental parameters were 21 ± 2 °C, 30% to 70% humidity, and 10 to 15 air-exchanges hourly. Mice were maintained on a 12:12-h light:dark cycle (0600 to 1800) and were provided a 5-d (minimum) acclimation period prior to initiation of corticosterone treatment.
Corticosterone treatment.
After the acclimation period, cages of mice were assigned randomly among 4 treatment groups. Mice were not weight-matched prior to treatment group assignment. Treatment groups received 25 µg/mL (low), 50 µg/mL (intermediate), or 100 µg/mL (high) of free-corticosterone (Sigma, St Louis, MO); the control group received 1% ethanol in drinking water. Corticosterone solutions were prepared by dissolving corticosterone in 100% ethanol and then mixing this solution with tap water to obtain a final ethanol concentration of 1%. Animals were weighed, cages were changed, and fresh drinking water solutions were prepared for each treatment group weekly.
One cohort of 49 animals was treated with low (n = 12), intermediate (n = 12), or high (n = 13) doses of corticosterone or 1% ethanol control (n = 12) for 25 d followed by CO2 euthanasia and sample collection. The recovery cohort of 32 animals (8 mice per treatment group) received corticosterone for 25 d as described, after which all treatment groups received 1% ethanol in drinking water for 14 d prior to euthanasia and sample collection. This 2-wk period allowed evaluation of the extent of recovery from the effects of exogenous corticosterone. Samples from all treatment groups were collected at midday to minimize the effects of variation due to the circadian cycle.
One control mouse from the treatment cohort died during the acclimation period, and an intermediate-dose mouse from the recovery cohort died midexperiment. Another 7 mice were excluded from analysis due to confounding changes in clinical pathology that were unrelated to experimental manipulation, including severe preputial gland adenitis with myeloid hyperplasia, brain and spinal cord histiocytosis, meningoencephalitis, and a study protocol deviation that resulted in lack of access to water for the proposed period of time. In some cases, not all samples were analyzed due to lack of sufficient blood or urine volume.
Clinical pathology.
Individual urine samples were collected by gently restraining each mouse over wax film until urination was noted.44 A refractometer (model 1310400A, Reichert Technologies, Depew, NY) was used to measure urine-specific gravity, and reagent strips (Multistix 10 SG Reagent Strips, Siemens Healthcare Diagnostics, Deerfield, IL) were used to measure urine glucose. Due to the high concentration of mouse urine, some samples required 2- to 3-fold dilution with sterile water prior to measurement on a standard refractometer. Blood samples (approximately 1 mL) were collected via cardiocentesis under deep CO2 sedation by using a 25-gauge, 5/8-in. tuberculin-type needle with a 1-mL syringe. Blood samples were transferred into EDTA or serum separator tubes (BD Microtainers, Becton Dickinson, Franklin Lakes, NJ) and were submitted for CBC and serum chemistry analysis, respectively. Samples collected in serum separator tubes were allowed to clot for 15 min prior to serum separation. CBC tubes and serum samples were sent to ALX Laboratories (New York, NY) for analysis. Within 5 min of euthanasia, each mouse was weighed, and a bone marrow sample was collected from the femur. Bone marrow slides were processed using a Wright–Giemsa stain. All CBC data, serum chemistries, and bone marrow smears were analyzed by a veterinary clinical pathologist who was blinded to individual treatment groups.
Anatomic pathology.
A complete necropsy was performed on all mice. Spleen and liver weights were recorded. The adrenal glands and thymus were formalin-fixed overnight and then trimmed under a dissecting microscope to remove surrounding fibroadipose tissue prior to being weighed. Brown fat was collected from the intrascapular region for histologic analysis. Tissues were fixed in 10% neutral buffered formalin, trimmed, paraffin-embedded, and cut into 5-μm-thick tissue sections. Histopathology slides were processed routinely and stained with hematoxylin and eosin. A veterinary pathologist, blinded to individual treatment groups, examined all tissues, scored histologic changes, and measured formalin-fixed pituitary gland thickness ex vivo. Thymus, spleen, and lymph nodes were scored based on lymphoid depletion, in which a score of 1 indicated no depletion, 2 indicated minimal to mild depletion, 3 indicated moderate depletion with notably decreased lymphocytes, and 4 indicated marked depletion with rare lymphocytes. The liver and adrenal glands were scored on degree of vacuolation, where a score of 1 indicated no vacuolation, 2 indicated minimal to mild vacuolation, 3 indicated moderate vacuolation, and 4 indicated marked vacuolation. Brown fat was scored based on vacuole size compared with a known control. A score of 1 indicated that vacuole size was equivalent to control vacuole size, 2 indicated a mild increase in vacuole size with some confluent vacuoles, and 3 indicated moderately increased vacuole size with many confluent vacuoles.
Statistical analysis.
Results were interpreted by comparing corticosterone-treated animals (25, 50, or 100 μg/mL corticosterone) with concurrently assessed control animals (1% ethanol). Similarly, recovery was assessed by comparing the corticosterone-treated recovery groups with the concurrently evaluated control group. Individual and mean percentage change or fold change from concurrent control values was used to describe and quantify treatment-related changes. For the final body weights, because there was no difference between control and low corticosterone-treated groups and no difference between the moderate- and high-dose corticosterone-treatment groups, these values were combined.
One-way or 2-way ANOVA, with adjustment for repeated measures when indicated, were used for statistical analysis followed by post hoc Tukey or Bonferroni multiple-comparison tests. For final body weight, a 2-tailed t test was done. All analyses were performed by using Prism 5.0 (GraphPad, San Diego, CA). Results were considered statistically significant when the P value was less than 0.05.
Results
Weight gain during chronic corticosterone administration.
Initial body weights did not vary between treatment groups (one-way ANOVA, Figure 1 A). After 4 wk of treatment, a difference in body weight was detected, with combined intermediate (50 μg/mL) and high (100 μg/mL) -dose treatment groups weighing significantly (2-tailed t test, P = 0.0308) more than combined control and low (25 μg/mL) –dose groups (Figure 1 B). This weight difference represented an approximately 10% increase in body weight over 25 d of treatment.
Figure 1.

Initial and final body weights in mice. (A) Initial body weights were not significantly different between control and corticosterone-treated groups. (B) A significant increase in body weight occurred after treatment in both the intermediate (50 μg/mL) and high (100 μg/mL) treatment groups, when compared with control (1% ethanol) and low (25 μg/mL) treatment groups. *, Significant (P < 0.05) difference compared with the initial value.
When examined over time, chronic corticosterone treatment through the drinking water resulted in dose-dependent weight gain (2-way repeated-measures ANOVA, P < 0.05; Figure 2 A). Confirming our previous results,20 effects were observed for time, treatment dose, and a time×dosage interaction (P < 0.0001). After 1 wk of corticosterone treatment, only the low-dose corticosterone group weighed significantly (Bonferroni, P < 0.05) less than did the control group. On day 14, the low-dose corticosterone group weighed less than did both the control and high-dose groups (Bonferroni; P < 0.01 and P < 0.0001, respectively). In addition, on day 14 the intermediate-dose corticosterone-treatment group weighed less than did the high-dose group (Bonferroni, P < 0.01). By 21 d of treatment, the high-dose corticosterone group had gained significantly (Bonferroni, P < 0.000) more weight than had the control and low-dose groups, and the intermediate-dose group weighed more (Bonferroni, P < 0.0001) than did the low-dose group. By the final day of corticosterone treatment (25 d), the intermediate treatment group weighed more (Bonferroni, P < 0.0001) than did the control and low-dose groups. In addition, the high-dose corticosterone-treatment mice weighed more than did the control and low-dose groups on day 25 of treatment (Bonferroni, P < 0.01 and P < 0.0001, respectively).
Figure 2.

Chronic corticosterone treatment affects body weight gain in mice in a dose-dependent manner. (A) Corticosterone treatment reduced body weight gain early during treatment in low-dose (25 μg/mL) corticosterone-treated mice and accelerated weight gain by the end of treatment in high-dose (100 μg/mL) corticosterone-treated animals. Mice receiving the 50-μg/mL dose of corticosterone showed an intermediate effect on body weight gain. (B) A similar pattern of weight gain occurred during the first 25 d of corticosterone treatment, and by 14 d after corticosterone withdrawal, body weights were comparable among all treatment groups. *, Significant (P < 0.05) difference compared with the initial value.
Because the current study replicated the findings of previous reports that indicated effects on body weight and because a previous finding from our group indicated a change in the mass of the gonadal fat pad,20 we explored histologic effects on adipocytes. In the present study, due to a great amount of variability in the vacuole size of white adipose tissue, we were unable to ascertain reliable histologic differences in white adipose tissue (data not shown). However, our histologic scoring system revealed a relative increase (one-way ANOVA, P < 0.0001) in the size of brown fat vacuoles in corticosterone-treated mice compared with controls (Tables 1 and 2).
Table 1.
Histologic scoring of tissues in mice after 25 d of corticosterone treatment
| Dose of corticosterone (μg/mL) |
||||
| 0 | 25 | 50 | 100 | |
| Thymus | 1 (n = 9)a | 2.00 (n = 10)b | 2.60 (n = 10)b,c | 3.18 (n = 11)c |
| Lymph nodes | 1 (n = 9)a | 1.16 (n = 9)a | 1.59 (n = 11)a | 1.75 (n = 9)b |
| Spleen | 1 (n = 9)a | 1.30 (n = 10)a | 1.00 (n = 11)a | 1.45 (n = 11)a |
| Liver | 2 (n = 9)a | 1.67 (n = 10)a | 1.09 (n = 11)b | 2.44 (n = 11)b |
| Adrenal gland, zona fasciulata | 1 (n = 8)a | 2.76 (n = 10)b | 2.51 (n = 11)b | 2.76 (n = 10)b |
| Adrenal gland, zona glomerulosa | 2 (n = 8)a | 0.97 (n = 10)a | 0.88 (n = 11)a | 1.09 (n = 10)a |
| Brown fat | 1 (n = 9)a | 1.50 (n = 10)b | 2.25 (n = 11)b | 2.25 (n = 10)b |
| Pituitary thickness (μm) | 395 (n = 5)a | 1.04 (n = 10)a | 0.93 (n = 7)a | 0.87 (n = 11)a |
Thymus, lymph nodes, and spleen were scored based on lymphoid depletion. The liver, zona fasciculata, zona glomerulosa, and brown fat were scored based on the presence and relative size of vacuoles. In addition, ex vivo thickness of formalin-fixed pituitary gland was measured. Values for control (0 μg/mL) group expressed as mean values for each tissue; those for treated groups (25, 50 and 100 μg/mL) are expressed as mean fold change ([mean treated value − mean control value]/mean control value) from control values. One-way ANOVA with post hoc Tukey multiple comparison tests were used to compare treated samples with control values. For each tissue, treatment values with different superscript letters are significantly (P < 0.05) different from each other.
Table 2.
Histologic scoring of tissues in mice after 25 d of corticosterone treatment followed by a 14-d recovery period
| Dose of corticosterone (μg/mL) |
||||
| 0 | 25 | 50 | 100 | |
| Thymus | 1 (n = 4)a | 1.00 (n = 8)a | 1.00 (n = 7)a | 1.00 (n = 8)a |
| Lymph nodes | 1 (n = 4)a,b | 1.00 (n = 8)a | 1.67 (n = 6)b | 1.00 (n = 8)a |
| Spleen | 1 (n = 4)a | 1.00 (n = 8)a | 1.00 (n = 7)a | 1.00 (n = 8)a |
| Liver | 3 (n = 4)a | 0.88 (n = 8)a | 0.83 (n = 7)a | 0.75 (n = 8)a |
| Adrenal gland, zona fasciulata | 2 (n = 4)a | 1.92 (n = 8)a,b | 1.81 (n = 7)a,b | 2.33 (n = 8)b |
| Adrenal gland, zona glomerulosa | 1 (n = 4)a | 1.30 (n = 8)a | 1.37 (n = 7)a | 1.30 (n = 8)a |
| Brown fat | 1 (n = 4)a,b | 1.63 (n = 8)a | 1.00 (n = 7)b | 1.50 (n = 8)a,b |
| Pituitary thickness (μm) | 458 (n = 4)a | 0.82 (n = 4)a,b | 0.99 (n = 7)a | 0.68 (n = 8)b |
Thymus, lymph nodes, and spleen were scored based on lymphoid depletion. The liver, zona fasciculata, zona glomerulosa, and brown fat were scored based on the presence and relative size of vacuoles. In addition, ex vivo thickness of formalin-fixed pituitary gland was measured. Values for control (0 μg/mL) group expressed as mean values for each tissue; those for treated groups (25, 50 and 100 μg/mL) are expressed as mean fold change ([mean treated value − mean control value]/mean control value) from control values. One-way ANOVA with post hoc Tukey multiple comparison tests were used to compare treated samples with control values. For each tissue, treatment values with different superscript letters are significantly (P < 0.05) different from each other.
Body weight change during recovery from corticosterone administration.
All treatment groups showed rapid normalization of body weight by 14 d after the cessation of corticosterone administration (2-way repeated-measures ANOVA, Figure 2 B). Effects were observed for time (P < 0.0001), treatment dose (P = 0.0069), and time×dosage interaction (P < 0.0001). After 1 wk of recovery on 1% ethanol, only the low-dose corticosterone-treatment mice weighed significantly less (Bonferroni, P < 0.01) than did the high-dose mice. After the full 2-wk recovery period, no statistical difference in body weight was noted between corticosterone-treated and control mice.
Effect of chronic corticosterone treatment on organ size.
Corticosterone treatment led to a change in liver size (one-way ANOVA, P = 0.0003; Table 3), with a significant (Tukey, P < 0.05) increase in liver size in the high-dose group compared with the low- and intermediate-dose groups. Thymus (one-way ANOVA, P < 0.0001; Table 3) and spleen (one-way ANOVA, P < 0.0001; Table 3) size decreased relative to total body weight with corticosterone treatment. All corticosterone-treated mice had significantly (Tukey, P < 0.05) lower thymic weights, compared with controls. Low-dose corticosterone-treatment mice had smaller (Tukey, P < 0.05) spleens than did the control group, and intermediate- and high-dose groups had smaller spleens (Tukey, P < 0.05) than did low-dose and control mice, representing a dose-dependent effect. Adrenal atrophy was noted in all corticosterone-treated groups (one-way ANOVA, P < 0.0001; Table 3).
Table 3.
Organ weight as a percentage of individual body weight after 25 d of corticosterone treatment (Treatment) and after a 14-d recovery period (Recovery)
| Dose of corticosterone (µg/mL) |
||||||||
| 0 |
25 |
50 |
100 |
|||||
| Treatment (n = 10) | Recovery (n = 4) | Treatment (n = 12) | Recovery (n = 8) | Treatment | Recovery (n = 7) | Treatment (n = 11) | Recovery (n = 8) | |
| Liver | 6.00a,b | 5.60d,e | –9.29a | −1.38d | –1.50a (n = 11) | 0.36d | 12.58b | −11.01e |
| Thymus | 0.1670a | 0.2012d,e | –76.90b | 12.19d | –79.11b (n = 11) | −23.96e | –89.23b | −13.09e |
| Spleen | 0.33a | 0.37d | –33.77b | −28.45d | –57.83c (n = 11) | −20.04d | –62.19c | −25.03d |
| Adrenal gland | 0.0177a | 0.0140d | –38.05b | −18.26e | –59.89b (n = 10) | −3.08d | –55.28b | −22.75e |
Values for the control (0 μg/mL) group are expressed as mean % of body weight for each tissue, and those of treated groups (25, 50, and 100 μg/mL) are expressed as % difference (that is, [mean treated value–mean control]/mean control x 100%) relative to control value. For each tissue, treatment doses indicated by different letters (a versus b versus c; d versus e) are significantly (P < 0.05; one-way ANOVA with post hoc Tukey multiple-comparison tests) different from each other.
Recovery of organ size after corticosterone withdrawal.
Liver size relative to total body weight was smaller (Tukey, P < 0.05; Table 3) in high-dose animals compared with low- and intermediate-dose groups but not controls. During the recovery period, thymus weight remained smaller (Tukey, P < 0.05; Table 3) in intermediate- and high-dose mice compared with the low-dose corticosterone-treatment group. In addition, adrenal gland size remained relatively small (Tukey, P < 0.05; Table 3) in low- and high-dose groups compared with intermediate and control groups. After a 2-wk recovery period, there was no statistical difference in splenic size between treatment groups (one-way ANOVA, P = 0.0669; Table 3).
Histologic alterations resulting from corticosterone treatment.
Lymphoid organs were scored for degree of lymphoid depletion; liver and adrenal glands were scored for degree of cytoplasmic vacuolation; and brown fat was scored based on vacuole size (Figure 3). After corticosterone treatment, significant (one-way ANOVA, P < 0.0001; Table 1) lymphoid depletion was noted in the thymus and lymph nodes. The high-dose corticosterone-treatment group had the most severe lymph node lymphoid depletion, compared with the control, low-dose, and intermediate-dose groups (Tukey, P < 0.05). Post hoc analysis revealed no significant differences in splenic lymphoid depletion between treatment groups (Tukey, P > 0.05; Table 1).
Figure 3.

Histologic scoring of representative sections of thymus, liver, adrenal glands, and brown fat from mice. Lymphoid depletion in the thymus, spleen, and lymph nodes was scored from 1 to 4, such that a score of 1 indicated no lymphoid depletion and a score of 4 indicated marked lymphoid depletion and rare lymphocytes. Vacuolation in the liver and adrenal glands was scored from 1 to 4, such that a score of 1 indicated no vacuolation, and a score of 4 indicated marked vacuolation. Vacuole size in brown fat was scored on a scale of 1 to 3, such that a score a 1 indicated vacuole size that was equivalent to that of controls, and a score of 3 indicated a moderate increase in vacuole size with many confluent vacuoles.
Corticosterone treatment increased (one-way ANOVA, P < 0.0001, Table 1) vacuolation of both centrilobular and periportal hepatocytes. Hepatocyte vacuolation was greatest (Tukey, P < 0.05) in the intermediate- and high-dose treatment groups. The livers of the mice in the 100-μg/mL group were grossly enlarged compared with those of the low- and intermediate-dose groups, consistent with histologic findings.
Prolonged corticosterone treatment was associated with increased vacuolation of the zona fasciculata cortical cells (one-way ANOVA, P < 0.0001, Table 1), but not in the zona glomerulosa cells (one-way ANOVA, P = 0.4206, Table 1) of the adrenal gland. However, no significant differences were noted in pituitary gland thickness between treatment groups (one-way ANOVA, P = 0.2115, Table 2).
Cellular recovery after corticosterone withdrawal.
After a 2-wk recovery period, no difference was noted in lymphoid depletion in the thymus and spleen or in vacuolation in the adrenal zona glomerulosa (one-way ANOVA, P = 0.5191) and liver (one-way ANOVA, P = 0.4345) between treatment groups (Table 2). Corticosterone-treated mice continued to have increased (one-way ANOVA, P = 0.0039, Table 2) cortical vacuolation in the adrenal zona fasciculata compared with that of controls after the recovery period. Histologically, lymphoid depletion in lymph nodes was greater in the intermediate-dose corticosterone-treatment group than in low- and high-dose groups (Tukey, P < 0.05) but not the control group (Table 2). The pituitary gland thickness of high-dose corticosterone-treatment mice was less (Tukey, P < 0.05, Table 2) than that of the control and intermediate-dose groups. Brown fat vacuoles remained enlarged (Tukey, P = 0.05) in the low-dose treatment group compared with the intermediate-dose group, but this effect did not occur in the control and high-dose groups (Table 2).
Corticosterone-induced changes in hematologic and bone marrow parameters.
Corticosterone treatment decreased WBC count (one-way ANOVA, P = 0.0013, Table 4) and both the absolute count and percentage of circulating lymphocytes (one-way ANOVA; absolute lymphocytes, P < 0.0001; percentage lymphocytes, P = 0.001; Table 4). Intermediate- and high-dose mice had lower (Tukey, P < 0.05) WBC counts and lower percentages of lymphocytes than did control and low-dose groups. Neutrophil percentage increased (one-way ANOVA, P = 0.0008; Table 4) with corticosterone dose. Post hoc analysis indicated that intermediate- and high-dose treatment groups had higher (Tukey, P < 0.05) percentages of neutrophils than did control and low-dose groups. Absolute monocyte count was significantly lower (Tukey, P < 0.05, Table 4) in the intermediate-dose group compared with the control group. Platelet counts were significantly higher (Tukey, P < 0.05, Table 4) in the intermediate-dose group than in the high-dose group. Peripheral blood showed no significant differences in absolute counts or percentages of monocytes, eosinophils, or basophils (data not shown). All corticosterone-treated groups had higher RBC counts (one-way ANOVA, P < 0.0001; Table 4), hematocrits (one-way ANOVA, P < 0.0001, Table 4), and hemoglobin levels (one-way ANOVA, P < 0.0001, Table 4) than did the control group.
Table 4.
Selected CBC parameters in mice after 25 d of corticosterone treatment
| Dose of corticosterone (μg/mL) |
||||
| 0 (n = 9) | 25 (n = 9) | 50 (n = 11) | 100 (n = 11) | |
| WBC (×103/mL) | 8.7a | −5.4a | −50.3b | −44.9b |
| RBC (×106/mL) | 10.2a | 8.8b | 12.8b | 9.4b |
| Hemoglobin (g/dL) | 14.8a | 9.1b | 13.8b | 12.2b |
| Hematocrit (%) | 52.1a | 8.8b | 11.3b | 13.7b |
| Neutrophils (%) | 24.3a | −2.7a | 86.1b | 97.3b |
| Lymphocytes (%) | 69.2a | 4.5a | −29.3b | −34.3b |
| Monocytes (U/μL) | 566a | −51.5a,b | −63.6b | −53.7a,b |
| Platelets (×103) | 1615a,b | −1.1a,b | 15.3a | −8.9b |
Values for control (0 μg/mL) group expressed as mean value for each analyte; values for treated groups (25, 50, and 100 μg/mL) expressed as % difference from control. Percentage difference = (mean treated value – mean control value)/mean control value x 100%. One-way ANOVA with post hoc Tukey multiple comparison tests were used to compare samples with control (0 μg/mL corticosterone, 1% ethanol) values. For each parameter, values with different superscript letters are significantly (P < 0.05) different from each other.
Consistent with peripheral blood cell counts, bone marrow smear analysis revealed a significant increase in erythroid lineage cells (one-way ANOVA; absolute erythroid, P = 0.0005; percentage erythroid, P = 0.0195). This shift may be due to absolute erythrocytosis secondary to corticosterone administration or may, in part, be relative to decreased lymphoid lineage cells (one-way ANOVA; absolute lymphoid, P = 0.0206; percentage lymphoid, P = 0.0184) in the bone marrow of corticosterone-treated animals. Corticosterone treatment had no effect on the myeloid population of the bone marrow (data not shown). In addition, no significant differences were observed in the ratio of myeloid to erythroid cells (data not shown).
Restoration of hemogram and bone marrow during recovery.
The WBC counts of chronically corticosterone-treated mice were not statistically different from those of controls after a 2-wk recovery period on ethanol; however, the low- and intermediate-dose groups had significantly fewer (Tukey, P < 0.05, Table 5) WBC compared with the high-dose treatment group. The intermediate-dose group had a lower absolute lymphocyte count than did the control and high-dose groups (Tukey, P < 0.05) but not the low-dose group. The lymphocyte percentage was not different among treatment groups (one-way ANOVA, P = 0.0927; Table 5). The intermediate-dose group had a higher (Tukey, P < 0.05) percentage of eosinophils than did the control and low-dose groups. By the end of the 2-wk treatment period, the percentages of neutrophils, monocytes, and basophils (data not shown); absolute eosinophil (data not shown), platelet, and RBC counts; hemoglobin concentration; and hematocrit did not vary markedly between treatment groups (Table 5). Likewise, bone marrow smear analysis demonstrated no significant differences in myeloid, erythroid, or lymphoid lineages or myeloid:erythroid cell ratio between treatment groups after a 2-wk recovery period (data not shown).
Table 5.
Selected CBC parameters in mice after 25 d of corticosterone treatment followed by a 14-d recovery period
| Dose of corticosterone (μg/mL) |
||||
| 0 (n = 4) | 25 (n = 8) | 50 (n = 7) | 100 (n = 8) | |
| WBC (×103/mL) | 8.0a,b | −35.6a | −44.6a | 14.1b |
| RBC (×106/mL) | 9.9a | 1.1a | −4.2a | −0.8a |
| Hemoglobin (g/dL) | 14.3a | 3.9a | −1.4a | 2.3a |
| Hematocrit (%) | 52.2a | 1.8a | −4.3a | −1.8a |
| Neutrophils (%) | 20.3a | −3.1a | 49.6a | 9.3a |
| Lymphocytes (%) | 75.8a | −1.0a | −19.8a | −6.6a |
| Monocytes (U/μL) | 320a | −36.7a | −18.5a | 79.4a |
| Platelets (×103) | 1424a | 2.9a | 7.0a | −12.8a |
Values for control (0 μg/mL) group expressed as mean value for each analyte; values for treated groups (25, 50, and 100 μg/mL) expressed as % difference from control. Percentage difference = (mean treated value – mean control value)/mean control value x 100%. One-way ANOVA with post hoc Tukey multiple comparison tests were used to compare samples with control (0 μg/mL corticosterone, 1% ethanol) values. For each parameter, values with different superscript letters are significantly (P < 0.05) different from each other.
Corticosterone-induced serum chemistry alterations.
Corticosterone treatment resulted in increases in ALT and AST activity and in albumin, globulin, total bilirubin, cholesterol, and triglycerides concentrations (one-way ANOVA, Table 6; ALT, P = 0.002; AST, P = 0.0024; albumin, P < 0.0001; globulin, P = 0.0123; total bilirubin, P = 0.0038; cholesterol, P < 0.0001; triglycerides, P = 0.0023). ALP decreased (one-way ANOVA, P = 0.0002; Table 6) after corticosterone treatment. High-dose corticosterone-treatment mice had elevated blood glucose (Tukey, P < 0.05, Table 6) and low chloride (Tukey, P < 0.05, Table 6) concentrations compared with control, low-dose, and intermediate-dose groups. Serum sodium levels were elevated (one-way ANOVA, P = 0.0017, Table 6) in low- and intermediate-dose mice compared with control mice. Sodium was higher in low-dose mice than in control and high-dose groups (Tukey, P < 0.05) but not the intermediate-dose group. In addition, the intermediate-dose corticosterone-treatment group had elevated (Tukey, P < 0.05) sodium compared with that of the control group. Serum phosphorous was lower (Tukey, P < 0.05) in the intermediate-dose group relative to the control group only. A dose-dependent increase in serum calcium concentration occurred (one-way ANOVA, P = 0.0038; Table 6) in corticosterone-treated mice, with a trend (one-way ANOVA, P = 0.0747; Table 6) for lower serum potassium concentration with corticosterone treatment. Overall, the anion gap was greater (one-way ANOVA, P < 0.0001; Table 6) in corticosterone-treated mice. BUN was significantly (Tukey, P < 0.05) lower in the low- and high-dose mice compared with intermediate-dose mice, but none of the treatment groups were significantly different from the control group. Creatinine (data not shown), total CO2, and osmolarity were not different among treatment groups (Table 6).
Table 6.
Selected serum chemistry parameters in mice after 25 d of corticosterone treatment
| Dose of corticosterone (μg/mL) |
||||
| 0 | 25 | 50 | 100 | |
| ALT (U/L) | 48.6 (n = 10)a | 4.1 (n = 12)a | 52.1 (n = 11)a,b | 156.0 (n = 12)b |
| AST (U/L) | 116.5 (n = 10)a | 41.7 (n = 12)a | 67.9 (n = 11)a,b | 123.5 (n = 12)b |
| Albumin (g/dL) | 2.9 (n = 10)a | 15.5 (n = 12)b | 35.0 (n = 11)c | 41.4 (n = 12)c |
| Globulin (g/dL) | 2.4 (n = 10)a | 22.0 (n = 10)b | 20.0 (n = 11)b | 19.6 (n = 12)b |
| Total bilirubin (mg/dL) | 0.21 (n = 10)a | −0.8 (n = 12)a | 25.5 (n = 11)a,b | 38.9 (n = 12)b |
| ALP (U/L) | 92.7 (n = 10)a | −27.3 (n = 12)b | −30.8 (n = 11)b | −32.7 (n = 12)b |
| Glucose (mg/dL) | 238.3 (n = 9)a | −15.0 (n = 10)a | −3.1 (n = 11)a | 45.8 (n = 12)b |
| Cl (mEq/L) | 107.8 (n = 10)a | −1.0 (n = 12)a | −1.9 (n = 11)a | −6.3 (n = 12)b |
| Na (mEq/L) | 151.6 (n = 10)a | 2.1 (n = 12)b | 2.0 (n = 11)b,c | 0.3 (n = 12)a,c |
| Ca (mg/dL) | 10.0 (n = 9)a | 1.1 (n = 11)a,b | 7.0 (n = 11)b,c | 8.0 (n = 12)c |
| K (mEq/L) | 7.8 (n = 10)a | −3.0 (n = 12)a | −5.5 (n = 11)a | −6.5 (n = 12)a |
| Anion gap (mEq/L) | 24.7 (n = 10)a | 24.8 (n = 11)b | 21.6 (n = 11)b | 33.2 (n = 12)b |
| Total CO2 (mEq/L) | 26.9 (n = 10)a | −7.1 (n = 11)a | −2.3 (n = 11)a | −5.2 (n = 12)a |
| Osmolity (mOsm/kg) | 288.4 (n = 10)a | 11.3 (n = 10)a | 12.2 (n = 11)a | 11.9 (n = 12)a |
| Cholesterol (mg/dL) | 86.2 (n = 10)a | 33.0 (n = 12)b | 68.1 (n = 11)c | 70.5 (n = 12)c |
| Triglycerides (mg/dL) | 99.3 (n = 3)a | 41.0 (n = 8)a | 97.0 (n = 7)a,b | 167.9 (n = 8)b |
Values for control (0 μg/mL) group expressed as mean values for each analyte; values for treated (25, 50, and 100 μg/mL) groups expressed as % difference ([mean treated value − mean control]/mean control × 100%) from control value. One-way ANOVA with post hoc Tukey multiple comparison tests were used to compared samples with control (0 μg/mL corticosterone, 1% ethanol) values. For each parameter, values with different superscript letters are significantly (P < 0.05) different from each other.
Serum chemistry recovery after corticosterone withdrawal.
No difference in ALT, AST, and ALP activity; total bilirubin; albumin; sodium; calcium; potassium; phosphorus (data not shown) or blood glucose concentration, total CO2, and osmolarity between treatment groups was detected after the 2-wk ethanol washout (Table 7). Corticosterone withdrawal resulted in a dose-dependent decrease (one-way ANOVA, P = 0.0117, Table 7) in globulin. Corticosterone treatment elevated globulin concentration, but withdrawal of exogenous corticosterone resulted in a rebound effect in the intermediate- and high-dose groups compared with the control group (Tukey, P < 0.05). Chloride was higher (Tukey, P < 0.05, Table 7) in the high-dose compared with the low-dose group but was not significantly different than that in the control or intermediate-dose groups. The anion gap in the low-dose mice was significantly (Tukey, P < 0.05, Table 7) higher than that in the high-dose group but not the intermediate-dose or control groups.
Table 7.
Selected serum chemistry parameters in mice after 25 d of corticosterone treatment followed by a 14-d recovery period
| Dose of corticosterone (μg/mL) |
||||
| 0 | 25 | 50 | 100 | |
| ALT (U/L) | 47.5 (n = 4)a | 46.6 (n = 8)a | −8.6 (n = 7)a | −12.1 (n = 8)a |
| AST (U/L) | 137.8 (n = 4)a | 48.7 (n = 8)a | −14.6 (n = 7)a | 7.0 (n = 8)a |
| Albumin (g/dL) | 2.9 (n = 4)a | 6.1 (n = 8)a | 5.8 (n = 7)a | −1.8 (n = 8)a |
| Globulin (g/dL) | 2.9 (n = 4)a | −12.6 (n = 8)a,b | −21.5 (n = 7)b | −17.8 (n = 8)b |
| Total bilirubin (mg/dL) | 0.20 (n = 4)a | 25.0 (n = 8)a | 7.1 (n = 7)a | 25.0(n = 8)a |
| ALP (U/L) | 97.5(n = 4)a | 34.5 (n = 8)a | 20.3 (n = 7)a | 17.2 (n = 8)a |
| Glucose (mg/dL) | 214.4 (n = 4)a | −3.5 (n = 8)a | −10.0 (n = 7)a | −4.6 (n = 8)a |
| Cl (mEq/L) | 108.5 (n = 4)a,b | 0.0 (n = 8)a | 0.5 (n = 7)a,b | 2.6 (n = 8)b |
| Na (mEq/L) | 153.8 (n = 4)a | 1.4 (n = 8)a | 0.6 (n = 7)a | −0.1 (n = 8)a |
| Ca (mg/dL) | 10.1 (n = 4)a | 0.4 (n = 8)a | 0.1 (n = 7)a | −0.9 (n = 8)a |
| K (mEq/L) | 7.9 (n = 4)a | −1.6 (n = 8)a | −0.7 (n = 7)a | 0.8 (n = 8)a |
| Anion gap (mEq/L) | 25.9 (n = 4)a,b | 15.4 (n = 8)a | 13.6 (n = 7)a,b | −5.5 (n = 8)b |
| Total CO2 (mEq/L) | 27.3 (n = 4)a | −7.3 (n = 8)a | −11.4 (n = 7)a | −5.5 (n = 8)a |
| Osmolity (mOsm/kg) | 320.1 (n = 4)a | 0.9 (n = 8)a | 0.0 (n = 7)a | −0.7 (n = 8)a |
| Cholesterol (mg/dL) | 82.3 (n = 4)a | 16.7 (n = 8)a,b | 22.6 (n = 7)b | 8.2 (n = 8)a,b |
| Triglycerides (mg/dL) | 68.0 (n = 4)a | −11.8 (n = 4)a | 59.9 (n = 7)b | 42.4 (n = 8)c |
Values for control (0 μg/mL) group expressed as mean values for each analyte; values for treated (25, 50, and 100 μg/mL) groups expressed as % difference ([mean treated value − mean control]/mean control × 100%) from control value. One-way ANOVA with post hoc Tukey multiple comparison tests were used to compared samples with control (0 μg/mL corticosterone, 1% ethanol) values. For each parameter, values with different superscript letters are significantly (P < 0.05) different from each other.
A decrease in BUN was observed after corticosterone withdrawal (one-way ANOVA, P = 0.0178). This effect was dose- dependent (Tukey, P < 0.05). Creatinine concentration after the 2-wk recovery period was significantly (Tukey, P < 0.05) decreased in the high-dose corticosterone-treatment group compared with control and other treatment groups. High cholesterol persisted in previously corticosterone-treated mice (one-way ANOVA, P = 0.0299, Table 7) but was only statistically significant (Tukey, P < 0.05) in mice treated with the intermediate dose when compared with control mice. In addition, triglycerides remained elevated (one-way ANOVA, P < 0.0001, Table 7) after recovery in intermediate- and high-dose corticosterone-treated mice compared with control and low-dose mice.
Urinalysis in corticosterone-treated mice.
Only the high-dose mice exhibited glucosuria after 25 d of corticosterone treatment; glucosuria was observed in 67% (6 of 9) of these mice (data not shown). No significant difference in urine-specific gravity was observed with corticosterone treatment (one-way ANOVA, P < 0.6927).
Urinalysis after recovery from corticosterone treatment.
No glucose was detected in the urine of any mouse assigned to recovery groups (data not shown). A dose-dependent increase (one-way ANOVA, P = 0.029) in urine specific gravity was observed after the 2-wk corticosterone withdrawal. High-dose corticosterone-treatment mice had significantly (Tukey, P < 0.05) higher urine specific gravity as compared with the control group.
Discussion
In this study, we used noninvasive delivery of corticosterone by means of the drinking water to explore the effects of chronic high corticosterone on mice. This treatment has previously been shown to cause gross changes in body weight and adiposity, increases in hormones including leptin and insulin, increases in plasma triglycerides, and impaired glucose tolerance.20,23 These changes were coupled with decreases in locomotor output and hyperphagia, and taken together includes some features of the metabolic syndrome.14,20,23 The present study focused on obtaining a detailed and comprehensive analysis of the anatomic, hematologic, and serum biochemical changes induced by corticosterone treatment of mice, with the expectation that further characterization of its effects would support the use of this system as a model of metabolic syndrome.
Confirming the results of our previous study,20 oral corticosterone delivered in water resulted in dose-dependent weight responses. Mice receiving 25 μg/mL corticosterone appeared to have blunted weight gain, whereas animals receiving 50 or 100 μg/mL corticosterone had accelerated weight gain during the final 2 wk of the treatment period.20 This effect is even more striking when considered in the context of our previous report that indicated that this increase in body weight is associated with a dramatic increase in the mass of the gonadal fat pad.20 Comparative work has suggested that the effect of exogenous corticosterone administration may be species-specific. Hamster and other mouse models for metabolic syndrome similarly have demonstrated weight gain, especially in the abdominal region.9,30,47,49 This outcome is in contrast to studies in rats, in which 200 to 400 μg/mL corticosterone in drinking water resulted in weight loss relative to that of nontreated controls.12,38,42 These species- and dose-associated differences serve to highlight the fact that in-depth analyses of the organism-wide effects of corticosterone treatment are needed to fully assess these different models.
Chronic exposure to corticosterone can have pronounced effects on numerous organ systems. Stress and corticosterone influence immune function, with acute stress usually leading to upregulation of many immune system components and chronic stress resulting in a general reduction in immune responses.11 Two key organs that are important in the immune system, the spleen and thymus, here showed decreases in size after corticosterone treatment, consistent with other studies using chronic corticosterone treatment.12,20,42 Transgenic and polygenic models of obesity and stress models in rodents all have demonstrated reductions of thymus and spleen size.32,49,53 In the present study, we determined that during corticosterone treatment the decreased spleen and thymus weights were due to lymphoid depletion in these organs. This change in organ structure may underlie both the basal effects on immune cells that we observed here and effects on the immune response that have been reported in other models of chronic stress or chronic corticosterone delivery.9,11
The hypothalamic–pituitary–adrenal axis is not only responsible for stress-induced release of corticosterone (among other mediators) but is also the main regulatory circuit that governs diurnal periodicity of plasma corticosterone. In both nocturnal and diurnal species, corticosterone begins to rise late in the sleep phase and peaks just before waking.19,24 A consequence of chronic high corticosterone is a shutdown in the hypothalamic–pituitary–adrenal axis; this cessation can be mediated by central changes (for example, in the cells of the paraventricular nucleus that secrete corticotrophin-releasing hormone or in pituitary adrenocorticotrophs that secrete adrenocorticotropin-releasing hormone) or by alterations in the structure and function of the adrenal gland. In our mice, corticosterone treatment reduced the size of the adrenal gland, primarily through changes in the zona fasciculata, which is principally responsible for the production of glucocorticoids. However, corticosterone treatment had no effect on pituitary gland thickness in the current study. Future studies using immunohistochemical staining of the pituitary gland may reveal effects on adrenocorticotrophs that could affect the function of hypothalamic cells containing corticotrophin-releasing hormone.
To further clarify changes observed previously in weight, leptin, insulin, triglycerides, and glucose tolerance20 we examined the liver, white adipose tissue, and brown fat. We observed liver enlargement and changes in histologic morphology in the high corticosterone-treated group, consistent with steroid hepatopathy and glycogen accumulation as a result of glucocorticoid-induced dyslipidemia and hyperglycemia. Several case reports in humans and dogs and one in a domestic cat have demonstrated hepatic glycogen accumulation from excessive glucocorticoids.13,18,43,45 Glucocorticoids also induce cytologic changes in adipocytes.3 Previous reports using this model found an increase in mass of white adipose tissue in the gonads.20 To extend these findings, we examined adipocytes for histologic changes. We observed an increase in the size of brown fat cells in corticosterone-treated mice, consistent with previous observations in rats and golden hamsters.37 This change may indicate a shift in thermogenesis and may represent a compensatory response to increase energy output.
We undertook the recovery portion of this experiment to better understand the physiologic rate of recovery after chronic corticosterone treatment withdrawal. Within a few days after withdrawal of corticosterone treatment, experimentally treated mice had regained normal appearance and were indistinguishable from control mice. However, although previously treated mice appeared grossly normal, we suspected that long-term metabolic alterations might persist for weeks after corticosterone treatment was discontinued. One study reported rapid recovery (4 wk) after corticosterone treatment withdrawal based on organ size,23 but this finding contrasts a clinical case report of 12 cats that took an average of 4.5 mo to appear grossly normal after chronic hyperadrenocorticism.26 Few studies have examined recovery of organ size after discontinuation of chronic oral corticosterone administration. One study demonstrated that spleen, thymus, and adrenal gland weights were comparable to control organ weights 4 wk after corticosterone withdrawal.23 In the present study, we examined an earlier time point (2 wk) to more accurately identify organ recovery after corticosterone treatment. Of the spleen, thymus, liver, and adrenal gland, only the spleen size of previously corticosterone-treated groups was comparable to that of the control group at the end of the recovery period. In addition, splenic lymphoid depletion was not different between corticosterone-treated and control mice during experimental treatment or after the recovery period. Small, but significant, differences in liver, thymic, and adrenal gland size were present 2 wk after corticosterone withdrawal. The persistent differences in organ size that we observed may be due, in part, to the small size of experimental groups.
Histologically, liver and thymus showed full recovery 2 wk after withdrawal of exogenous corticosterone administration. In addition, lymphoid depletion in the lymph nodes and brown fat size in corticosterone-treated mice did not differ from those of the control mice at the end of the recovery period. Reduced pituitary gland thickness occurred in the high corticosterone-treated group, the cause of which requires further investigation. The adrenal glands of mice previously treated with corticosterone had persistent cortical cell vacuolation after the 2-wk recovery period; this degenerative change indicates incomplete adrenal gland recovery. We did not measure serum corticosterone levels to further assess adrenal gland function in the current study. Additional studies are warranted to further clarify the physiologic effects of exogenous corticosterone treatment and withdrawal.
Minimal to moderate corticosterone-related clinical pathologic changes were apparent in all groups of mice that received corticosterone in drinking water. In general, these changes were dose-dependent, numerous, and consistent with corticosterone-induced systemic change. The peripheral blood cell changes were typical of what has been reported in cats and rodents with iatrogenic hyperadrenocorticism, including glucocorticoid-induced lympholysis, decreased mitosis, and leukocyte redistribution.9,26 The higher neutrophil percentage and lower lymphocyte percentage in corticosterone-treated mice is consistent with glucocorticoid-associated leukocyte redistribution. In addition, the lower peripheral blood lymphocyte percentage, decreased number of bone marrow lymphoid lineage cells, decreased lymphoid organ size, and lymphoid depletion are suggestive of glucocorticoid-induced lympholysis, with decreased mitosis of lymphoid cells. Rodents normally have a high percentage4 of lymphocytes in the bone marrow population, comprising one-fifth to one-third of all bone marrow cells, and therefore a decrease in the lymphoid lineage would affect the relative composition of other bone marrow constituents.
The higher RBC count, hemoglobin concentration, and hematocrit combined with the increased bone marrow erythroid cell population in our corticosterone-treated mice suggest increased production of RBC and possible hemoconcentration, as supported by higher total protein. A study in humans with more than 3 risk factors for metabolic syndrome also demonstrated significantly elevated red blood cell counts and hemoglobin.51 The elevated bone marrow erythroid population may partially be due to the relative decrease in the lymphocyte population. A study in Syrian hamsters found that acute administration of cortisone depressed mitotic activity in both the myeloid and erythroid series8 and concluded that acute cortisone administration caused temporary inhibition of bone marrow cellular proliferation.
With the exception of the WBC count, changes in peripheral hematologic parameters were quickly reversed 2 wk after corticosterone removal. After corticosterone withdrawal, the WBC count of the high-dose corticosterone-treatment group was higher than those of the low- and intermediate-dose groups; however, none of the corticosterone-treated groups differed significantly from the control group. These mild differences may be due to individual animal variability or small sample size. Similar to peripheral blood cell changes, all corticosterone-induced changes in the bone marrow were completely reversed after the 2-wk recovery period. This reversal demonstrates rapid bone marrow progenitor cell recovery after corticosterone withdrawal. Rebound phenomena of hematologic parameters can occur after the effects of corticosteroids have subsided;9 however, we did not observe rebound phenomena in our study.
Several significant changes in the serum chemistry profile of corticosterone-treated mice occurred that are commonly noted with glucocorticoid administration and metabolic syndrome. Glucose intolerance and dyslipidemia are key features in Cushing and metabolic syndromes. We observed a significant increase in blood glucose with glucosuria in the 100-μg/mL mice, suggestive of glucose intolerance. This conclusion is supported by our previous work that showed hypercortisolemia, hyperinsulinemia, hyperleptinemia, elevated plasma triglycerides, and functional metabolic deficits with impaired glucose clearance after glucose challenge in mice treated for 4 wk with high-dose corticosterone in water.20 In contrast to a previous study38 that did not show changes in serum glucose concentration between corticosterone-treated groups, the alterations in blood and urine glucose in the present study may be due to differences in dose, species, and duration of treatment. In addition, we observed elevated cholesterol and triglyceride concentrations in corticosterone-treated mice. Other reports have demonstrated increased blood glucose and triglyceride concentration, and transaminase activity with metabolic syndrome and glucocorticoid administration in humans, rodents, and other species.8,9,20,23,26,30,32
We also noted elevations in ALT and AST activity in our corticosterone-treated mice. These findings correlated with the gross liver enlargement and increased hepatocyte vacuolation, consistent with the glycogen accumulation in the high-dose mice. In addition, triglycerides and cholesterol can be elevated due to stimulation of lipolysis by glucocorticoids. We found a decrease in ALP with corticosterone treatment, whereas a study that used restraint stress in mice found an increase in ALP and serum corticosterone.21 In rodents, decreased ALP can occur with decreased food intake, decreased bone formation, or (rarely) liver enzyme induction.5 We did not measure food intake in the current study, but a similar previous study revealed an increase in food intake in corticosterone-treated animals.20 We therefore thought it unlikely that ALP activity was decreased secondary to decreased food intake. Human patients with Cushing syndrome are known to have decreased ALP resulting from the catabolic effects of glucocorticoids on bone.8,29 The cause of the decreased ALP in the current case may be due to glucocorticoid effects on bone, but we cannot rule out changes in liver-associated ALP.
We noted significant, dose-dependent increases in both serum albumin and globulin and increased RBC mass, which are consistent with hemoconcentration and metabolic syndrome.51 These changes were not accompanied by concurrent increases in serum electrolytes or creatinine in the high-dose group, as typically would be seen with decreased water intake. Another study also observed increased albumin and globulin in corticosterone-treated rats.38 In contrast, a study of nearly 100 human patients found a significant decrease in albumin and globulin levels prior to therapy for Cushing syndrome, although the protein concentrations of these patients remained within published reference ranges.39 Differences in serum albumin and globulin concentrations may be due to species-specific metabolism, variable metabolism of exogenous compared with endogenous glucocorticoid excess, or the chronicity of glucocorticoid excess.
In our study, serum sodium was elevated in the low- and intermediate-dose corticosterone-treatment groups compared with that in controls, but sodium concentration decreased with increasing corticosterone dose despite clinical pathologic evidence of a dose-dependent hemoconcentration. We postulated that as corticosterone dose increased, renal loss of electrolytes, water, and BUN increased. Hyperglycemia, glucosuria, greater chloride concentration compared with sodium concentration, and increased anion gap suggest accumulation of unidentified anions, possibly associated with metabolic acidosis in high-dose mice. A minor effect of elevated albumin may be a slightly elevated anion gap.50 Although we did not assess fluid balance in the current study, the loss of anions or an osmole such as glucose, combined with decreases in sodium and other blood constituents, is suggestive of diuresis and possible polyuria and polydipsia. When drinking behavior was monitored, water intake did not differ between control (1% ethanol) and 25-μg/mL groups but was significantly greater in the 100-μg/mL group (Figure 4). Creatinine is minimally affected by diuresis, and no significant decrease in creatinine concentration was noted. We also noted a dose-dependent trend in serum potassium loss in high-dose mice. This change was not statistically significant, but because of the high biologic effect of potassium on physiology, these small changes may be biologically important. Hypokalemia has been reported to occur after exogenous glucocorticoid administration and during Cushing and metabolic syndromes.8,25,48 In addition, the method of euthanasia used in the present study, CO2 inhalation, has been reported to artificially increase serum potassium.52 Lastly, the dose-dependent increase in serum calcium may have been secondary to an increased bound fraction of calcium due to increased albumin concentration.
Figure 4.
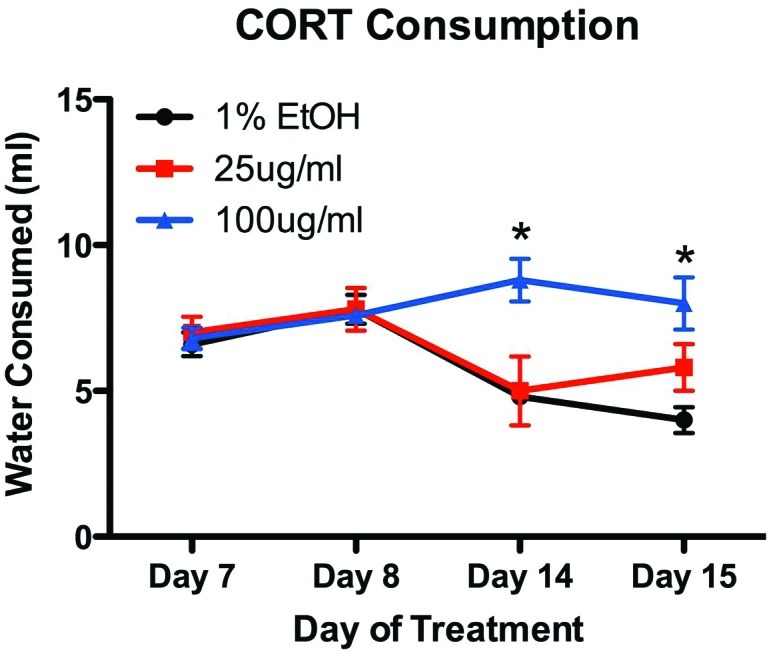
Drinking behavior was assessed as the amount of water consumed by an entire cage of mice (n = 4) on treatment days 7 and 8 and that consumed by a different cage of mice on days 8, 14, and 15. Although both control mice and those treated with a low dose of corticosterone showed a modest decrease in water consumption as the experiment progressed, animals treated with high doses of corticosterone showed an increase in water consumption.
Although the majority of serum chemical parameters returned to pretreatment control levels after corticosterone withdrawal, protein, lipid, and electrolyte abnormalities persisted. Serum levels of cholesterol and triglycerides were reduced greatly during the recovery period, but significant lipid elevations remained in the intermediate- and high-dose groups. Unlike lipid metabolism, liver function and glucose metabolism were restored by the end of the recovery period. The absence of glucosuria and the normalization of blood glucose concentration after removal of exogenous corticosterone are suggestive of rapid restoration of glucose metabolism after glucocorticoid withdrawal. The absence of glucose intolerance after 2 wk of corticosterone withdrawal suggests that high circulating plasma corticosterone alone does not impair glucose clearance, but that long-term exposure to high corticosterone levels gradually alters the regulation of glucose metabolism. The liver enzymes ALT and AST and total bilirubin normalized by the end of the recovery period.
We observed a rebound effect in globulin and chloride concentrations. Low BUN and creatinine concentrations and a low anion gap in the high-dose compared with low-dose group suggested continued recovery from corticosterone-induced diuresis. This effect may be due to rehydration, revealing the loss of these analytes as a result of corticosterone treatment that was previously masked by dehydration. The increase in urine-specific gravity in corticosterone-treated mice supports the reestablishment of normal hydration status after corticosterone withdrawal. A low creatinine level may be due to decreased muscle mass in cushingoid mice. As discussed earlier, persistent vacuolation of the adrenal gland was present 2 wk after corticosterone withdrawal; the zona fasciculata is important in glucocorticoid metabolism; and glucocorticoids may act on both glucocorticoid and mineralocorticoid receptors.17 Therefore, persistent cellular damage of the cortical cells may have contributed to electrolyte abnormalities and had a role in the reestablishment of hydration status. Finally, normalization of sodium and albumin concentrations is supportive of rehydration after the cessation of exogenous corticosterone administration.
The provision of corticosterone in drinking water offers several technical advantages over methods involving dietary manipulation, constant-release pellets, repeated injections, physical or physiologic stress, or genetic manipulation. Diet-induced obesity can take weeks to months to develop, consuming both time and resources.34 Surgical models can be developed relatively quickly, but adrenalectomy with implantation of steroid-releasing pellets is irreversible and invasive, lacks a physiologic rhythm of corticosterone secretion, and accommodates only short-term delivery of compounds.42 Studies involving stressors or repeated injections can result in the release of confounding stress-associated hormones and factors, including epinephrine, norepinephrine, adrenocorticotropic hormone, corticotropin-releasing hormone, vasopressin, and endorphins.40,53 Genetic models require considerable time to develop, may be of limited availability, and may have multiple phenotypes associated with their genetic background.
A primary limitation of this model is the inability to control the size and timing of individual oral doses of corticosterone. However, given the many significant effects reported here, such variability may not be as a major confound but should still be acknowledged. A second limitation is the potential variability in the metabolism of oral corticosterone compared with parenterally administered or intrinsically produced corticosterone. Orally consumed corticosterone may undergo numerous metabolic changes over a prolonged time, unlike corticosterone delivered as a bolus (for example, subcutaneously) or tonically (for example, minipump or transdermal patch). However, each of those treatment routes has their own drawbacks and benefits.
In conclusion, the results of our study confirm that C57BL/6NCrl mice that receive 100 μg/mL corticosterone in drinking water develop clinical signs and pathologic changes that include weight gain, dyslipidemia, and compromised glucose tolerance, as well as increases in plasma insulin and leptin.20 Moreover, the current study extends those results to show decreased lymphoid organ size with leukocyte redistribution, steroid hepatopathy, adrenal gland atrophy of the zona fasciculata, and electrolyte aberrations. Mice that received low (25 μg/mL) and intermediate (50 μg/mL) doses of oral corticosterone had clinical signs and pathologic changes consistent with the early onset of metabolic syndrome. Administering corticosterone in the drinking water produces a straightforward, rapid, noninvasive, and reversible model of metabolic syndrome that can be used to further elucidate the role of glucocorticoids in metabolic syndrome. In addition, 2 wk is insufficient time for full physiologic recovery of mice previously chronically treated with corticosterone. This finding leads us to our hypothesis that subsequent exposure to corticosterone treatment prior to full recovery may result in altered metabolic responses to glucocorticoids and potentially even more deleterious effects.
Acknowledgments
We acknowledge Jackie Candelier, Mor Mboup, and Nancy Pinard for their technical assistance. This work was supported by The Rockefeller University.
References
- 1.Bjorntorp P. 1993. Visceral obesity: a ‘civilization syndrome.’ Obes Res 1:206–222 [DOI] [PubMed] [Google Scholar]
- 2.Bjorntorp P, Rosmond R. 2000. The metabolic syndrome—a neuroendocrine disorder? Br J Nutr 83 Suppl 1:S49–S57 [DOI] [PubMed] [Google Scholar]
- 3.Bjorntorp P, Rosmond R. 2000. Obesity and cortisol. Nutrition 16:924–936 [DOI] [PubMed] [Google Scholar]
- 4.Bolliger AP, Everds NE, Zimmerman KL, Moore DM, Smith SA, Barnhart K.2010. Hematology of laboratory animals, p 860. In: Weiss DJ, Wardrop KJ. Schalm's veterinary hematology, 6th ed. Ames (IA): Wiley–Blackwell.
- 5.Boone L, Meyer D, Cusick P, Ennulat D, Bolliger AP, Everds N, Meador V, Elliott G, Honor D, Bounous D, Jordan H. 2005. Selection and interpretation of clinical pathology indicators of hepatic injury in preclinical studies. Vet Clin Pathol 34:182–188 [DOI] [PubMed] [Google Scholar]
- 6.Bronnegard M, Arner P, Hellstrom L, Akner G, Gustafsson JA. 1990. Glucocorticoid receptor messenger ribonucleic acid in different regions of human adipose tissue. Endocrinology 127:1689–1696 [DOI] [PubMed] [Google Scholar]
- 7.Brunner EJ, Marmot MG, Nanchahal K, Shipley MJ, Stansfeld SA, Juneja M, Alberti KG. 1997. Social inequality in coronary risk: central obesity and the metabolic syndrome. Evidence from the Whitehall II study. Diabetologia 40:1341–1349 [DOI] [PubMed] [Google Scholar]
- 8.Buchman AL. 2001. Side effects of corticosteroid therapy. J Clin Gastroenterol 33:289–294 [DOI] [PubMed] [Google Scholar]
- 9.Cardinali G, Decaro BM, Handler AH, Aboul-Enein M. 1964. Effect of high doses of cortisone on bone marrow cell proliferation in the Syrian hamster. Cancer Res 24:969–972 [PubMed] [Google Scholar]
- 10.Dallman MF, Pecoraro N, Akana SF, La Fleur SE, Gomez F, Houshyar H, Bell ME, Bhatnagar S, Laugero KD, Manalo S. 2003. Chronic stress and obesity: a new view of ‘comfort food.’ Proc Natl Acad Sci USA 100:11696–11701 [DOI] [PMC free article] [PubMed] [Google Scholar]
- 11.Dhabhar FS. 2003. Stress, leukocyte trafficking, and the augmentation of skin immune function. Ann N Y Acad Sci 992:205–217 [DOI] [PubMed] [Google Scholar]
- 12.Ehrich M, Hancock S, Ward D, Holladay S, Pung T, Flory L, Hinckley J, Jortner BS. 2004. Neurologic and immunologic effects of exposure to corticosterone, chlorpyrifos, and multiple doses of tri-ortho-tolyl phosphate over a 28-day period in rats. J Toxicol Environ Health A 67:431–457 [DOI] [PubMed] [Google Scholar]
- 13.Fittschen C, Bellamy JE. 1984. Prednisone-induced morphologic and chemical changes in the liver of dogs. Vet Pathol 21: 399–406 [DOI] [PubMed] [Google Scholar]
- 14.Gourley SL, Wu FJ, Kiraly DD, Ploski JE, Kedves AT, Duman RS, Taylor JR. 2008. Regionally specific regulation of ERK MAP kinase in a model of antidepressant-sensitive chronic depression. Biol Psychiatry 63:353–359 [DOI] [PMC free article] [PubMed] [Google Scholar]
- 15.Grundy SM, Brewer HB, Jr, Cleeman JI, Smith SC, Jr, Lenfant C. 2004. Definition of metabolic syndrome: report of the National Heart, Lung, and Blood Institute–American Heart Association conference on scientific issues related to definition. Arterioscler Thromb Vasc Biol 24:e13–e18 [DOI] [PubMed] [Google Scholar]
- 16.Hautanen A, Raikkonen K, Adlercreutz H. 1997. Associations between pituitary–adrenocortical function and abdominal obesity, hyperinsulinaemia, and dyslipidaemia in normotensive males. J Intern Med 241:451–461 [DOI] [PubMed] [Google Scholar]
- 17.Hoppmann J, Perwitz N, Meier B, Fasshauer M, Hadaschik D, Lehnert H, Klein J. 2010. The balance between gluco- and mineralocorticoid action critically determines inflammatory adipocyte responses. J Endocrinol 204:153–164 [DOI] [PubMed] [Google Scholar]
- 18.Iancu TC, Shiloh H, Dembo L. 1986. Hepatomegaly following short-term high-dose steroid therapy. J Pediatr Gastroenterol Nutr 5:41–46 [DOI] [PubMed] [Google Scholar]
- 19.Kalsbeek A, Van Der Vliet J, Buijs RM. 1996. Decrease of endogenous vasopressin release necessary for expression of the circadian rise in plasma corticosterone: a reverse microdialysis study. J Neuroendocrinol 8:299–307 [DOI] [PubMed] [Google Scholar]
- 20.Karatsoreos IN, Bhagat SM, Bowles NP, Weil ZM, Pfaff DW, McEwen BS. 2010. Endocrine and physiological changes in response to chronic corticosterone: a potential model of the metabolic syndrome in mouse. Endocrinology 151:2117–2127 [DOI] [PMC free article] [PubMed] [Google Scholar]
- 21.Kour K, Bani S. 2011. Chicoric acid regulates behavioral and biochemical alterations induced by chronic stress in experimental Swiss albino mice. Pharmacol Biochem Behav 99:342–348 [DOI] [PubMed] [Google Scholar]
- 22.Larsen JL, Cathey WJ, Odell WD. 1986. Primary adrenocortical nodular dysplasia, a distinct subtype of Cushing's syndrome. Case report and review of the literature. Am J Med 80:976–984 [DOI] [PubMed] [Google Scholar]
- 23.Lee RS, Tamashiro KL, Yang X, Purcell RH, Harvey A, Willour VL, Huo Y, Rongione M, Wand GS, Potash JB. 2010. Chronic corticosterone exposure increases expression and decreases deoxyribonucleic acid methylation of Fkbp5 in mice. Endocrinology 151:4332–4343 [DOI] [PMC free article] [PubMed] [Google Scholar]
- 24.Lemos DR, Downs JL, Urbanski HF. 2006. Twenty-four-hour rhythmic gene expression in the rhesus macaque adrenal gland. Mol Endocrinol 20:1164–1176 [DOI] [PubMed] [Google Scholar]
- 25.Li W, Bai Y, Sun K, Xue H, Wang Y, Song X, Fan X, Song H, Han Y, Hui R. 2009. Patients with metabolic syndrome have prolonged corrected QT interval (QTc). Clin Cardiol 32:E93–E99 [DOI] [PMC free article] [PubMed] [Google Scholar]
- 26.Lien YH, Huang HP, Chang PH. 2006. Iatrogenic hyperadrenocorticism in 12 cats. J Am Anim Hosp Assoc 42:414–423 [DOI] [PubMed] [Google Scholar]
- 27.Macfarlane DP, Forbes S, Walker BR. 2008. Glucocorticoids and fatty acid metabolism in humans: fuelling fat redistribution in the metabolic syndrome. J Endocrinol 197:189–204 [DOI] [PubMed] [Google Scholar]
- 28.Magarinos AM, Orchinik M, McEwen BS. 1998. Morphological changes in the hippocampal CA3 region induced by noninvasive glucocorticoid administration: a paradox. Brain Res 809:314–318 [DOI] [PubMed] [Google Scholar]
- 29.Mancini T, Doga M, Mazziotti G, Giustina A. 2004. Cushing's syndrome and bone. Pituitary 7:249–252 [DOI] [PubMed] [Google Scholar]
- 30.Masuzaki H, Paterson J, Shinyama H, Morton NM, Mullins JJ, Seckl JR, Flier JS. 2001. A transgenic model of visceral obesity and the metabolic syndrome. Science 294:2166–2170 [DOI] [PubMed] [Google Scholar]
- 31.Montague CT, O'Rahilly S. 2000. The perils of portliness: causes and consequences of visceral adiposity. Diabetes 49:883–888 [DOI] [PubMed] [Google Scholar]
- 32.Morton NM, Densmore V, Wamil M, Ramage L, Nichol K, Bunger L, Seckl JR, Kenyon CJ. 2005. A polygenic model of the metabolic syndrome with reduced circulating and intraadipose glucocorticoid action. Diabetes 54:3371–3378 [DOI] [PubMed] [Google Scholar]
- 33.Nieuwenhuizen AG, Rutters F. 2008. The hypothalamic–pituitary–adrenal axis in the regulation of energy balance. Physiol Behav 94:169–177 [DOI] [PubMed] [Google Scholar]
- 34.Nuotio-Antar AM, Hachey DL, Hasty AH. 2007. Carbenoxolone treatment attenuates symptoms of metabolic syndrome and atherogenesis in obese, hyperlipidemic mice. Am J Physiol Endocrinol Metab 293:E1517–E1528 [DOI] [PubMed] [Google Scholar]
- 35.Paterson JM, Morton NM, Fievet C, Kenyon CJ, Holmes MC, Staels B, Seckl JR, Mullins JJ. 2004. Metabolic syndrome without obesity: hepatic overexpression of 11β-hydroxysteroid dehydrogenase type 1 in transgenic mice. Proc Natl Acad Sci USA 101:7088–7093 [DOI] [PMC free article] [PubMed] [Google Scholar]
- 36.Peeke PM, Chrousos GP. 1995. Hypercortisolism and obesity. Ann N Y Acad Sci 771:665–676 [DOI] [PubMed] [Google Scholar]
- 37.Pellet H, Guerrier D, Thonnerieux M, Vigier M. 1975. [Influence of the pituitary–adrenal axis on the brown fat tissue of the rat and golden hamster] Bull Assoc Anat (Nancy) 59:479–488 [Article in French] [PubMed] [Google Scholar]
- 38.Pung T, Zimmerman K, Klein B, Ehrich M. 2003. Corticosterone in drinking water: altered kinetics of a single oral dose of corticosterone and concentrations of plasma sodium, albumin, globulin, and total protein. Toxicol Ind Health 19:171–182 [DOI] [PubMed] [Google Scholar]
- 39.Putignano P, Kaltsas GA, Korbonits M, Jenkins PJ, Monson JP, Besser GM, Grossman AB. 2000. Alterations in serum protein levels in patients with Cushing's syndrome before and after successful treatment. J Clin Endocrinol Metab 85:3309–3312 [DOI] [PubMed] [Google Scholar]
- 40.Rangon CM, Fortes S, Lelievre V, Leroux P, Plaisant F, Joubert C, Lanfumey L, Cohen-Salmon C, Gressens P. 2007. Chronic mild stress during gestation worsens neonatal brain lesions in mice. J Neurosci 27:7532–7540 [DOI] [PMC free article] [PubMed] [Google Scholar]
- 41.Reaven GM. 1988. Banting lecture 1988. Role of insulin resistance in human disease. Diabetes 37:1595–1607 [DOI] [PubMed] [Google Scholar]
- 42.Rebuffe-Scrive M, Walsh UA, McEwen B, Rodin J. 1992. Effect of chronic stress and exogenous glucocorticoids on regional fat distribution and metabolism. Physiol Behav 52:583–590 [DOI] [PubMed] [Google Scholar]
- 43.Rogers WA, Ruebner BH. 1977. A retrospective study of probable glucocorticoid-induced hepatopathy in dogs. J Am Vet Med Assoc 170:603–606 [PubMed] [Google Scholar]
- 44.Saunders D, Adelstein RS, Conti MA, Zhang Y. 2010. Mouse urine collection using single animal model. J Am Assoc Lab Anim Sci 49:686 [Google Scholar]
- 45.Schaer M, Ginn PE. 1999. Iatrogenic Cushing's syndrome and steroid hepatopathy in a cat. J Am Anim Hosp Assoc 35:48–51 [DOI] [PubMed] [Google Scholar]
- 46.Seckl JR, Walker BR. 2001. Minireview: 11β-hydroxysteroid dehydrogenase type 1—a tissue-specific amplifier of glucocorticoid action. Endocrinology 142:1371–1376 [DOI] [PubMed] [Google Scholar]
- 47.Smart JL, Tolle V, Low MJ. 2006. Glucocorticoids exacerbate obesity and insulin resistance in neuron-specific proopiomelanocortin-deficient mice. J Clin Invest 116:495–505 [DOI] [PMC free article] [PubMed] [Google Scholar]
- 48.Smets P, Meyer E, Maddens B, Daminet S. 2010. Cushing's syndrome, glucocorticoids, and the kidney. Gen Comp Endocrinol 169:1–10 [DOI] [PubMed] [Google Scholar]
- 49.Stenzel-Poore MP, Cameron VA, Vaughan J, Sawchenko PE, Vale W. 1992. Development of Cushing's syndrome in corticotropin-releasing factor transgenic mice. Endocrinology 130:3378–3386 [DOI] [PubMed] [Google Scholar]
- 50.Stockham SL, Scott MA. 2008. Fundamentals of veterinary clinical pathology. Oxford (UK): Blackwell Publishing [Google Scholar]
- 51.Taki K, Nishio K, Hamajima N, Niwa T. 2008. Metabolic syndrome defined by new criteria in Japanese is associated with increased liver enzymes and C-reactive protein. Nagoya J Med Sci 70:1–9 [PubMed] [Google Scholar]
- 52.Traslavina RP, King EJ, Loar AS, Riedel ER, Garvey MS, Ricart-Arbona R, Wolf FR, Couto SS. 2010. Euthanasia by CO inhalation affects potassium levels in mice. J Am Assoc Lab Anim Sci 49:316–322 [PMC free article] [PubMed] [Google Scholar]
- 53.Ulrich-Lai YM, Figueiredo HF, Ostrander MM, Choi DC, Engeland WC, Herman JP. 2006. Chronic stress induces adrenal hyperplasia and hypertrophy in a subregion-specific manner. Am J Physiol Endocrinol Metab 291:E965–E973 [DOI] [PubMed] [Google Scholar]
- 54.Verma P, Hellemans KG, Choi FY, Yu W, Weinberg J. 2010. Circadian phase and sex effects on depressive–anxiety-like behaviors and HPA axis responses to acute stress. Physiol Behav 99:276–285 [DOI] [PMC free article] [PubMed] [Google Scholar]
- 55.Wajchenberg BL. 2000. Subcutaneous and visceral adipose tissue: their relation to the metabolic syndrome. Endocr Rev 21:697–738 [DOI] [PubMed] [Google Scholar]
- 56.Wolf G. 2002. Glucocorticoids in adipocytes stimulate visceral obesity. Nutr Rev 60:148–151 [DOI] [PubMed] [Google Scholar]