Abstract
The goal of this study was to characterize acute neuronal injury in a novel nonhuman primate (NHP) ischemic stroke model by using multiple outcome measures. Silk sutures were inserted into the M1 segment of the middle cerebral artery of rhesus macaques to achieve permanent occlusion of the vessel. The sutures were introduced via the femoral artery by using endovascular microcatheterization techniques. Within hours after middle cerebral artery occlusion (MCAO), infarction was detectable by using diffusion-weighted MRI imaging. The infarcts expanded by 24 h after MCAO and then were detectable on T2-weighted images. The infarcts seen by MRI were consistent with neuronal injury demonstrated histologically. Neurobehavioral function after MCAO was determined by using 2 neurologic testing scales. Neurologic assessments indicated that impairment after ischemia was limited to motor function in the contralateral arm; other neurologic and behavioral parameters were largely unaffected. We also used microarrays to examine gene expression profiles in peripheral blood mononuclear cells after MCAO-induced ischemia. Several genes were altered in a time-dependent manner after MCAO, suggesting that this ischemia model may be suitable for identifying blood biomarkers associated with the presence and severity of ischemia. This NHP stroke model likely will facilitate the elucidation of mechanisms associated with acute neuronal injury after ischemia. In addition, the ability to identify candidate blood biomarkers in NHP after ischemia may prompt the development of new strategies for the diagnosis and treatment of ischemic stroke in humans.
Abbreviations: MCAO, middle cerebral artery occlusion; NHP, nonhuman primate; PBMC, peripheral blood mononuclear cells
Stroke is a debilitating neurologic condition, and little progress has been made in the development of neuroprotective treatments for acute stroke. The Stroke Therapy Academic Industry Roundtable (STAIR) report suggested that preclinical candidates for stroke therapy should be validated by testing in large animals with similarities to humans, such as nonhuman primates (NHP).26 NHP stroke models have been developed in several species, including rhesus monkeys, marmosets, and baboons, by using a variety of techniques for middle cerebral artery occlusion (MCAO).4,10,12,13,14,25,32 The rhesus macaque is ideal for stroke studies because of its structural similarities to human brain. The rhesus brain is gyrencephalic, which makes it preferable to those of lissencephalic primates (for example, marmosets) and is functionally similar to human brain.6 In addition, the immunologic profile of rhesus macaques is similar to that of humans; therefore these animals are the preferred model for the study of immune responses to infectious diseases such as HIV/SIV, Dengue virus, and others.17,23,30
In addition to their use for neuroprotection assessment, NHP stroke models can facilitate efforts to develop diagnostic tools for identifying and treating stroke symptoms. The use of genomics in peripheral blood cells has been shown to be an excellent method to identify candidate biomarkers and cellular mechanisms associated with stroke.28,29 Blood biomarkers can be used to rapidly determine the occurrence, timing, subtype, and severity of stroke.11,15 One possible reason for the lack of viable stroke biomarkers may be the research models used to search for these markers. Although rodent stroke models have yielded a wealth of information on the mechanisms associated with brain ischemia, the findings have not translated well to human clinical trials.26 Recent studies in human patients showed promising results when genomic tools have been used to screen for novel stroke biomarkers.3,16,27 However, validation of human studies is limited by the need for large data sets in light of heterogeneity in stroke onset, subtype, comorbidities, and other factors. In addition, it is also impossible to know the exact time of stroke onset in most patients.
Here we characterized acute neuronal injury in a novel, minimally invasive permanent ischemic stroke model involving rhesus macaques. Using endovascular catheterization techniques, we introduced silk sutures into the M1 segment of the middle cerebral artery and permanently occluded it. This procedure reliably produced infarcts that could be measured by MRI of the macaque brains during the acute phase period. The procedure resulted in discrete and limited neurobehavioral deficits, indicating the potential of this stroke model for chronic neuroprotection studies in the future. In addition, we used microarrays to identify blood genomic profiles that were altered in a time-dependent manner after ischemia. These studies characterize a preclinical model that is suitable for elucidating the mechanisms associated with cerebral ischemia and that may aid in identifying strategies for the diagnosis and treatment of stroke in humans.
Materials and Methods
MCAO.
All animal studies were approved by the University of Puerto Rico Medical Sciences Campus IACUC. Juvenile healthy SPF rhesus monkeys (Macaca mulata; n = 4; weight, 4.5 to 6.5 kg) were acquired from the Caribbean Primate Research Center (University of Puerto Rico Medical Sciences Campus, San Juan, Puerto Rico). All animals were healthy, with no history of neurologic disease, were quarantined for 30 d, and maintained in AAALAC-accredited facilities. When compatible pairs were identified, macaques were pair-housed under controlled environmental conditions (12:12-h light:dark cycle; temperature, 22 to 26 °C) and fed a commercial diet (NIB Modified Primate Diet, Harlan Tecklad, Madison, WI) twice daily, with fruits and other daily treats. Water was provided ad libitum, and all macaques participated in the facility's enrichment program to promote their psychologic wellbeing. For experimental procedures, macaques were screened for metabolic diseases by CBC and serum chemistry analysis; coagulation evaluation tests (prothrombin time, partial thromboplastin time) were performed also. Macaques were fasted for 12 h before surgery. Macaques were placed on a heating pad (Bair Hugger; Arizant, Eden Prairie, MN), and anesthesia was induced by ketamine (10 to 20 mg/kg IM); atropine (0.04 mg/kg IM) was administered as one of the anesthesia premedications. Anesthesia was maintained by using constant-rate propofol infusion (0.3 to 0.4 mg/kg/min) into the saphenous vein. A cuffed endotracheal tube (inner diameter, 3.0 to 3.5 mm) was placed in each macaque. The macaques were connected to monitoring equipment (BM5 VET, Bionet America, Tustin, CA) that measured the electrocardiogram, pulse oximetry, capnogram, heart rate, and rectal temperature. Physiologic variables were monitored constantly and remained within the normal range. According to the experimental design, each animal served as its own control. After each animal was anesthetized, we performed angiography and drew blood before creating the MCAO (baseline data). All changes in blood genomics and proteomics were compared with the information gathered from each macaque under control (baseline) conditions.
After aseptic preparation of each macaque's inguinal area by using povidone–iodine and alcohol, the area was infiltrated with 2% lidocaine to prevent vasospasm of the femoral artery and for local anesthesia. The Seldinger technique was used, which consists of an incision in the groin near the pulsation wave of the femoral artery as previously described using macaques.6 By using a 21-gauge angiography puncture needle (Micropuncture Introducer Set, Cook Medical, Bloomington, IN), a guide wire was introduced and a 4-French femoral sheath was placed during irrigation from a normal saline pressure bag. A 4-French diagnostic catheter (Terumo, Somerset, NJ) was introduced over a 0.035-French guide wire (Terumo) and navigated through the abdominal thoracic aorta until the aortic arch, the brachiocephalic trunk, common carotid artery, and internal carotid artery were catheterized. Catheter placement was confirmed by injection of contrast material (Conray, Covidien, Hazelwood, MO) under digital angiographic control by using a C-arm fluoroscopy system. A Rapid Transit Microcatheter (Cordis, Bridgewater, NJ) with a Traxcess 0.014-French guiding wire (Terumo) was introduced and navigated into the M1 segment of the right MCA. Occlusion of the M1 segment of the MCA was accomplished by injecting 6 to 8 (length, 2 mm) 3-0 silk sutures (Ethicon, San Lorenzo, Puerto Rico) in saline into the MCA through the catheter by using a 3-mL syringe. The number of sutures required to block the MCA with suture was determined by angiography that confirmed interruption of blood flow through the vessel. An upper limit for the number of sutures was noted when 1 of the 4 macaques developed severe stroke-like symptoms and died within hours of MCAO; MRI and postmortem histologic analysis revealed a large infarct in ipsilateral cortical and subcortical brain regions (data not shown).
The incisions were closed with nonabsorbent 4-0 sterile suture, and the macaques were transported to the MRI facility for imaging. After the MRI, the animals were returned to the recovery room and closely monitored by veterinary staff. The endotracheal tubes were removed when the swallowing reflex was restored. Once recovered enough to be able to sit, the macaques were returned to their cages. All animals were euthanized at 24 h after MCAO.
MRI.
MRI was performed at 1 to 3 h after MCAO in macaques that were still anesthetized from surgery and at 24 h after MCAO. The animals imaged at the 24-h time point were anesthetized prior to scanning as previously described. Images were acquired by using a 1.5-T scanner (Achieva, Philips Medical Systems, Best, Netherlands) and an 8-channel head coil (Sense, Phillips Medical Systems). Coronal slices were obtained perpendicular to a line joining the inferior surface of the genu and the splenium of the corpus callosum, which facilitated the reacquisition of similar slices on the second imaging session. T2-weighted images were acquired by using a turbo spin echo sequence with 0.76 × 0.76 × 3 mm voxel resolution (echo time, 110 ms; rotation time, 2316 to 2322 ms; turbo factor, 10; number of signal averages, 2; field of view, 17 cm; matrix, 224 × 222; 30 slices; no gap). Diffusion-weighted images were acquired with a single-shot spin echo echo-planar imaging sequence with 1.72 × 1.72 × 2 mm resolution (b values, 0 and 1000 s/mm2; echo time, 58 ms; rotation time, 9977 to 10,047 ms; sensitivity encoding, 2; number of signal averages, 6; field of view, 11 cm; matrix, 64 × 64; 41 slices; no gap). The diffusion-weighted images were registered to account for motion before generation of apparent diffusion coefficient maps by using the scanner's diffusion analysis software. Evolution of the ischemic injury was followed by calculating lesion volumes from both the apparent diffusion coefficient map and the T2-weighted images, as previously described.21 Infarct volumes were approximated by using regions of interest that were hand-drawn on a slice-by-slice basis by a radiologist using the OsiriX software package.22 The regions of interest were drawn along the outer margin of the lesions. The total lesion volume was approximated by multiplying the total area of the regions of interest over all slices by the corresponding slice thickness.
Neurologic assessment.
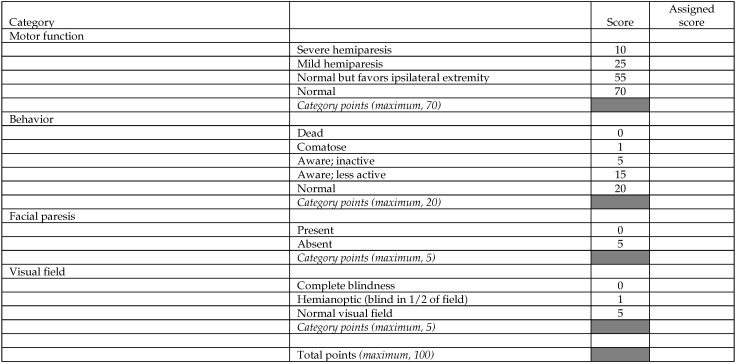
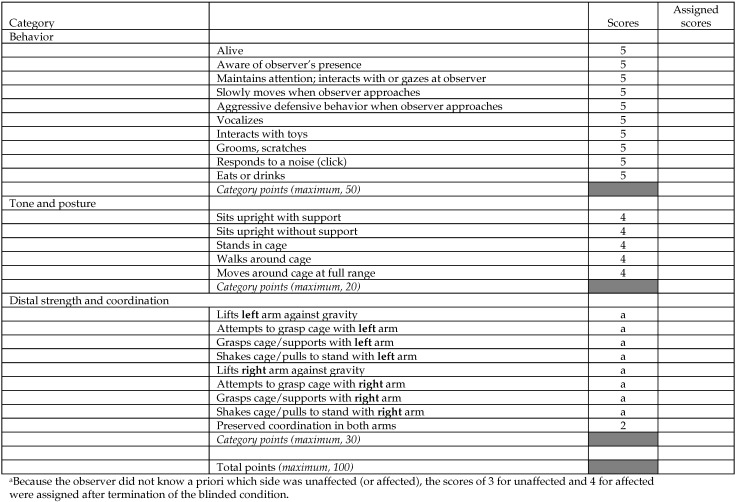
The literature describes various scales used to measure the neurobehavioral function of monkeys after MCAO.6,20,25 In the present work neurobehavioral function was recorded simultaneously on 2 different modified neurologic scales: the Standard Neurologic Scale (Figure 1) and the Task-oriented Neurologic Scale (Figure 2). Each subject was observed twice: 1 or 2 d before MCAO, to establish the baseline behavior, and 20 to 23 h after MCAO, to test for the effect of the occlusion. In each session, behavior was recorded for 30 min by a single observer who was blinded to the side of the brain on which MCAO was performed. In addition to manual scoring, the animals were video recorded during each session. Because the scores obtained with the Standard Neurologic Scale are measured on an ordinal scale, they were analyzed with the nonparametric Wilcoxon signed-rank test. In contrast, the scores obtained with the Task-oriented Scale are measured on a numeric scale; therefore, these data were analyzed with the paired t test.
Figure 1.
Standard Neurologic Scale. Adapted from references 6, 20, and 25.
Figure 2.
Task-oriented Neurologic Scale. Adapted from reference 20.
Histologic assessment.
After the last MRI, animals were perfused with PBS under deep anesthesia at 24 h after MCAO. To measure infarction, brains were removed promptly, cut continuously into 2-cm coronal slices, stained with 2,3,5-triphenyltetrazolium chloride, and then placed directly in 10% formalin. Coronal, 20-µm, fixed, frozen sections were used for histochemistry. Fluoro jadeB staining was done according to the manufacturer's protocols (Chemicon/Millipore, Billerica, MA). Sections were mounted with DPX medium (Electron Microscopy Sciences, Fort Washington, PA).
Blood collection and processing.
Venous blood samples (10 mL) were collected from each macaque at baseline and at 1, 2, and 24 h after MCAO. Whole blood was collected in vacuum phlebotomy cell-preparation tubes (Becton Dickinson, Franklin Lakes, NJ) with sodium citrate and processed according to the manufacturer's instructions within 2 h of collection. The tubes were centrifuged at 1500 × g for 30 min at 20 °C. Approximately half of the plasma was collected without disturbing the cell layer and placed into microcentrifuge tubes for storage. Peripheral blood mononuclear cells (PBMC) were washed twice with PBS, and platelets were removed by centrifugation at 200 × g for 15 min at 20 °C. PBMC were resuspended and homogenized in 1 mL TRIzol reagent (Invitrogen, Rockville, MD). The plasma, serum, and PBMC were stored at −80 °C for protein and RNA analysis.
Total RNA isolation, protein isolation and Western blot.
RNA was isolated from PBMC homogenates in TRIzol according to the manufacturer's protocol. Samples were thawed, and 200 μL of chloroform was added. Tubes containing samples were vigorously shaken by hand for 15 s and centrifuged for 15 min at 10,000 × g in a refrigerated centrifuge. The aqueous phase (RNA) was transferred to a new tube, and 500 μL of isopropanol was added. The phenol–chloroform phase was transferred to a separate tube for protein isolation. After a 10-min incubation at room temperature, the tube was centrifuged for 10 min at 10,000 × g, and the supernatant was discarded. Next, 500 μL of 75% ethanol was added and the tube centrifuged for 5 min at 7500 × g. The supernatant was removed, and the pellet was dried for 5 min. The pellet was resuspended in 100 μL RNase-free water. A second RNA purification was performed by using an RNAqueous kit (Ambion, Austin, TX). Quantitative and qualitative analyses were performed by using an Agilent bioanalyzer (Agilent Technologies, Santa Clara, CA) and a spectrophotometer.
RNA microarray analysis.
Baseline and 1-, 2-, and 24-h mRNA samples from rhesus monkeys AO35 and AM14 were evaluated by using microarray analysis. Total RNA was purified (RNAqueous Kit, Ambion) and converted to double-stranded cDNA (Invitrogen, Superscript Choice System, Carlsbad, CA) by using a T7-(dT)24 primer. Double-stranded cDNA was purified by using Phase Lock Gels (Eppendorf, Westbury, NY) with phenol–chloroform–isoamyl alcohol (Sigma, St Louis, MO). cRNA was synthesized by using a RNA transcript labeling kit (Enzo Diagnostics, Farmingdale, NY). Biotin-labeled cRNA was purified by using a GeneChip Sample Cleanup Module (Affymetrix, Santa Clara, CA) and then quantified by using a spectrophotometer. A 20-µg aliquot of the in vitro transcription product was fragmented in Affymetrix Fragmentation Buffer, by placing at 94 °C for 35 min. After fragmentation, 15 μg of the biotinylated cRNA was hybridized to a microarray (GeneChip Human HG-U133_2.0 Genome Array, Affymetrix). The chips were hybridized at 45 °C for 16 h, and then washed, stained with streptavidin–phycoerythrin, and scanned (GeneChip 3000 7G Scanner, Affymetrix) according to manufacturing guidelines.
Data analysis was performed by using Affymetrix Expression Console software that supports probe set summarization and CHP file generation of 3′ expression by using the MAS5 Statistical algorithm (www.affymetrix.com). Affymetrix microarrays contain hybridization, labeling, and housekeeping controls that help determine the success of the hybridizations. The Affymetrix Expression Analysis algorithm uses the Tukey biweight estimator to provide a robust mean signal value and the Wilcoxon rank test to calculate a significance or P value and detection call for each probe set. The Detection P value is calculated by using a Descrimination Score (R) for all probes. The Discrimination Score is a basic property of a probe pair that describes its ability to detect its intended target. It measures the target-specific intensity differences of the probe pair (perfect match – mismatch) relative to its overall hybridization intensity (perfect match + mismatch). Background estimation is provided by a weighted average of the lowest 2% of the feature intensities. Mismatch probes are used to adjust the perfect-match intensity. Linear scaling of the feature level intensity values, by using the trimmed mean, is the default to make the means equal for all arrays being analyzed. False-negative and false-positive rates are minimized by subtracting nonspecific signal from the perfect-match probe intensities and by performing an intensity-dependent normalization at the probe set level. Resulting CHP data were normalized and further analyzed by using Genespring GX10 (Agilent Technologies, Santa Clara, CA) and Genesis (Institute for Biomedical Engineering, Graz University of Technology, Austria) software. Changes in gene expression were compared between baseline (before MCAO) and each time point after MCAO. Gene expression values between time points that increased or decreased by 2-fold or more were considered to be statistically significant (P < 0.005) by using 2-way ANOVA.
Cytokine ELISA.
Cytokines in serum were analyzed by multiplex bead immunoassay (Luminex 100, Luminex, Austin, TX) according to the manufacturer's instructions and by using kits from Biosource (catalog nos. LHC 0001, LHC 0151, LHC 9121, and LHC 0171; Invitrogen). Baseline and 1-, 2- and 24-h serum samples from all 3 rhesus monkeys were evaluated for circulating levels of the cytokines CCL2/MCP1, CXCL1/GRO, CCL11/eotaxin, and CD40LG by using a commercially available multiplex colorimetric bead-based cytokine immunoassay coupled with the Luminex system and human-specific bead sets (BioRad, San Diego, CA), according to the manufacturer's instructions. The results were interpolated from 5-parameter-fit standard curves generated by using the relevant recombinant human proteins (BioRad). The average baseline cytokine protein concentration for each monkey (n = 3 per time point) was compared with that at each time point by using a t test using GraphPad Prism 5 software (GraphPad Prism Software, LaJolla, CA).
Results
MCAO in NHP.
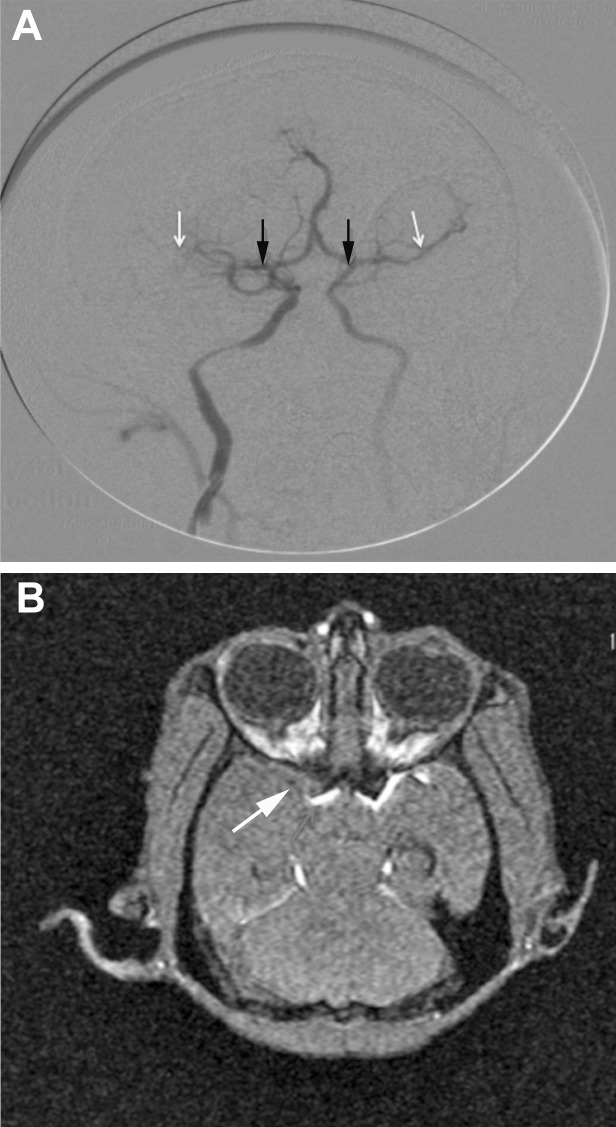
An endovascular procedure used silk sutures to permanently occlude the MCA of 3 rhesus macaques. Figure 3 A shows occlusion of the MCA in one of the monkeys as measured by C-arm contrast angiography. Figure 3 B shows MR angiography and confirmed that the MCA was occluded at 24 h after surgery. Physiologic parameters of the macaques before and after ischemia are shown in Table 1. Physiologic values for body temperature, heart rate, blood pressure, and pulse oximetry were measured throughout the surgical and imaging procedures, and values were consistent and within the normal range. Neither of these physiologic parameters was altered significantly after ischemia.
Figure 3.
After MCAO, contrast material was injected into the vasculature via the femoral catheter, and the cerebral arteries were visualized by using a C-arm fluoroscopy system. (A) The MCA (white arrows) is blocked on the ipsilateral side (black arrows indicate the origin of the MCA). (B) MCAO. The arrow and regions of white hyperintensity indicate blood flow in the MCA.
Table 1.
Physiologic parameters in the rhesus macaques AM14, AM71, and AO35
| AM14 | AM71 | AO35 | P | |
| Heart rate (bpm) | 156.00 ± 12.12 | 150.33 ± 4.95 | 112.33 ± 7.63 | 0.97 |
| Temperature | 97.67 ± 0.15 | 97.77 ± 0.25 | 96.63 ± 2.74 | 0.34 |
| Pulse oximetry (% O2) | 95.33 ± 0.58 | 96.33 ± 1.53 | 92.33 ± 1.53 | 0.84 |
| Systolic blood pressure (mm Hg) | 105.00 ± 7.94 | 99.67 ± 8.5 | 98.33 ± 5.51 | 0.80 |
| Diastolic blood pressure (mm Hg) | 44.00 ± 9.17 | 45.33 ± 3.79 | 46.00 ± 8.19 | 0.97 |
Heart rate, temperature, and pulse oximetry measurements were taken 15 min before, during, and 15 min after MCAO. Blood pressure was measured 45 min before, during, and 15-min after MCAO. These 3 values were averaged, and standard deviations were calculated; P values were determined by single-factor ANOVA.
Neurologic assessment.
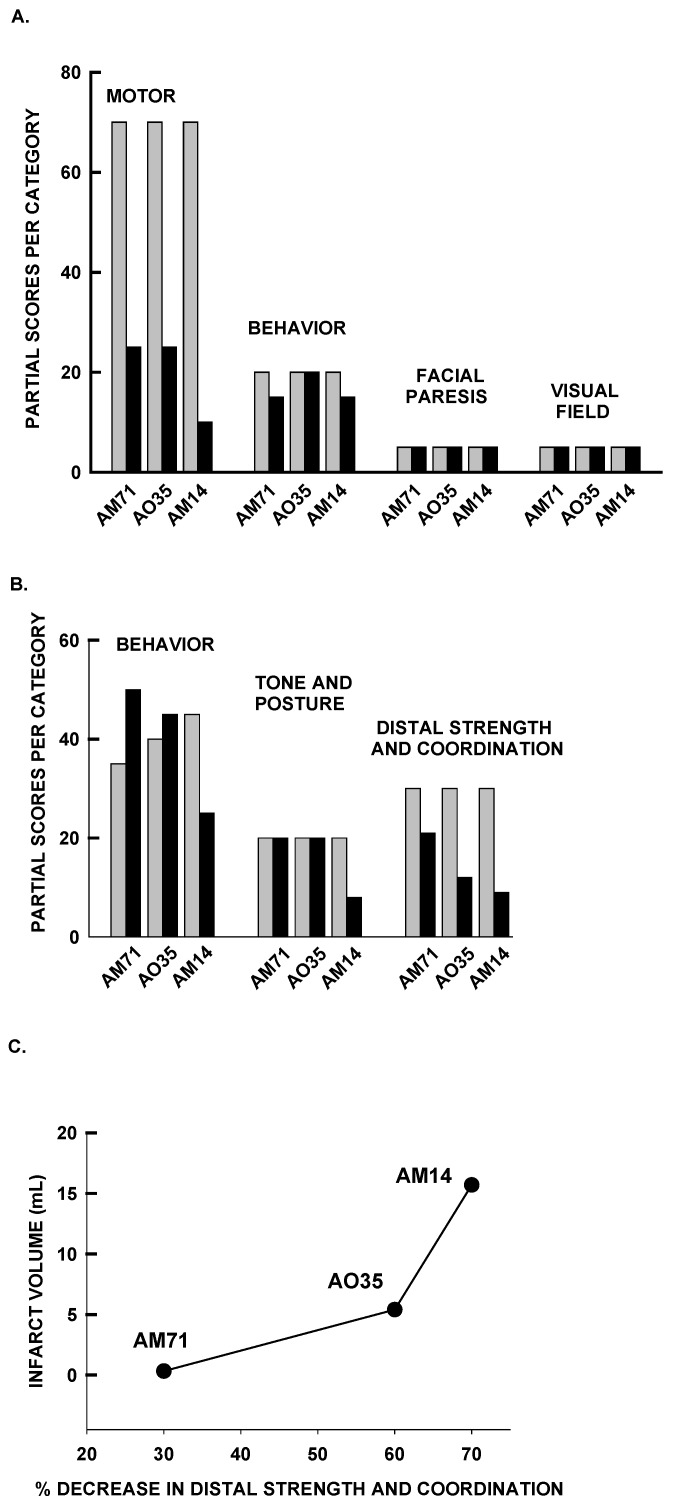
Figure 4 A presents the data obtained by using the Standard Neurologic Scale. The Motor category reflected mild hemiparesis after MCAO for the first 2 subjects and severe hemiparesis for the third. In every case, the affected limb was the left arm, with lesser impairment in the left leg.20 Comparison of scores obtained before and after MCAO indicated significant (P = 0.05, Wilcoxon signed rank test, one-tailed) impairment in the Motor category but not in the Behavior, Facial Paresis, or Visual Field categories.
Figure 4.
(A) Behavioral scores obtained by using the Standard Neurologic Scale. The bars represent the partial scores for each category obtained before and after MCAO. (B) Behavioral scores measured by using the Task-oriented Neurologic Scale. The bars represent the scores obtained before and after MCAO. (C) Diffusion-weighted imaging at 24 h after MCAO revealed correlation between infarct volume and neurologic function and the percentage decrease in the Distal Strength and Coordination measures at the same time point.
The Task-oriented Neurologic Scale reflected robust impairment in left arm motor function, with little or no impairment of the general neurobehavioral status of the animal (Figure 4 B). A selective and significant (P < 0.05, paired t test, 2-tailed) impairment in the category Distal Strength and Coordination was observed after MCAO, whereas no differences were seen in the categories measuring awareness and self-care (Behavior) or Tone and Posture (only the animal with the largest infarct [AM14] presented a deficit in this category). We observed an association between the infarct size measured by diffusion-weighted imaging and the Distal Strength and Coordination measure (Figure 4 C).
MRI studies.
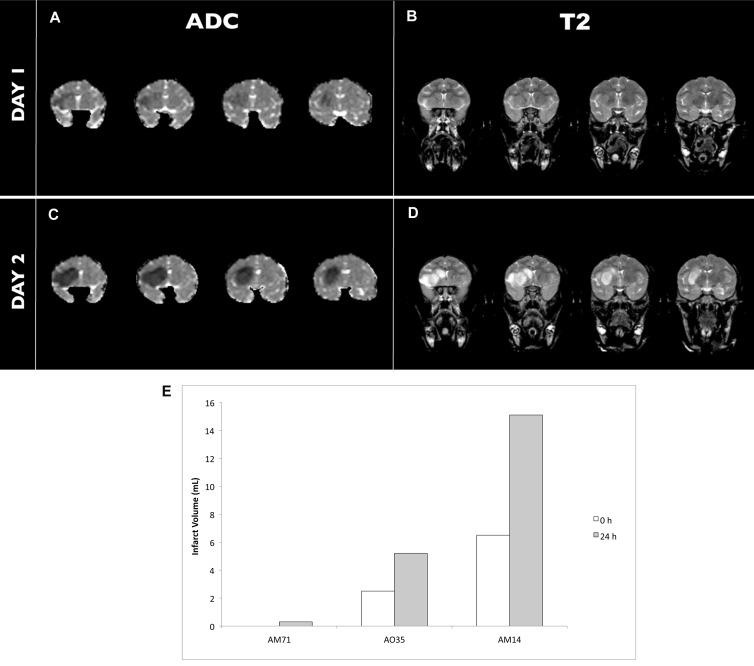
The evolution of cerebral infarction was examined by using MRI with diffusion- and T2-weighted imaging. Figures 5 A through D show representative images from macaque AO35. At 1 to 2 h after MCAO, restricted diffusion in the infarcted tissues was present in 2 of the 3 monkeys. The infarcts, as defined by diffusion-weighted imaging, were expanded at 24 h after MCAO in all 3 animals (Figures 5 A and C). The imaging showed minimal or no significant abnormalities in the T2-weighted images of any of the monkeys at the 1- and 2-h time points (Figure 5 B), consistent with other NHP stroke models6,8,12,19,32 and in human patients at early time points.31 However, the T2 signal at 24 h after MCAO corresponded with the diffusion-weighted image (Figure 5 D). Although the size of the infarcts varied between macaques, calculated infarct volumes increased compared with measurements obtained the previous day (Figure 5 E).
Figure 5.
(A, C) Diffusion-weighted and (B, D) T2-weighted images were collected immediately after (day 1) and 24 h after (day 2) MCAO in macaque AO35. (E) Infarct size measured by diffusion-weighted imaging (expressed as apparent diffusion coefficient [ADC]) increased in all macaques (AM71, AO35, AM14) at 24 h after MCAO.
Histologic assessment.
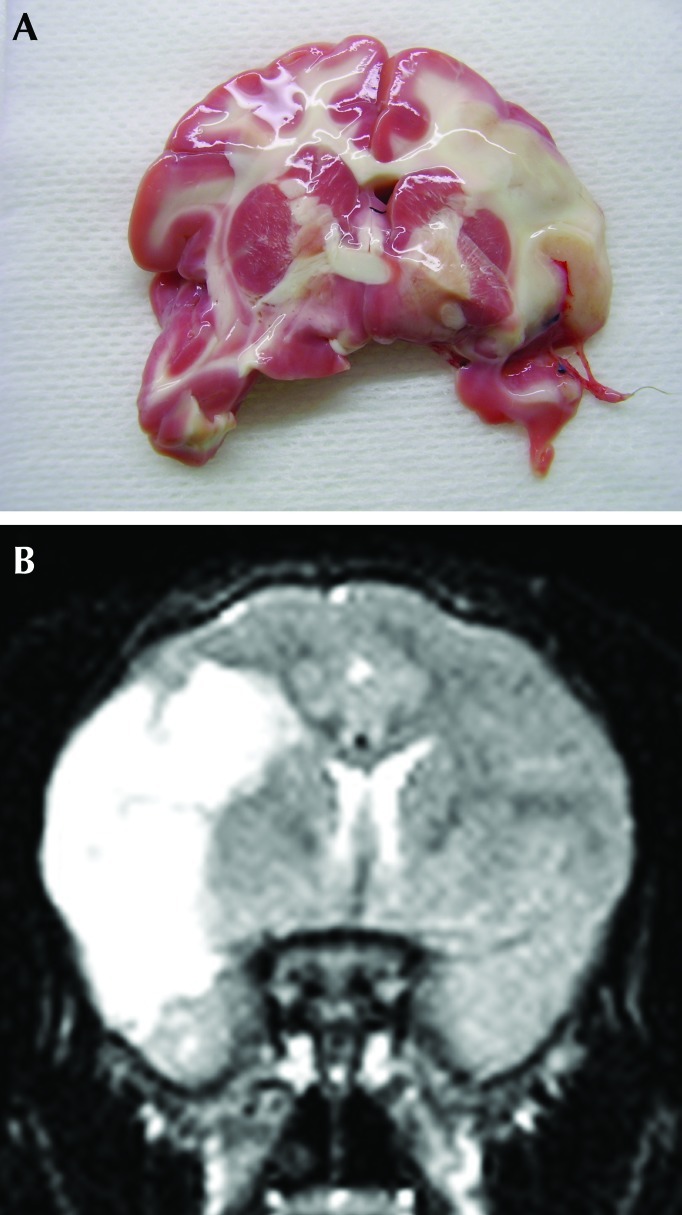
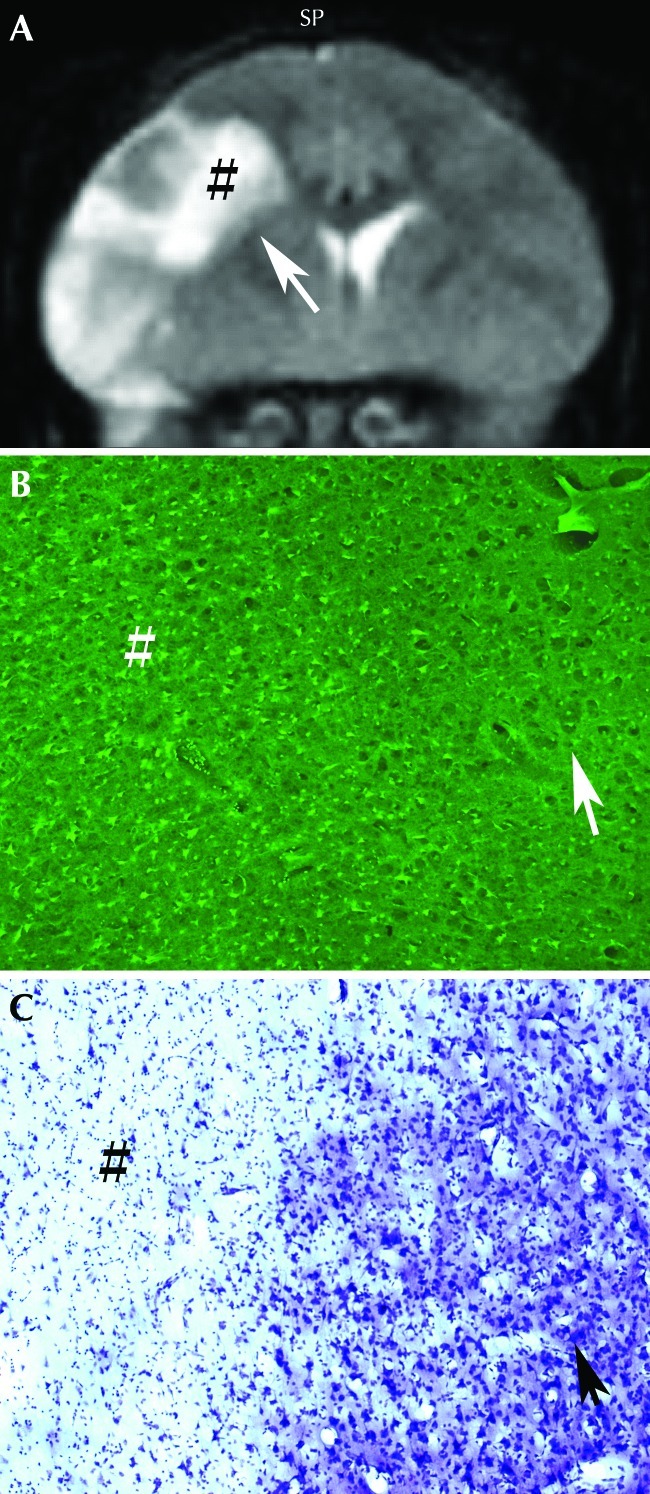
The infarction seen by using MRI correlated with that apparent through histologic measures. Figure 6 A shows a brain section with a large ischemic lesion that was revealed by staining with 2,3,5-triphenyltetrazolium chloride. The size and location of the lesion are comparable to those on the corresponding T2-weighted MRI (Figure 6 B). Fluoro jadeB and cresyl violet labeling of fixed, frozen brain sections from monkeys 24 h after MCAO demonstrated the presence of numerous injured neurons in the infarcted regions of the brain but not in the adjacent noninfarcted areas (Figure 7).
Figure 6.
Pattern of staining by 2,3,5-triphenyltetrazolium chloride matched regions of infarction on MRI at 24 h after MCAO in macaque AM14. (A) Brain section stained with 2,3,5-triphenyltetrazolium chloride. (B) Corresponding T2-weighted MRI.
Figure 7.
(A) T2-weighted MRI revealed infarction after MCAO in macaque AM14. (B) Numerous fluoro jadeB-positive cells (bright green) are seen in the infarct (#; inset in A) but not in noninfarcted areas (arrow). (C) Large neurons stained with cresyl violet are present in the noninfarcted regions.
RNA microarray analysis of PBMC after MCAO.
These experiments used a genome array that contained approximately 47,000 transcript probe sets. The expression of numerous genes was increased or decreased by 2-fold or more at each time point after ischemia compared with that of control (baseline) samples. Hierarchical cluster analysis of the dataset revealed that many genes had distinct expression patterns at different time points during acute ischemic injury. Many cytokine and chemokine genes were below the limit of detection at baseline but induced in a time-dependent manner after ischemia (Table 2). Conversely, some inflammatory genes were expressed at baseline but suppressed after ischemia. Several cytokines, chemokines, and other inflammatory genes were altered in expression after MCAO. Table 2 shows the fold change of gene expression inflammatory molecules in PBMC at specific time points relative to that of baseline samples. Proinflammatory cytokines, including MCP1/CCL2, CXCL1/GRO, IL2, IL6, IL21, and CXCL17, were increased 1 h after ischemia but were decreased 2 to 24 h after MCAO. The antiinflammatory cytokines IL10, IL4, and IL25 were decreased after MCAO.
Table 2.
Molecules showing greatest upregulation or downregulation in PBMCs after MCAO compared with baseline levels (before MCAO)
| Probe set ID | Gene symbol | Gene name | Fold change at 1 h | Fold change at 2 h | Fold change at 24 h |
| 207533_at | CCL1 | Chemokine (C-C motif) ligand 1 | 2.11 | 1.38 | 1.71 |
| 210133_at | CCL11 | Chemokine (C-C motif) ligand 11 | −1.49 | −1.80 | −4.04 |
| 216714_at | CCL13 | Chemokine (C-C motif) ligand 13 | 2.90 | 1.53 | 6.15 |
| 206407_s_at | CCL13 | Chemokine (C-C motif) ligand 13 | −4.86 | −4.68 | −6.50 |
| 210390_s_at | CCL14 | Chemokine (C-C motif) ligand 14 | −1.08 | 3.44 | −1.02 |
| 205392_s_at | CCL15 | Chemokine (C-C motif) ligand 15 | 2.10 | 4.74 | 2.39 |
| 207354_at | CCL16 | Chemokine (C-C motif) ligand 16 | 1.80 | −1.40 | 2.37 |
| 207900_at | CCL17 | Chemokine (C-C motif) ligand 17 | 1.17 | 3.77 | 3.16 |
| 209924_at | CCL18 | Chemokine (C-C motif) ligand 18 | 4.57 | 1.50 | 3.06 |
| 210072_at | CCL19 | Chemokine (C-C motif) ligand 19 | −4.33 | 2.64 | 1.41 |
| 216598_s_at | CCL2 | Chemokine (C-C motif) ligand 2 | 5.02 | −1.74 | −1.14 |
| 205476_at | CCL20 | Chemokine (C-C motif) ligand 20 | 1.14 | 1.44 | −1.01 |
| 204606_at | CCL21 | Chemokine (C-C motif) ligand 21 | 2.37 | 4.26 | 1.50 |
| 207861_at | CCL22 | Chemokine (C-C motif) ligand 22 | −3.53 | −10.27 | −4.75 |
| 210549_s_at | CCL23 | Chemokine (C-C motif) ligand 23 | −2.16 | −1.21 | −1.15 |
| 221463_at | CCL24 | Chemokine (C-C motif) ligand 24 | −4.75 | −2.73 | −1.69 |
| 206988_at | CCL25 | Chemokine (C-C motif) ligand 25 | 1.23 | −1.33 | 2.57 |
| 223710_at | CCL26 | Chemokine (C-C motif) ligand 26 | −2.45 | −1.72 | 2.19 |
| 207955_at | CCL27 | Chemokine (C-C motif) ligand 27 | 2.56 | 6.81 | 2.47 |
| 224027_at | CCL28 | Chemokine (C-C motif) ligand 28 | 8.40 | 8.16 | 7.60 |
| 205114_s_at | CCL3 | Chemokine (C-C motif) ligand 3 | 8.90 | 1.19 | 10.96 |
| 204103_at | CCL4 | Chemokine (C-C motif) ligand 4 | 2.51 | −1.08 | 3.05 |
| 204655_at | CCL5 | Chemokine (C-C motif) ligand 5 | −1.99 | −1.61 | −1.18 |
| 208075_s_at | CCL7 | Chemokine (C-C motif) ligand 7 | 5.40 | 5.82 | 3.62 |
| 214038_at | CCL8 | Chemokine (C-C motif) ligand 8 | 1.97 | 2.50 | 2.10 |
| 204470_at | CXCL1 | Chemokine (C-X-C motif) ligand 1 | 5.07 | 2.36 | 3.40 |
| 204533_at | CXCL10 | Chemokine (C-X-C motif) ligand 10 | −1.03 | −1.05 | −1.55 |
| 210163_at | CXCL11 | Chemokine (C-X-C motif) ligand 11 | 6.46 | 9.57 | 3.32 |
| 211122_s_at | CXCL11 | Chemokine (C-X-C motif) ligand 11 | 3.07 | −1.60 | 1.54 |
| 209687_at | CXCL12 | Chemokine (C-X-C motif) ligand 12 | −1.12 | 4.97 | −1.31 |
| 205242_at | CXCL13 | Chemokine (C-X-C motif) ligand 13 | 1.18 | −2.48 | −1.82 |
| 218002_s_at | CXCL14 | Chemokine (C-X-C motif) ligand 14 | −4.89 | −3.21 | −5.83 |
| 223454_at | CXCL16 | Chemokine (C-X-C motif) ligand 16 | −6.43 | −3.18 | −5.13 |
| 226960_at | CXCL17 | Chemokine (C-X-C motif) ligand 17 | 7.55 | −1.68 | −1.03 |
| 209774_x_at | CXCL2 | Chemokine (C-X-C motif) ligand 2 | 3.32 | 1.55 | 4.88 |
| 1569203_at | CXCL2 | Chemokine (C-X-C motif) ligand 2 | −8.74 | 1.32 | −2.22 |
| 207850_at | CXCL3 | Chemokine (C-X-C motif) ligand 3 | 1.96 | −1.22 | −1.30 |
| 215101_s_at | CXCL5 | Chemokine (C-X-C motif) ligand 5 | −2.54 | 3.28 | 2.67 |
| 206336_at | CXCL6 | Chemokine (C-X-C motif) ligand 6 | −3.42 | −1.91 | −3.28 |
| 203915_at | CXCL9 | Chemokine (C-X-C motif) ligand 9 | −6.34 | 1.16 | −2.02 |
| 207257_at | EPO | Erythropoietin | −19.93 | −22.40 | −3.69 |
| 210354_at | IFNG | Interferon γ | −1.93 | −3.83 | −1.43 |
| 207433_at | IL10 | Interleukin 10 | −2.24 | −2.67 | −1.71 |
| 206924_at | IL11 | Interleukin 11 | −1.32 | −2.11 | −1.79 |
| 207160_at | IL12A | Interleukin 12α | 1.71 | −6.50 | −2.75 |
| 207901_at | IL12B | Interleukin 12β | −1.89 | −2.47 | −2.32 |
| 207844_at | IL13 | Interleukin 13 | 3.00 | 1.52 | 1.70 |
| 205992_s_at | IL15 | Interleukin 15 | 1.05 | −1.40 | −1.17 |
| 217371_s_at | IL15 | Interleukin 15 | −4.55 | −2.55 | −2.79 |
| 209828_s_at | IL16 | Interleukin 16 | 1.06 | −2.39 | −1.24 |
| 216876_s_at | IL17A | Interleukin 17α | −1.46 | 4.26 | −1.75 |
| 220273_at | IL17B | Interleukin 17β | −6.49 | 1.46 | −1.82 |
| 224079_at | IL17C | Interleukin 17γ | −1.82 | −1.28 | −1.24 |
| 227401_at | IL17D | Interleukin 17δ | 1.08 | −1.69 | −1.00 |
| 234408_at | IL17F | Interleukin 17ζ | −1.54 | 3.62 | 1.12 |
| 206295_at | IL18 | Interleukin 18 | 4.15 | 5.21 | 6.76 |
| 220745_at | IL19 | Interleukin 19 | 6.68 | 1.36 | 3.50 |
| 210118_s_at | IL1A | Interleukin 1α | −1.98 | −2.10 | −2.75 |
| 205067_at | IL1B | Interleukin 1β | 2.43 | −1.01 | 2.24 |
| 207849_at | IL2 | Interleukin 2 | 5.81 | −1.68 | 3.42 |
| 224071_at | IL20 | Interleukin 20 | −1.80 | 1.32 | 1.13 |
| 221271_at | IL21 | Interleukin 21 | 5.64 | −1.46 | 1.35 |
| 222974_at | IL22 | Interleukin 22 | 2.08 | 2.79 | 1.80 |
| 206569_at | IL24 | Interleukin 24 | −2.44 | −3.52 | −1.78 |
| 220971_at | IL25 | Interleukin 25 | −1.30 | −6.94 | −3.87 |
| 221111_at | IL26 | Interleukin 26 | 2.36 | −2.31 | −1.18 |
| 1552995_at | IL27 | Interleukin 27 | 3.28 | 16.93 | 5.69 |
| 1552609_s_at | IL28A | Interleukin 28α | −2.53 | −7.83 | −6.97 |
| 1552917_at | IL29 | Interleukin 29 | −1.47 | 2.60 | 1.42 |
| 207906_at | IL3 | Interleukin 3 | −2.62 | −2.20 | 5.54 |
| 203828_s_at | IL32 | Interleukin 32 | 2.95 | 2.60 | 1.93 |
| 209821_at | IL33 | Interleukin 33 | −4.15 | −1.02 | −2.27 |
| 237046_x_at | IL34 | Interleukin 34 | 1.26 | 1.18 | −2.95 |
| 207538_at | IL4 | Interleukin 4 | −5.05 | −4.84 | −2.11 |
| 207952_at | IL5 | Interleukin 5 | 1.63 | 3.61 | 1.38 |
| 205207_at | IL6 | Interleukin 6 | 2.02 | −1.24 | −1.07 |
| 206693_at | IL7 | Interleukin 7 | 1.05 | −1.28 | −1.16 |
| 202859_x_at | IL8 | Interleukin 8 | 4.11 | −2.79 | 8.39 |
| 208193_at | IL9 | Interleukin 9 | −1.45 | 1.62 | 2.64 |
| 209648_x_at | SOCS5 | Suppressor of cytokine signaling 5 | −1.09 | 1.26 | 1.32 |
| 201107_s_at | THBS1 | Thrombospondin 1 | 18.04 | 13.65 | 21.37 |
| 207113_s_at | TNF | Tumor necrosis factor | 4.59 | 1.29 | 2.95 |
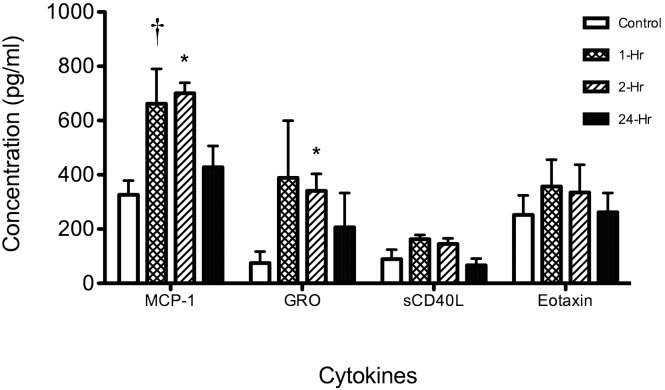
To determine whether increased RNA expression after ischemia resulted in comparable changes in protein levels, we examined the expression patterns of 4 cytokines and chemokines that were altered in distinct patterns after MCAO—CCL2/MCP1, a chemokine proposed as a potential clinical stroke biomarker,2 and CD40LG, CCL11/eotaxin, and CXCL1/GRO (Figure 8). In line with the mRNA results, Luminex analysis of PBMC lysates showed that production of MCP1 and CXCL1/GRO increased at early time points after ischemia and then returned toward baseline levels. Both CD40LG and CCL11/eotaxin mRNA levels were decreased after ischemia, and protein levels did not change significantly after MCAO.
Figure 8.
Cytokine and chemokine levels in blood after MCAO of rhesus macaques. Cytokines in serum were analyzed by multiplex bead immunoassay. Control (baseline) and 1-, 2-, and 24-h postMCAO serum samples from 3 rhesus macaques were evaluated for circulating levels of CCL2/MCP1, CXCL1/GRO, CCL11/eotaxin, and CD40LG. The average control (baseline) cytokine protein concentrations for each animal (n = 3 per time point) were compared (†, P < 0.01; *, P < 0.05) between time points by using a t test.
Discussion
The goal of the current study was to provide a wide-ranging analysis of mechanisms involved in the acute phase of ischemic stroke by using multiple outcome measures in rhesus macaque stroke model. NHP stroke models have been developed by using a variety of techniques for MCAO, including craniotomy, extracranial occlusion via the carotid artery, transorbital surgical procedures, and endovascular catheterization.4-6,8,10,13,14,19,25,32 In these different models, MCAO was induced by diverse procedures including arterial clipping, balloon occlusion, and endovascular introduction of liquid acrylate compounds. Major limitations in the development of NHP stroke models include high mortality and inconsistency of infarct formation due to collateral circulation.13,32 The endovascular techniques we used here allowed for the development of a minimally invasive stroke model that consistently produced infarcts that expanded during the acute phase of ischemia. In this study, we occluded the MCA by using silk sutures. The thrombogenic properties of silk sutures have been well described7 and likely contribute to the stability and persistence of the occlusion. Previous clinical studies demonstrated the utility of silk sutures for the embolization of blood vessels in human patients with arteriovenous malformations.9,24 The endovascular introduction of silk sutures to occlude the MCA has several advantages over other endovascular methods to produce permanent cerebral ischemia. Techniques such as catheterization, balloon occlusion, and insertion of coils require removal of the device prior to examination by MRI to avoid imaging artifacts. Although endovascular introduction of liquid acrylate compounds are useful for embolization, this technique has limitations.18 The polymerization time of these compounds and thus clot development are difficult to manage. Moreover, these compounds are adhesive, and the catheter can become trapped in the blood vessel.
An important characteristic of an NHP model of ischemic stroke is the ability to produce and measure infarcts that expand over time during the acute injury phase. All 3 of our surviving macaques displayed an increase in infarct volume at 24 h after occlusion, suggesting the presence of an ischemic penumbra with salvageable neuronal tissues. Future studies will involve MRI to examine the dynamics of infarct progression by measuring the ischemic penumbra.31 Determination of salvageable tissues by using MRI is more clinically relevant than is final infarct volume measurement, and results from NHP MRI studies can be correlated directly with MRI results in humans. The results from drug efficacy studies in NHP can be used to guide patient selection for clinical trials, so that only patients with salvageable brain tissues are selected for validation studies in humans. The macaques in the current study displayed selective impairment of motor function in the contralateral arm, and the degree of this impairment correlated with the final infarct size. Many procedures used to optimize infarct size in NHP have resulted in substantial neurologic impairment and mortality.13 Neurobehavioral deficits were limited to hemiplegia in this procedure, and this feature is an attractive aspect of this model. The observation that macaques appear otherwise normal except for the limb impairment makes this model ideal for long-term stroke outcome studies.
The NHP stroke model we describe likely also will support the elucidation of mechanisms associated with stroke progression and the development of brain and blood biomarkers of stroke. The search for specific, reliable, and clinically useful stroke biomarkers has been largely unsuccessful. Many molecules that have shown promise have only done so many hours or days after stroke, by which time they would no longer be helpful for acute interventions.1,15 An ideal biomarker should be specific to ischemic stroke, sensitive, predictive (proportionate to extent of injury), robust (accurate and inexpensive), and noninvasive and bridge preclinical results and clinical validation. Advanced technologies including genomic analysis and proteomics have facilitated the discovery of effective cancer biomarkers and could lead to discovery of stroke markers.11 The major benefit of high throughput microarray-based genomic and proteomic analyses is the capacity to identify groups or clusters of genes and proteins with altered expression patterns in tissue or body fluids after stroke. Blood genomic responses to brain insults have previously been described in rodent models.29 The current microarray results confirmed several candidate stroke biomarkers in our NHP stroke model that have been shown to have potential for use in a clinical setting (for example, CCL2/MCP1).2,15 One of the genes highly induced after ischemia in our microarray studies, thrombospondin 1 (Table 2), recently was identified as a gene unique to large-vessel strokes in human patients.16 In addition, an effective stroke biomarker needs to correlate well with findings from neuroimaging and clinical diagnostic examinations. The ability to match specific groups of biomarkers in blood cells and serum to the imaging and neurobehavioral data in the current NHP stroke model could aid in the development of biomarkers that characterize ischemic events in human patients. A limitation of the current study is the inability to correlate the levels of specific molecules to infarct volume because of the small sample size. Nevertheless, these data show a clear relationship between the amount of time after MCAO and the upregulation of genes in peripheral blood cells independent of infarct size.
The current study characterized multiple neurologic consequences of acute brain injury after MCAO in a rhesus macaque stroke model. The combined ability to identify molecular pathways and blood biomarkers with precise timing after ischemia may yield novel candidate neuroprotective compounds and stroke biomarkers that can predict the onset, degree of severity, and progression of stroke.
Acknowledgments
We thank Teresa Arana, MT (Virology Lab, UPR), Milton Melendez (MRI technologist), Fernando Montero (endovascular surgery tech, UPR), Dr Jose Vientos (UPR), and the Surgical Research Laboratory facility staff (Surgery Department, Medical Sciences Campus, UPR), especially Mr Antonio Cotto. We also are grateful to Michael Velez (MSD, Universidad Central del Caribe) for statistical advice on the neurologic assessment data analysis and to Robert Simmons, 3rd (Morehouse School of Medicine) for administrative support. This work was supported in part by NIH grants R01 NS056446 (BF), U54 NS34194 (BF), P40 RR003640 (EK, Caribbean Primate Research Center, UPR), U42 RR016021 (EK), U24 RR01108 (EK), U54 NS43011 (EK, UPR-MSC SNRP), U54-NS39408 (PAF), and K12 GM000680 (JVKP); Fundación Segarra (VAE); Howard Hughes Medical Institute (no. 52006306; GDF); and the WM Keck Foundation (BF). This work was also supported by the CounterACT Program, National Institutes of Health Office of the Director (NIH OD), and the National Institute of Neurological Disorders and Stroke (NINDS), Grants Number U01NS057993 (BF) and U01NS063555 (PAF). The investigation was conducted in facilities supported by NIH grants C06 RR-07571 (MSM), G12-RR03034 (MSM), and G20 RR14335 (ARC-UPR). Drs B Ford, G Ford, Kraiselburd, Rodriguez-Mercado, and Martinez are inventors on a patent application that was filed on the basis of the list of genes identified in the blood studies as candidate stroke biomarkers.
References
- 1.Anand N, Stead LG. 2005. Neuron-specific enolase as a marker for acute ischemic stroke: a systematic review. Cerebrovasc Dis 20:213–219 [DOI] [PubMed] [Google Scholar]
- 2.Arakelyan A, Petrkova J, Hermanova Z, Boyajyan A, Lukl J, Petrek M. 2005. Serum levels of the MCP1 chemokine in patients with ischemic stroke and myocardial infarction. Mediators Inflamm 2005:175–179 [DOI] [PMC free article] [PubMed] [Google Scholar]
- 3.Barr TL, Conley Y, Ding J, Dillman A, Warach S, Singleton A, Matarin M. 2010. Genomic biomarkers and cellular pathways of ischemic stroke by RNA gene expression profiling. Neurology 75:1009–1014 [DOI] [PMC free article] [PubMed] [Google Scholar]
- 4.Branston NM, Symon L, Crockard HA, Pasztor E. 1974. Relationship between the cortical evoked potential and local cortical blood flow following acute middle cerebral artery occlusion in the baboon. Exp Neurol 45:195–208 [DOI] [PubMed] [Google Scholar]
- 5.Brassel F, Dettmers C, Nierhaus A, Hartmann A, Solymosi L. 1989. An intravascular technique to occlude the middle cerebral artery in baboons. Neuroradiology 31:418–424 [DOI] [PubMed] [Google Scholar]
- 6.D'Arceuil HE, Duggan M, He J, Pryor J, de Crespigny A. 2006. Middle cerebral artery occlusion in Macaca fascicularis: acute and chronic stroke evolution. J Med Primatol 35:78–86 [DOI] [PubMed] [Google Scholar]
- 7.Dahlke H, Dociu N, Thurau K. 1980. Thrombogenicity of different suture materials as revealed by scanning electron microscopy. J Biomed Mater Res 14:251–268 [DOI] [PubMed] [Google Scholar]
- 8.de Crespigny AJ, D'Arceuil HE, Maynard KI, He J, McAuliffe D, Norbash A, Sehgal PK, Hamberg L, Hunter G, Budzik RF, Putman CM, Gonzalez RG. 2005. Acute studies of a new primate model of reversible middle cerebral artery occlusion. J Stroke Cerebrovasc Dis 14:80–87 [DOI] [PubMed] [Google Scholar]
- 9.Dehdashti AR, Muster M, Reverdin A, de Tribolet N, Ruefenacht DA. 2001. Preoperative silk suture embolization of cerebral and dural arteriovenous malformations. Neurosurg Focus 11:e6. [DOI] [PubMed] [Google Scholar]
- 10.Del Zoppo GJ, Copeland BR, Harker LA, Waltz TA, Zyroff J, Hanson SR, Battenberg E. 1986. Experimental acute thrombotic stroke in baboons. Stroke 17:1254–1265 [DOI] [PubMed] [Google Scholar]
- 11.Foerch C, Montaner J, Furie KL, Ning MM, Lo EH. 2009. Invited article: searching for oracles? Blood biomarkers in acute stroke. Neurology 73:393–399 [DOI] [PMC free article] [PubMed] [Google Scholar]
- 12.Freret T, Bouet V, Toutain J, Saulnier R, Pro-Sistiaga P, Bihel E, Mackenzie ET, Roussel S, Schumann-Bard P, Touzani O. 2008. Intraluminal thread model of focal stroke in the nonhuman primate. J Cereb Blood Flow Metab 28:786–796 [DOI] [PubMed] [Google Scholar]
- 13.Fukuda S, del Zoppo GJ. 2003. Models of focal cerebral ischemia in the nonhuman primate. ILAR J 44:96–104 [DOI] [PubMed] [Google Scholar]
- 14.Gao H, Liu Y, Lu S, Xiang B, Wang C. 2006. A reversible middle cerebral artery occlusion model using intraluminal balloon technique in monkeys. J Stroke Cerebrovasc Dis 15:202–208 [DOI] [PubMed] [Google Scholar]
- 15.Jensen MB, Chacon MR, Sattin JA, Levine RL, Vemuganti R. 2009. Potential biomarkers for the diagnosis of stroke. Expert Rev Cardiovasc Ther 7:389–393 [DOI] [PubMed] [Google Scholar]
- 16.Jickling GC, Xu H, Stamova B, Ander BP, Zhan X, Tian Y, Liu D, Turner RJ, Mesias M, Verro P, Khoury J, Jauch EC, Pancioli A, Broderick JP, Sharp FR. 2010. Signatures of cardioembolic and large-vessel ischemic stroke. Ann Neurol 68:681–692 [DOI] [PMC free article] [PubMed] [Google Scholar]
- 17.Kraiselburd E. 1987. Dengue virus vaccine studies in Puerto Rico: a review. P R Health Sci J 6:27–29 [PubMed] [Google Scholar]
- 18.Linfante I, Wakhloo AK. 2007. Brain aneurysms and arteriovenous malformations: advancements and emerging treatments in endovascular embolization. Stroke 38:1411–1417 [DOI] [PubMed] [Google Scholar]
- 19.Liu Y, D'Arceuil HE, Westmoreland S, He J, Duggan M, Gonzalez RG, Pryor J, de Crespigny AJ. 2007. Serial diffusion tensor MRI after transient and permanent cerebral ischemia in nonhuman primates. Stroke 38:138–145 [DOI] [PubMed] [Google Scholar]
- 20.Mack WJ, Komotar RJ, Mocco J, Coon AL, Hoh DJ, King RG, Ducruet AF, Ransom ER, Oppermann M, DeLaPaz R, Connolly ES., Jr 2003. Serial magnetic resonance imaging in experimental primate stroke: validation of MRI for preclinical cerebroprotective trials. Neurol Res 25:846–852 [DOI] [PubMed] [Google Scholar]
- 21.Nagel S, Wagner S, Koziol J, Kluge B, Heiland S. 2004. Volumetric evaluation of the ischemic lesion size with serial MRI in a transient MCAO model of the rat: comparison of DWI and T1WI. Brain Res Brain Res Protoc 12:172–179 [DOI] [PubMed] [Google Scholar]
- 22.Rosset A, Spadola L, Ratib O. 2004. OsiriX: an open-source software for navigating in multidimensional DICOM images. J Digit Imaging 17:205–216 [DOI] [PMC free article] [PubMed] [Google Scholar]
- 23.Sariol CA, Munoz-Jordan JL, Abel K, Rosado LC, Pantoja P, Giavedoni L, Rodriguez IV, White LJ, Martinez M, Arana T, Kraiselburd EN. 2007. Transcriptional activation of interferon-stimulated genes but not of cytokine genes after primary infection of rhesus macaques with Dengue virus type 1. Clin Vaccine Immunol 14:756–766 [DOI] [PMC free article] [PubMed] [Google Scholar]
- 24.Song JK, Eskridge JM, Chung EC, Blake LC, Elliott JP, Finch L, Niakan C, Maravilla KR, Winn HR. 2000. Preoperative embolization of cerebral arteriovenous malformations with silk sutures: analysis and clinical correlation of complications revealed on computerized tomography scanning. J Neurosurg 92:955–960 [DOI] [PubMed] [Google Scholar]
- 25.Spetzler RF, Selman WR, Weinstein P, Townsend J, Mehdorn M, Telles D, Crumrine RC, Macko R. 1980. Chronic reversible cerebral ischemia: evaluation of a new baboon model. Neurosurgery 7:257–261 [DOI] [PubMed] [Google Scholar]
- 26.STAIR 1999. Recommendations for standards regarding preclinical neuroprotective and restorative drug development. Stroke 30:2752–2758 [DOI] [PubMed] [Google Scholar]
- 27.Stamova B, Xu H, Jickling G, Bushnell C, Tian Y, Ander BP, Zhan X, Liu D, Turner R, Adamczyk P, Khoury JC, Pancioli A, Jauch E, Broderick JP, Sharp FR. 2010. Gene expression profiling of blood for the prediction of ischemic stroke. Stroke 41:2171–2177 [DOI] [PMC free article] [PubMed] [Google Scholar]
- 28.Tang Y, Lu A, Aronow BJ, Sharp FR. 2001. Blood genomic responses differ after stroke, seizures, hypoglycemia, and hypoxia: blood genomic fingerprints of disease. Ann Neurol 50:699–707 [DOI] [PubMed] [Google Scholar]
- 29.Tang Y, Lu A, Aronow BJ, Wagner KR, Sharp FR. 2002. Genomic responses of the brain to ischemic stroke, intracerebral haemorrhage, kainate seizures, hypoglycemia, and hypoxia. Eur J Neurosci 15:1937–1952 [DOI] [PubMed] [Google Scholar]
- 30.Valentine LE, Watkins DI. 2008. Relevance of studying T cell responses in SIV-infected rhesus macaques. Trends Microbiol 16:605–611 [DOI] [PMC free article] [PubMed] [Google Scholar]
- 31.Warach S, Dashe JF, Edelman RR. 1996. Clinical outcome in ischemic stroke predicted by early diffusion-weighted and perfusion magnetic resonance imaging: a preliminary analysis. J Cereb Blood Flow Metab 16:53–59 [DOI] [PubMed] [Google Scholar]
- 32.West GA, Golshani KJ, Doyle KP, Lessov NS, Hobbs TR, Kohama SG, Pike MM, Kroenke CD, Grafe MR, Spector MD, Tobar ET, Simon RP, Stenzel-Poore MP. 2009. A new model of cortical stroke in the rhesus macaque. J Cereb Blood Flow Metab 29:1175–1186 [DOI] [PMC free article] [PubMed] [Google Scholar]


