

Abstract
The inoculum effect (IE) refers to the decreasing efficacy of an antibiotic with increasing bacterial density. It represents a unique strategy of antibiotic tolerance and it can complicate design of effective antibiotic treatment of bacterial infections. To gain insight into this phenomenon, we have analyzed responses of a lab strain of Escherichia coli to antibiotics that target the ribosome. We show that the IE can be explained by bistable inhibition of bacterial growth. A critical requirement for this bistability is sufficiently fast degradation of ribosomes, which can result from antibiotic-induced heat-shock response. Furthermore, antibiotics that elicit the IE can lead to ‘band-pass’ response of bacterial growth to periodic antibiotic treatment: the treatment efficacy drastically diminishes at intermediate frequencies of treatment. Our proposed mechanism for the IE may be generally applicable to other bacterial species treated with antibiotics targeting the ribosomes.
Keywords: antibiotic, bacteria, bistability, inoculum effect
Introduction
Antibiotics have been hailed as the most significant therapeutic discovery in medicine (Levy, 2002). However, they are falling victim to their own success due to decades of overuse and misuse. Bacteria have developed resistance to all existing antibiotics and they are doing so at an alarming rate, considering the slow timescale at which new antibiotics are being developed (Falconer and Brown, 2009). In addition to developing new antibiotics, there is a critical need to design better treatment protocols by using existing antibiotics (Levy and Marshall, 2004; Yeh et al, 2009). A major challenge facing the development of effective antibiotic treatment is the lack of understanding of how bacterial populations respond to treatment. As such, a better understanding of the myriad of ways in which bacteria can resist or tolerate antibiotic treatment at the population level is required.
The efficacy of many antibiotics is known to decline with increasing inoculum of bacterial pathogens (Brook, 1989; Soriano et al, 1990; Udekwu et al, 2009). At intermediate concentrations of these antibiotics, a bacterial population can survive if its initial density is high, but can go extinct otherwise. Known as the inoculum effect (IE), this phenomenon has been observed for a wide range of antibiotic classes including β-lactams (Fass, 1983), glycopeptides (McGrath et al, 1994), aminoglycosides (Kelly and Matsen, 1976), macrolides (Carbon, 1998), quinolones (Fass, 1983), and others (Chin et al, 2007; Cotroneo et al, 2008). In the clinical setting, the presence of IE is undesirable as it can cause overestimation of in vitro resistance (Duraisingh et al, 1999), increased mortality rates of infected hosts due to administration of insufficient doses of antibiotics (Soriano et al, 1990), and increases in the generation rate of resistant pathogens (Martinez and Baquero, 2000). IE has been observed both in animal models of infection (Nicas and Bryan, 1978; Mizunaga et al, 2005) and in human patients (Moshkowitz et al, 1995; Lai et al, 2003), suggesting its clinical relevance. To date, however, there is a general lack of mechanistic understanding of IE.
For a bacterial pathogen that can break down an antibiotic, the cause of IE appears to be self-evident: increasing bacterial density would increase the overall turnover rate of the antibiotic, thus reducing its efficacy (Soriano et al, 1992; Craig et al, 2004). It is particularly puzzling, however, how IE would arise when antibiotics are not broken down by pathogens (Udekwu et al, 2009). This scenario encompasses a large number of antibiotics that target the ribosome. IE also resembles growth bistability: for the same concentration of an antibiotic, the survival or extinction of a population depends on its initial condition—its initial density. In this case, since extracellular factors are unlikely the underlying causes of IE, it is plausible that the growth bistability could arise from interactions between antibiotics and intracellular factors. Furthermore, we could focus on system dynamics involving both antibiotics and ribosomes, which are the primary intracellular targets of these antibiotics. Taken these together, we ask whether IE can be explained by non-linear dynamics resulting from the antibiotic-mediated inhibition of the ribosome.
Results
Antibiotic inhibition can lead to growth bistability
We first considered the dynamics of an antibiotic that specifically targets and interacts with the ribosome (Figure 1A). In each bacterium, the accumulation of the ribosome (C) can be described as a positive feedback loop (Tadmor and Tlusty, 2008). The antibiotic (A) can prevent the activation of the positive feedback by binding to C, resulting in a basic regulatory motif able to generate bistability (Thron, 1997; Figure 1A). For certain antibiotics, inhibition of C induces the heat-shock response (HSR) due to mistranslated proteins (Goff and Goldberg, 1985; Vanbogelen and Neidhardt, 1990). HSR in Escherichia coli upregulates chaperone proteins (e.g., DnaK) and proteases (lon and ClpP; Goff et al, 1984; Parsell and Lindquist, 1993). These proteases can target ribosomal proteins for increased degradation when bacteria are stressed (Kuroda et al, 2001). Heat shock, as well as treatment with certain antibiotics, has also been shown to cause degradation of ribosomal RNA (rRNA; Dubin, 1964; Suzuki and Kilgore, 1967; Rosenthal and Iandolo, 1970; Tolker-Nielsen and Molin, 1996; Sykes et al, 2010) and ribosomal proteins (Sykes et al, 2010). Therefore, degradation of C (ribosomes) can be increased when these antibiotics stimulate HSR (see Supplementary information). The above interactions can be captured by a simple mathematical model (Equation 1; Supplementary Equation S13):
Figure 1.

Antibiotic inhibition of the ribosome can lead to growth bistability. (A) Inhibition of ribosomes (C) by an antibiotic (A). CA represents complex of C and A, and * represents degradation products of C. The model accounts for the positive feedback of C, the transport of A across the bacterial membrane, the binding of A and C, and the degradation of C (left panel). The complex model (middle panel) corresponds to a basic network motif (right panel) that can generate bistability. See Supplementary Figure S1 for additional material. (B) With δ=10−4 (Equation 1), the system has one stable steady state. (C) With δ=10−6 (Equation 1), the system has two stable steady states. Green circles indicate stable steady states. Red circles indicate unstable steady states. The black lines represent the synthesis rate of C (first and second right hand side (RHS) terms of Equation 1). The dotted lines represent the decay and inhibition of C (third RHS term of Equation 1). ϕ=5 × 10⁻⁶ and γ=10−4 (Equation 1). (D) The region of IE shrinks and shifts to higher values of ϕ (antibiotic concentration) with increasing δ (degradation of C). At a high δ (slow degradation of C), a bacterial population would survive or go extinct regardless of its initial density (no IE). At a low δ (fast degradation of C), a bacterial population would exhibit IE (gray area). Red lines represent populations with low initial density (γ=10−5), green lines represent populations with high initial density (γ=10−4). c0=1, α=0.001, κ=0.5, δ=10−6 (full lines), δ=10−5 (dashed lines), and δ=10−4 (dotted lines) (Equation 1).
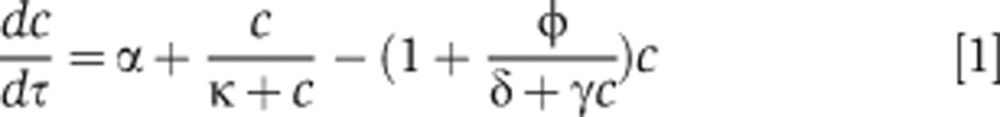 |
where c represents the concentration of ribosomes C, α represents the basal synthesis rate of c, κ represents the concentration of c eliciting half-maximal activation of its positive feedback, ϕ represents the applied antibiotic concentration, γ represents the bacterial density, and δ lumps the effects of multiple reactions: it increases with decreasing rates of intrinsic or antibiotic-induced degradation of C, increasing dissociation between the antibiotic and C, and increasing export rate of the antibiotic. We considered δ to represent antibiotic-induced degradation of C because dissociation constants of some antibiotics with ribosomes are of similar magnitude (Long and Porse, 2003; Balenci et al, 2008), but only certain antibiotics lead to HSR (Vanbogelen and Neidhardt, 1990).
Equation 1 was developed by simplifying five equations that describe the synthesis of ribosomes, the transport of an antibiotic across bacterial membranes, the binding between the antibiotic and ribosomes, the targeting of ribosomes for degradation, and the release of the antibiotic from ribosomes (Supplementary Equations S1–S5). We further assumed that certain molecular species are in quasi steady states due to their fast kinetics and that total amount of the antibiotic is conserved (Supplementary Equations S6–S12). This way, we obtained a simplified equation (Equation 1; Supplementary Equation S13) that would facilitate our mathematical analysis. The first term on the right hand side (RHS) of Equation 1 represents the leaky synthesis rate of ribosomes. The second RHS term models the positive feedback loop by C. The third RHS term represents both the degradation and antibiotic inhibition of C. See Supplementary information for detailed model description. We note that in response to certain antibiotics, E. coli can upregulate the transcriptional rate of ribosomal genes (Fraenkel and Neidhardt, 1961; Kurland and Maaloe, 1962; Bollenbach et al, 2009). Inclusion of this upregulation (<2-fold; Bollenbach et al, 2009; Kurland and Maaloe, 1962) would not affect our qualitative prediction of IE (Supplementary information; Supplementary Equations S17–S19).
Figure 1B and C shows qualitatively different solutions of Equation 1 using two parameter sets. In each case, the black line corresponds to the first two RHS terms of Equation 1 (the synthesis of C); the dotted line corresponds to the third RHS term (the degradation of C). If δ is sufficiently large (e.g., due to slow degradation of C), then the system has a globally stable steady state (Figure 1B). In this case, c will converge to the steady state regardless of the initial condition of the system. However, if δ is sufficiently small (e.g., due to fast degradation of C), then the system has two stable steady states that are separated by an unstable one (Figure 1C). Bacteria would survive if and only if c reaches the high steady state.
Next, we calculated steady-state values (css) at two different initial densities (γ) and increasing antibiotic concentrations (ϕ) (Figure 1D). If δ is sufficiently large (e.g., due to slow degradation of C), then c would be insensitive to γ (red and green dotted lines, Figure 1D). In this scenario, bacterial populations either survive or go extinct irrespective of their initial density. This case could arise for an antibiotic that does not enhance degradation of ribosomes (Figure 1A, gray box). However, if δ is sufficiently small (e.g., due to the fast degradation of C, Figure 1A, gray box), then c would be sensitive to γ. At ϕ ∼5 × 10⁻⁶, c would converge to a high stable steady state if the initial density is high (γ=10−4, Figure 1D, green line). At the high initial density, each bacterium could receive a small concentration of an antibiotic, which would only minimally induce ribosomal degradation and allow the rise of ribosomal concentration. Otherwise, with a low initial density (γ=10−5, Figure 1D, red line), c would converge to a low stable steady state. At the low initial density, each bacterium would receive a high concentration of an antibiotic, which would activate ribosomal degradation and prevent the accumulation of ribosomes. Therefore, the bistability would cause either population survival (i.e., increase in C, which has been noted previously; Scott et al, 2010) or extinction (i.e., decrease in C) depending on the initial population density. This bistable region represents the IE region, where the ability of a population to survive antibiotic treatment depends upon its initial density. We note that the bistability requires strong inhibition of C by A, which can be generated through antibiotic-induced degradation of C (Figure 1A, basic motif). When this occurs, antibiotics are titrated more strongly through the degradation pathway, which gives rise to IE. Furthermore, the region of IE would shift to higher values of ϕ with increasing δ and diminish at δ>10−4 (Figure 1D). The magnitude of δ depends on several parameters (Supplementary information) including fast degradation of C, which could be enhanced by HSR.
Kanamycin, which induces HSR and fast degradation of ribosomes, led to IE
We first validated the fundamental assumption of our model that certain antibiotics could induce HSR and cause fast ribosomal degradation. To test this assumption, we analyzed the response of an E. coli strain to kanamycin and chloramphenicol. We chose these antibiotics because kanamycin, but not chloramphenicol, has been observed to induce HSR (Vanbogelen and Neidhardt, 1990; Supplementary Table S1). In addition, while several antibiotics have been shown to cause rRNA degradation, a previous study has shown that treatment with chloramphenicol does not cause rRNA degradation (Dubin, 1964). Consistent with the literature, we found that treatment with kanamycin, but not chloramphenicol, resulted in HSR (Supplementary Figure S1A) and led to enhanced degradation of a cyan fluorescence protein (CFP) fused to a ClpP targeting SsrA tag (Supplementary Figure S1B). This enhanced degradation was likely due to increased ClpP activity resulting from induced HSR. Furthermore, we found that treatment with kanamycin led to faster degradation of ribosomal protein L13 (fused to a yellow fluorescent protein (YFP)) when compared with chloramphenicol (Supplementary Figure S1C). We note that this fusion protein is integrated into the ribosome (Supplementary Methods; Supplementary Figure S1D). In addition, we found that treatment with kanamycin caused faster rRNA degradation than treatment with chloramphenicol (Supplementary Figure S1E–G). Finally, we verified that the amount of ribosomes increased in a growing bacterial population (Supplementary Figure S1H), which is consistent with our model prediction on bistable dynamics of C (Figure 1B–D). As such, treatment with kanamycin, but not chloramphenicol, led to HSR and ribosome degradation.
Altogether, based on our model (Equation 1) and the experimental data, we expected kanamycin to exhibit IE (δlow, Figure 1D), but not chloramphenicol (δhigh, Figure 1D). Indeed, bacteria exhibited IE when treated with kanamycin (Figure 2A and C; Supplementary Figure S2A and I). At 6–10 μg/ml kanamycin, populations with low initial densities (black lines) did not grow after 24 h. However, those with high initial densities (red lines) grew. In contrast, bacteria did not exhibit IE when treated with chloramphenicol (Figure 2B and D; Supplementary Figure S2B, C, and J). At each concentration of chloramphenicol tested, bacterial populations either grew or did not grow regardless of their initial density. As such, kanamycin, which causes HSR and ribosome degradation, resulted in IE, whereas chloramphenicol, which does not cause HSR and ribosome degradation, did not.
Figure 2.
Kanamycin, but not chloramphenicol, led to IE in E. coli strain BL21. (A) Bacteria exhibited IE with kanamycin (6–10 μg/ml). Red and black lines represent high and low initial cell densities, respectively. Dark gray regions indicate that populations exhibited IE. Light gray regions indicate that both populations went extinct. (B) Bacteria did not exhibit IE with chloramphenicol. At both low and high initial densities, bacterial populations either survived or went extinct depending upon the applied concentration of chloramphenicol. See additional results in Supplementary Figure S2. (C) Dose response of bacterial growth rates with increasing concentrations of kanamycin. Red and black lines represent high and low initial cell density, respectively. Maximum growth rates were used as more sensitive metrics of bacterial growth as compared with absolute differences in optical densities. (D) Dose response of bacterial growth rates with increasing concentrations of chloramphenicol. Source data is available for this figure in the Supplementary Information.

To examine generality of IE in bacterial pathogens, we tested enterotoxigenic E. coli (ATCC 43886, Supplementary Methods) and Salmonella typhimurium (ATCC 14028, Supplementary Methods). These pathogens also exhibited IE when treated with kanamycin, but not with chloramphenicol (Figure 3A–D; Supplementary Figure S3A–D). In support of the notion that HSR underlies IE, treatment with kanamycin, but not with chloramphenicol, resulted in HSR in both of these pathogens (Supplementary Figure S3E).
Figure 3.
Kanamycin, but not chloramphenicol, led to IE in enterotoxigenic E. coli (ETEC) and S. typhimurium. (A) ETEC exhibited the inoculum effect at 13–17.5 μg/ml kanamycin. Red and black lines represent high and low initial cell density, respectively. Dark gray regions indicate that populations exhibited IE. Light gray regions indicate that both populations went extinct. (B) ETEC did not exhibit inoculum effect at all tested concentrations of chloramphenicol. (C) S. typhimurium exhibited the inoculum effect at 20–60 μg/ml kanamycin. (D) S. typhimurium did not exhibit inoculum effect at all tested concentrations of chloramphenicol. See additional results in Supplementary Figure S3. Source data is available for this figure in the Supplementary Information.

Next, we carried out experiments to test the contribution of alternative mechanisms to the generation of IE (Supplementary information; Supplementary Table S2). Our results indicate that IE was not due to the emergence of spontaneous mutants, as single colonies isolated from 6 to 10 μg/ml of kanamycin (IE region) during the growth phase did not have increased minimal inhibitory concentrations (MIC) compared with untreated, wild-type bacteria (Supplementary Figure S2D and E). Furthermore, IE was not due to cell-to-cell communication or secreted metabolites that could confer protection of cells against antibiotic treatment. In particular, we isolated spent media from bacteria inoculated at a high initial cell density (50 × initial dilution) that were grown in 0, 6, 8, 10 or 12 μg/ml kanamycin (IE region) for 6 h. The isolated spent media did not support the growth of bacteria inoculated at a low initial cell density (500 × dilution of an overnight culture (Supplementary Figure S2F). In addition, literature data suggest that bacteria secrete both indole and H2S, which can rescue bacteria from antibiotic treatment (Lee et al, 2010; Shatalin et al, 2011). These secreted molecules could contribute to cell-density dependence mechanisms that cause IE. However, we observed that both tnaA (cannot produce indole) and sseA (produces significantly less H2S) knockout strains produced IE (Supplementary Figure S2G and H). Finally, persister cells that can tolerate antibiotics could emerge, hence plausibly explain the growth of bacteria in the IE region. However, this explanation would require the generation of persister cells at a very high rate, which is in contrast to our single-cell measurements and inconsistent with the literature data (Supplementary Table S2). Taken together, these results further confirmed the notion that the major determinant of IE was the fast degradation of C.
Model-guided perturbations of IE
If fast degradation of C was the major determinant for the generation of IE, then we hypothesized that other antibiotics that induce HSR would also cause IE. To test this notion, we examined bacterial response to streptomycin, puromycin, gentamicin, tobramycin, neomycin, and nourseothricin, which induce HSR, as well as tetracycline, which does not (Vanbogelen and Neidhardt, 1990; Supplementary Table S1; Supplementary Figure S1A). Similarly to kanamycin, these antibiotics also bind to C (Supplementary Table S1) and therefore can be described by our generic model (Equation 1; Figure 1A). Consistent with our hypothesis, the antibiotics that induced HSR caused IE, whereas tetracycline did not (Figure 4A and B; Supplementary Figure S4A–C).
Figure 4.

Perturbation of HSR and protein degradation shifted the IE region. (A) Fast ribosome turnover, and thus IE can be initiated by challenging bacteria with numerous antibiotics that stimulate HSR. HSR and ribosome degradation can be perturbed using temperature, chemical inhibitors, and knockouts. (B) IE is initiated with various antibiotics. Tetracycline (Tet) and chloramphenicol (Cm), which to do not induce HSR, did not lead to IE. In contrast, tobramycin (Tob), gentamicin, (Gen), nourseothricin (Nou), neomycin (Neo), puromycin (Pur), streptomycin (Str), and kanamycin (Kan), which induce HSR, resulted in IE. See sample results of Str, Pur, and Tet in Supplementary Figure S4. Dark gray regions indicate that populations exhibited IE. Light gray regions indicate that both populations went extinct. (C) Inhibition of serine proteases (Ser Inh, 10 μg/ml) shifted the bifurcation region to higher concentrations of kanamycin (Kan+Ser Inh, 12–15 μg/ml). Similarly, treatment with cysteine protease inhibitors (Cys Inh, 10 μg/ml) or aspartyl protease (Asp Inh, 10 μg/ml) inhibitors shifted the IE region to 8–12 μg/ml. Heat shock at 42°C shifted the bifurcation region to lower concentrations of kanamycin (Kan+42°C, 0.5–1 μg/ml). Inhibition of all proteases reversed this effect by shifting the IE region back to higher concentrations of kanamycin (Kan+42°C+Inh, 5–6 μg/ml). Chloramphenicol coupled with heat shock led to IE (Cm+42°C, 0.5–1 μg/ml), which was abolished by the inhibition of all proteases (Cm+42°C+Inh). See additional results in Supplementary Figure S4. (D) The wild-type BW25113 strain (BW) exhibited IE between 4 and 8 μg/ml. Knockout strain Δlon shrunk the IE region to between 5 and 8 μg/ml. Knockout strain ΔclpX shrunk the IE region to 5 μg/ml. As such, the IE region was shrunk by knockout of proteases, which is consistent with our model predictions and the perturbation results in (C).
Our bifurcation analysis suggested that, if an antibiotic caused IE, increasing the degradation rate of C would decrease δ and shift the bifurcation region, thus IE, to a lower antibiotic concentration (lower ϕ). To test this prediction, we incubated cultures supplemented with kanamycin at 42°C to enhance HSR, which would increase the activity of several proteases (Neidhardt et al, 1984; Lindquist, 1986). As predicted, IE occurred at lower concentrations of kanamycin (0.5–1 μg/ml, Figure 4C; Supplementary Figure S4D). Furthermore, our model analysis suggested that direct induction of HSR would facilitate the generation of IE for an antibiotic that normally does not induce HSR (Figure 1D). We note that to satisfy this model prediction, an antibiotic that does not exhibit IE would need to have similar magnitude of transport and binding kinetics as kanamycin and does not interfere with the induction of ribosome degradation. To test this prediction, we incubated cultures at 42°C in medium supplemented with chloramphenicol, which did not exhibit IE at 37°C. Indeed, with heat shock, IE emerged at 0.5–1 μg/ml chloramphenicol (Figure 4C; Supplementary Figure S4E). We also demonstrated that heat shock (both with and without chloramphenicol treatment) caused fast degradation of both the ribosomal fusion protein L13-YFP (Supplementary Figure S1C; Supplementary Table S3) and rRNA (Supplementary Figure S1E). These results further supported the notion that antibiotic-mediated HSR is a major pathway that enhances ribosome degradation, which generates IE (Supplementary Table S2).
Our model (Equation 1) predicted that slow degradation of C would increase δ and shift the bifurcation region, thus IE, to higher antibiotic concentrations of antibiotics (higher ϕ) (Figure 1D). Indeed, IE occurred at higher concentrations of kanamycin (12–15 μg/ml, Figure 4C; Supplementary Figure S4F) in the presence of an inhibitor (10 μg/ml) that specifically blocks the activity of serine proteases (Bota and Davies, 2002). We note that treatment with a serine protease inhibitor reduced degradation of CFP (Supplementary Figure S4G). We also challenged bacteria using either a cysteine (10 μg/ml) or an aspartyl protease inhibitor (10 μg/ml), which shifted IE to slightly higher antibiotic concentrations (8–12 μg/ml kanamycin, Figure 4C). This differential impact reflects the fact that serine, but not cysteine or aspartyl, proteases are typically upregulated during HSR. We further tested if the protease inhibitors could reverse the impact of heat-shock treatment (Figure 4C). Specifically, we added all protease inhibitors (20 μg/ml) to bacteria treated with either kanamycin or chloramphenicol, coupled with heat shock at 42°C. We observed that the protease inhibitors shifted the IE region back toward higher concentrations of kanamycin (5–6 μg/ml). Furthermore, the protease inhibitors abolished the IE generated by the combined treatment of chloramphenicol and heat shock.
To corroborate these results, we tested BW25113 strains that contain either a lon or clpX knockout. As the knockout strains carry a kanamycin resistance gene, we challenged them with streptomycin that also induced IE (Figure 4B). Wild-type populations exhibited IE between 4 and 8 μg/ml (Figure 4D; Supplementary Figure S4H). With the lon knockout, the IE region was shrunk to 5–8 μg/ml (Supplementary Figure S4I). With the clpX knockout, the IE region was also shrunk to 5 μg/ml (Supplementary Figure S4J). These results are consistent with our model predictions. We note that activation of chaperones by HSR would not affect our conclusions (Supplementary information).
Recovery kinetics from transient antibiotic treatment
Based on our proposed mechanism for IE, we would expect a profound difference in the recovery of bacterial populations after transient treatment by the two types of antibiotics. Indeed, our modeling analysis showed that fast degradation of C would considerably delay the recovery of bacterial populations (Figure 5A and B). With a faster degradation of C, the total concentration of C would drop drastically during antibiotic treatment. As such, after the removal of an antibiotic, bacteria would need a longer time to synthesize sufficient amount of C to re-initiate growth.
Figure 5.
Delayed bacterial recovery from transient antibiotic treatment. (A) Recovery of a bacterial population after the removal of an antibiotic. For modeling studies, we defined recovery time (τlag) as the time from the removal of the antibiotic to the time when bacterial density starts to increase. (B) Recovery time increased much faster with fast degradation of ribosomes (black line, degradation rate=10−1) than with slow degradation (gray line, degradation rate=10−6). k0=10−6, k1=0.1, V1=0.2, ku=0.1, kf=1, kb=0.1, kin=3, kout=0.03, kr=0.02, and Aout=10 (which corresponds to an intermediate concentration). See Supplementary Equations S1–S5 and S16. (C) Population recovery after transient antibiotic treatment. We incubated bacteria in a flow system (Supplementary Figure S5A and B) in medium supplemented with either 10 μg/ml kanamycin or 10 μg/ml chloramphenicol. After treatment for a specific duration (i.e., treatment duration), we washed bacteria using fresh medium, tracked population growth and quantified recovery time as the time required for a population to increase above its initial density after antibiotic treatment. When treated with kanamycin, recovery time increased significantly with treatment duration (filled squares). In contrast, with chloramphenicol, recovery time stayed nearly constant (open squares). Lines of best fit, as determined visually, are shown. See Supplementary Figure S5 for additional data. Source data is available for this figure in the Supplementary Information.

To test this prediction, we examined recovery kinetics using a flow system (Supplementary Figure S5A and B). Specifically, we incubated bacteria using medium supplemented with either 10 μg/ml kanamycin (that caused IE) or 10 μg/ml chloramphenicol (that did not cause IE). After treatment for a specific duration, we washed bacteria using fresh medium and tracked population growth. We quantified recovery time as the time required for a population to increase above its initial density after antibiotic treatment. Consistent with the model prediction, we observed that the recovery time increased sharply with increasing duration of kanamycin treatment (Figure 5C, filled squares; Supplementary Figure S5C). After 4 h of kanamycin treatment, bacterial populations did not recover within our experimental duration (>16 h). For kanamycin treatment, the non-recovery of bacteria is likely due to death via hydroxyl radical damage (Kohanski et al, 2007) and detrimental protease activities because inhibiting the degradation of C conferred protective functions (Figure 4C). In contrast, recovery time stayed nearly constant with the tested durations of chloramphenicol treatment (Figure 5C, open squares; Supplementary Figure S5D).
Frequency dependence of periodic antibiotic treatment
While IE is commonly observed, its clinical relevance is sometimes debated, especially if antibiotics are applied periodically (Craig et al, 2004). Periodic antibiotic treatment is often favored because prolonged application of high concentrations of antibiotics can be toxic to patients (Powell et al, 1983) and can cause a strong selection pressure that favors resistant bacteria (Harbarth et al, 2000). The efficacy of periodic treatment would depend on both the frequency and dose of the antibiotic. These parameters are typically determined empirically (Powell et al, 1983) without considering IE. To address the issue, recent computational studies have shown that IE can diminish the efficacy of periodic antibiotic treatment at a fixed treatment frequency (Udekwu et al, 2009; Levin and Udekwu, 2010). However, these studies did not consider the molecular mechanism underlying IE (Figure 1), which, as we have shown, can drastically modulate the recovery kinetics after a pulse of antibiotic treatment (Figure 5). By taking these factors into account, here we ask if the efficacy of periodic treatment would exhibit different dependence on the frequency of the treatment, which is a critical parameter in the clinical setting.
To address this question, we constructed a population-based simple model that incorporates two essential features of our experimental observations: IE and its impact on recovery time (Figure 6A). Without IE, bacterial populations grow at rate μ2 after a lag time τlag without an antibiotic and do not grow with the antibiotic (Figure 6A, case i). Based on experimental measurements, we assumed that τlag increases exponentially with the duration of an antibiotic that exhibits IE and stays constant otherwise (Supplementary Figure S6A). With IE and N<Nc (which is a function of antibiotic concentration, Figure 1B and C), bacterial populations grow in the same way as the case above (Figure 6A, case ii). With IE and N>Nc, bacterial populations grow at rate μ2 without the antibiotic and at rate μ1 with the antibiotic (Figure 6A, case iii). We note that this model assumed that bacteria would not grow when antibiotic concentration is above a certain threshold and would recover with a time delay when antibiotic concentration decreases below a certain threshold. As such, the inclusion of antibiotic decay dynamics could reduce the effective time that an antibiotic inhibits bacterial growth.
Figure 6.

Modeling the impact of inoculum effect (IE) on periodic antibiotic treatment. (A) A simplified model that describes population dynamics in periodic pulses of an antibiotic. Cases (i) and (ii) cause the same dynamics as indicated by the top panel. Case (iii) causes the dynamics as indicated by the bottom panel. See Supplementary Figure S6A for functions of τlag. (B) IE is predicted to cause band-pass response of bacterial growth to periodic treatment (bottom panel). Without IE, bacterial density increased with increasing pulse periods (top panel). μ1=μ2=0.07, N0=10−6, Nc=10−5, and Nmax=10−3. Each line corresponds to a specific pulse period (T) as indicated next to the line. Note that in the bottom panel (with IE), time series of both T=500 and T=10 min are identical. (C) With IE, the effective growth duration (T/2−τlag) in each cycle first increases and then decreases with T, leading to band-pass bacterial response. Without IE, the effective growth duration increases monotonically with T. See Supplementary Figure S6 for additional data.
We then simulated bacterial growth in response to periodic pulses of an antibiotic (Figure 6B). For each pulse, duration of antibiotic treatment is half of the pulse period (Figure 6B). To ensure a fair comparison between pulse periods, the total time of bacterial exposure to each antibiotic was kept constant by using appropriate pulse periods (T) and observation time points. Without IE, bacteria would exhibit low-pass response: the population density would increase monotonically with increasing pulse periods (Figure 6B, top panel). This can be intuitively explained by the approximately constant τlag after transient treatment by such an antibiotic (Figure 5B and C). With a longer pulse period, the effective growth duration (T/2–τlag) is greater and allows more bacterial growth (Figure 6C).
In contrast, the presence of IE and the delayed recovery kinetic could lead to band-pass bacterial response, where the population density would peak at an intermediate pulse period (Figure 6B, bottom panel, period=100 min). This can be explained by the exponential increase of τlag with increasing treatment duration in the presence of IE (Figure 6C). When the pulse period is small, its increase (thus a proportional increase in the treatment duration) causes a slower increase in τlag, which is at its initial stage of an exponential curve (Figure 5C). In each period, the growth duration (T/2−τlag) would increase with T. At an intermediate T, bacteria would have adequate time to recover from antibiotic treatment. This allows the population to grow beyond a threshold density for which subsequent antibiotic pulses are less effective at inhibiting bacterial growth. For sufficiently large T, τlag would increase much faster than T, leading to a decrease in the growth duration for increasing T (Figure 6C). Therefore, the delayed recovery kinetic is a critical requirement for the emergence of the band-pass response and IE would speed up the growth of bacteria in the band-pass region. The band-pass behavior would depend on several parameters, including the bacterial growth rate and τlag (Figure 6A). For example, the region of band-pass response would disappear with a sufficiently large basal τlag due to a high antibiotic concentration (Supplementary Figure S6B). In this case, τlag after each pulse of treatment would always be longer than the treatment duration, leaving insufficient time for bacteria to recover in the absence of antibiotic in each period of the treatment. The region of band-pass behavior stays constant with a decreased μ1 (Supplementary Figure S6B) because the slower μ1 would not change the steady-state dynamics, though the underlying temporal dynamics would vary for different parameters. We note that the inclusion of an antibiotic decay function did not qualitatively affect our model predictions (Supplementary Figure S6C and D).
To test model predictions, we tracked bacterial growth in response to periodic antibiotic treatment using the flow system. Consistent with our batch-culture experiments, bacterial cultures initiated from low density did not grow when treated with a constant, high concentration of either chloramphenicol or kanamycin (10 μg/ml) (Figure 7A–C). When challenged with 10 μg/ml chloramphenicol, bacterial densities increased with increasing pulse periods of 40, 120, 240, and 480 min (Figure 7A and B). In contrast, when challenged with pulses of either 10 μg/ml kanamycin or 80 μg/ml puromycin (a concentration that caused IE), bacterial densities peaked at an intermediate period of 120 min (Figures 7A and C; Supplementary Figure S7C). When challenged with 20 μg/ml kanamycin (a concentration that did not cause IE), bacteria did not grow at all pulse periods examined (Supplementary Figure S7A), likely because bacteria recovered much slower from the treatment (Supplementary Figure S6B, basal τlag=30). When we treated cells with chloramphenicol (10 μg/ml) and heat shock (42°C), bacterial density peaked at intermediate pulse period (120 min, Supplementary Figure S7D). As such, exogenously applied heat shock coupled with chloramphenicol treatment was able to generate both IE (Figure 4C; Supplementary Figure S4E) and band-pass behavior. For treatment with both antibiotics, we note that the lower densities at the pulse period of 40 min were not due to the loss of bacteria from the cell chamber (Supplementary Figure S7B). Our results demonstrate the drastic qualitative changes in treatment efficacy due to both IE and the recovery kinetics, which are critical factors that have been neglected in previous studies (Udekwu et al, 2009).
Figure 7.
Kanamycin, but not chloramphenicol, caused band-pass response with periodic treatment. (A) Microscope images of bacterial growth in the flow system. At the 8th hour, bacterial densities increased with increasing pulse periods of chloramphenicol (10 μg/ml). In contrast, bacterial densities peaked at an intermediate pulse period (120 min) of kanamycin (10 μg/ml). (B) Bacteria exhibited ‘low-pass’ response in varying pulse periods of chloramphenicol. The number of bacteria increased with increasing pulse periods. (C) Bacteria exhibited ‘band-pass’ response in varying pulse periods of kanamycin. The number of bacteria increased significantly with the pulse period of 120 min (green line). Each error bar indicates the standard deviation of five microscope images. Representative time series were obtained from two experiments. See Supplementary Figure S7 for additional data. Source data is available for this figure in the Supplementary Information.

Discussion
Based on quantitative modeling and experimentation of bacterial growth challenged by antibiotics that inhibit ribosomes, we have established a new mechanism that underlies the generation of IE. This mechanism contributes to the understanding of the growing number of non-genetic tolerance mechanisms of bacteria, which include persistence (Lewis, 2007), population level communication (Yarwood and Schlievert, 2003), and programmed bacterial death (Bayles, 2007). We note that this mechanism fundamentally differs from a previously proposed mechanism for IE whereby bacteria secrete enzymes to degrade or modify antibiotics (Craig et al, 2004), in terms of both the molecular interactions involved and its consequences on bacterial population dynamics. Specifically, the mechanism requires the inhibition of a positive feedback loop by an inhibitor (the antibiotic) and the fast degradation of ribosomes induced by antibiotics that elicit HSR (Figure 1A). Such generic requirements suggest that this mechanism is likely applicable for treatment of other bacterial species by antibiotics that target ribosomes. Indeed, our experimental results on enterotoxigenic E. coli (ETEC) and S. typhimurium support this notion. Furthermore, the mechanism may also be applicable to antibiotics that target other components of the core replication machinery (e.g., RNA polymerases, DNA polymerases, and gyrase). These potential follow-up studies would likely require modification of our model because our model cannot capture the essential aspects of antibiotic inhibition for targets outside of the ribosomes (i.e., β-lactams, quinolones, etc.). By constraining the objective of this manuscript to ribosome-targeting antibiotics, we were able to model the interactions specifically and predicted results of perturbation.
Our model-guided perturbations (Figures 2, 3, 4; Supplementary Table S2) and experimental analyses have ruled out previously described mechanisms of antibiotic resistance that could account for IE including enzyme or metabolite secretion, mutation-based resistance, quorum sensing, and differences in initial metabolic states. However, we note that the mechanism described herein may also be activated along with other previously described responses to antibiotics, such as the production of radical oxygen species (Kohanski et al, 2007). It is plausible that radical oxygen species may act as a trigger for activation of heat shock or increased activity of proteases. As such, we contend that the generation of HSR is a sufficient, but may not be the only, condition to enhance ribosomal degradation.
It is interesting to contemplate whether the fast degradation of ribosomes due to antibiotics could be generalized to bactericidal and bacteriostatic antibiotics. As is the case here, antibiotics that caused HSR and IE are bactericidal in E. coli, while those that did not cause IE are bacteriostatic and do not cause HSR (Supplementary Table S1). Our results suggest that ribosome degradation likely occurs before bacterial death because the inhibition of proteases shifted the IE region to higher antibiotic concentrations (Figure 4C and D). As such, both ribosome degradation and bactericidal effect of the tested antibiotics are unlikely to be independent cellular events, alongside other cellular pathways (Kohanski et al, 2007). Based on this reasoning, bacterial death cannot be distinguished as an alternative mechanism per se. However, we have demonstrated that a critical requirement of IE is the ability of an antibiotic to induce HSR, which leads to fast ribosome degradation.
Finally, we showed that IE could profoundly impact the efficacy of periodic antibiotic treatment. This may lead to prolonged periods of tolerance, which may lead to bacteria who acquire genetic mutations conferring antibiotic resistance (Lee et al, 2010). Despite the relative simplicity of our dosing regimen, our results highlight the potential of non-linear bacterial response to periodic treatment, which has not been previously observed. These results underscore the critical need to elucidate underlying mechanisms of IE, in order to achieve optimal treatment efficacy in the clinical setting.
Materials and methods
Unless otherwise noted, E. coli strain BL21 (B F- dcm ompT hsdS(rB− mB−) gal) was used throughout this study. M9 medium, supplemented with 0.4% (w/v) glucose and 0.1% (w/v) casamino acids, was used for growth assays. Real-time bacterial growth and fluorescence were measured using a micro-plate reader (Victor 3 plate reader; Perkin-Elmer, MA, USA). To control antibiotic pulses, a flow system was constructed and customized using parts from Harvard Apparatus (MA, USA). An SBML file of the simplified model (Equation 1) has been deposited in the BioModels Database with the identifier number MODEL1208300000. Please see Supplementary Methods for additional detail.
Supplementary Material
Supplementary Figures S1-S7
A Matlab file for Fig. 1B
A Matlab file for Fig. 1C
A SBML file for Fig. 1D
A Matlab file for Fig. 1D
Acknowledgments
We thank Nicholas Buchler, Anand Pai, and Yu Tanouchi for discussions and comments. This work was partially supported by the National Science Foundation (BES-0625213), National Science Foundation Career Award (CBET-0953202), the National Institutes of Health (1P50GM081883 and 1R01GM098642), a DuPont Young Professorship (LY), a David and Lucile Packard Fellowship (LY), a Medtronic Fellowship (CT), a Lane Postdoctoral Fellowship (CT), a Pratt Fellowship (SP), and a National Science Foundation Graduate Fellowship (KR).
Author contributions: CT, RPS, and LY conceived research and designed experiments. RPS, CT, JKS, KAR, and SP performed experiments. CT performed modeling analysis. CT, RPS, MK, and LY provided materials and reagents. CT, RPS, and LY interpreted results and wrote the manuscript with critical inputs from MK. All authors approved the manuscript.
Footnotes
The authors declare that they have no conflict of interest.
References
- Balenci D, Bernardi F, Cellai L, D'Amelio N, Gaggelli E, Gaggelli N, Molteni E, Valensin G (2008) Effect of Cu-II on the complex between kanamycin A and the bacterial ribosomal A site. Chembiochem 9: 114–123 [DOI] [PubMed] [Google Scholar]
- Bayles KW (2007) The biological role of death and lysis in biofilm development. Nat Rev Microbiol 5: 721–726 [DOI] [PubMed] [Google Scholar]
- Bollenbach T, Quan S, Chait R, Kishony R (2009) Nonoptimal microbial response to antibiotics underlies suppressive drug interactions. Cell 139: 707–718 [DOI] [PMC free article] [PubMed] [Google Scholar]
- Bota DA, Davies KJ (2002) Lon protease preferentially degrades oxidized mitochondrial aconitase by an ATP-stimulated mechanism. Nat Cell Biol 4: 674–680 [DOI] [PubMed] [Google Scholar]
- Brook I (1989) Inoculum effect. Rev Infect Dis 11: 361–368 [DOI] [PubMed] [Google Scholar]
- Carbon C (1998) Pharmacodynamics of macrolides, azalides, and streptogramins: effect on extracellular pathogens. Clin Infect Dis 27: 28–32 [DOI] [PubMed] [Google Scholar]
- Chin JN, Rybak MJ, Cheung CM, Savage PB (2007) Antimicrobial activities of ceragenins against clinical isolates of resistant Staphylococcus aureus. Antimicrob Agents Chemother 51: 1268–1273 [DOI] [PMC free article] [PubMed] [Google Scholar]
- Cotroneo N, Harris R, Perlmutter N, Beveridge T, Silverman JA (2008) Daptomycin exerts bactericidal activity without lysis of Staphylococcus aureus. Antimicrob Agents Chemother 52: 2223–2225 [DOI] [PMC free article] [PubMed] [Google Scholar]
- Craig WA, Bhavnani SM, Ambrose PG (2004) The inoculum effect: fact or artifact? Diagn Microbiol Infect Dis 50: 229–230 [DOI] [PubMed] [Google Scholar]
- Dubin DT (1964) Some effects of streptomycin on RNA metabolism in Escherichia coli. J Mol Biol 8: 749–767 [DOI] [PubMed] [Google Scholar]
- Duraisingh MT, Jones P, Sambou I, von Seidlein L, Pinder M, Warhurst DC (1999) Inoculum effect leads to overestimation of in vitro resistance for artemisinin derivatives and standard antimalarials: a Gambian field study. Parasitology 119Pt 5: 435–440 [DOI] [PubMed] [Google Scholar]
- Falconer SB, Brown ED (2009) New screens and targets in antibacterial drug discovery. Curr Opin Microbiol 12: 497–504 [DOI] [PubMed] [Google Scholar]
- Fass RJ (1983) In vitro activity of ciprofloxacin (Bay o 9867). Antimicrob Agents Chemother 24: 568–574 [DOI] [PMC free article] [PubMed] [Google Scholar]
- Fraenkel DG, Neidhardt FC (1961) Use of chloramphenicol to study control of RNA synthesis in bacteria. Biochim Biophys Acta 53: 96–110 [DOI] [PubMed] [Google Scholar]
- Goff SA, Casson LP, Goldberg AL (1984) Heat shock regulatory gene htpR influences rates of protein degradation and expression of the lon gene in Escherichia coli. Proc Natl Acad Sci USA 81: 6647–6651 [DOI] [PMC free article] [PubMed] [Google Scholar]
- Goff SA, Goldberg AL (1985) Production of abnormal proteins in E. coli stimulates transcription of lon and other heat shock genes. Cell 41: 587–595 [DOI] [PubMed] [Google Scholar]
- Harbarth S, Samore MH, Lichtenberg D, Carmeli Y (2000) Prolonged antibiotic prophylaxis after cardiovascular surgery and its effect on surgical site infections and antimicrobial resistance. Circulation 101: 2916–2921 [DOI] [PubMed] [Google Scholar]
- Kelly MT, Matsen JM (1976) In vitro activity, synergism, and testing parameters of amikacin, with comparisons to other aminoglycoside antibiotics. Antimicrob Agents Chemother 9: 440–447 [DOI] [PMC free article] [PubMed] [Google Scholar]
- Kohanski MA, Dwyer DJ, Hayete B, Lawrence CA, Collins JJ (2007) A common mechanism of cellular death induced by bactericidal antibiotics. Cell 130: 797–810 [DOI] [PubMed] [Google Scholar]
- Kurland CG, Maaloe O (1962) Regulation of ribosomal and transfer RNA synthesis. J Mol Biol 4: 193–210 [DOI] [PubMed] [Google Scholar]
- Kuroda A, Nomura K, Ohtomo R, Kato J, Ikeda T, Takiguchi N, Ohtake H, Kornberg A (2001) Role of inorganic polyphosphate in promoting ribosomal protein degradation by the Lon protease in E. coli. Science 293: 705–708 [DOI] [PubMed] [Google Scholar]
- Lai YC, Wang TH, Huang SH, Yang SS, Wu CH, Chen TK, Lee CL (2003) Density of Helicobacter pylori may affect the efficacy of eradication therapy and ulcer healing in patients with active duodenal ulcers. World J Gastroenterol 9: 1537–1540 [DOI] [PMC free article] [PubMed] [Google Scholar]
- Lee HH, Molla MN, Cantor CR, Collins JJ (2010) Bacterial charity work leads to population-wide resistance. Nature 467: 82–85 [DOI] [PMC free article] [PubMed] [Google Scholar]
- Levin BR, Udekwu KI (2010) Population dynamics of antibiotic treatment: a mathematical model and hypotheses for time-kill and continuous-culture experiments. Antimicrob Agents Chemother 54: 3414–3426 [DOI] [PMC free article] [PubMed] [Google Scholar]
- Levy SB (2002) The Antibiotic Paradox: How the Misuse of Antibiotics Destroys Their Curative Power 2nd edn, Cambridge, MA: Perseus Pub, [Google Scholar]
- Levy SB, Marshall B (2004) Antibacterial resistance worldwide: causes, challenges and responses. Nat Med 10: S122–129 [DOI] [PubMed] [Google Scholar]
- Lewis K (2007) Persister cells, dormancy and infectious disease. Nat Rev Microbiol 5: 48–56 [DOI] [PubMed] [Google Scholar]
- Lindquist S (1986) The heat-shock response. Annu Rev Biochem 55: 1151–1191 [DOI] [PubMed] [Google Scholar]
- Long KS, Porse BT (2003) A conserved chloramphenicol binding site at the entrance to the ribosomal peptide exit tunnel. Nucl Acids Res 31: 7208–7215 [DOI] [PMC free article] [PubMed] [Google Scholar]
- Martinez JL, Baquero F (2000) Mutation frequencies and antibiotic resistance. Antimicrob Agents Chemother 44: 1771–1777 [DOI] [PMC free article] [PubMed] [Google Scholar]
- McGrath BJ, Kang SL, Kaatz GW, Rybak MJ (1994) Bactericidal activities of teicoplanin, vancomycin, and gentamicin alone and in combination against Staphylococcus aureus in an in vitro pharmacodynamic model of endocarditis. Antimicrob Agents Chemother 38: 2034–2040 [DOI] [PMC free article] [PubMed] [Google Scholar]
- Mizunaga S, Kamiyama T, Fukuda Y, Takahata M, Mitsuyama J (2005) Influence of inoculum size of Staphylococcus aureus and Pseudomonas aeruginosa on in vitro activities and in vivo efficacy of fluoroquinolones and carbapenems. J Antimicrob Chemother 56: 91–96 [DOI] [PubMed] [Google Scholar]
- Moshkowitz M, Konikoff FM, Peled Y, Santo M, Hallak A, Bujanover Y, Tiomny E, Gilat T (1995) High Helicobacter pylori numbers are associated with low eradication rate after triple therapy. Gut 36: 845–847 [DOI] [PMC free article] [PubMed] [Google Scholar]
- Neidhardt FC, VanBogelen RA, Vaughn V (1984) The genetics and regulation of heat-shock proteins. Annu Rev Genet 18: 295–329 [DOI] [PubMed] [Google Scholar]
- Nicas TI, Bryan LE (1978) Relationship between gentamicin susceptibility criteria and therapeutic serum levels for Pseudomonas aeruginosa in mouse infection model. Antimicrob Agents Chemother 13: 796–801 [DOI] [PMC free article] [PubMed] [Google Scholar]
- Parsell DA, Lindquist S (1993) The function of heat-shock proteins in stress tolerance: degradation and reactivation of damaged proteins. Annu Rev Genet 27: 437–496 [DOI] [PubMed] [Google Scholar]
- Powell SH, Thompson WL, Luthe MA, Stern RC, Grossniklaus DA, Bloxham DD, Groden DL, Jacobs MR, DiScenna AO, Cash HA, Klinger JD (1983) Once-daily vs continuous aminoglycoside dosing: efficacy and toxicity in animal and clinical studies of gentamicin, netilmicin, and tobramycin. J Infect Dis 147: 918–932 [DOI] [PubMed] [Google Scholar]
- Rosenthal LJ, Iandolo JJ (1970) Thermally induced intracellular alteration of ribosomal ribonucleic acid. J Bacteriol 103: 833–835 [DOI] [PMC free article] [PubMed] [Google Scholar]
- Scott M, Gunderson CW, Mateescu EM, Zhang Z, Hwa T (2010) Interdependence of cell growth and gene expression: origins and consequences. Science 330: 1099–1102 [DOI] [PubMed] [Google Scholar]
- Shatalin K, Shatalina E, Mironov A, Nudler E (2011) H2S: a universal defense against antibiotics in bacteria. Science 334: 986–990 [DOI] [PubMed] [Google Scholar]
- Soriano F, Edwards R, Greenwood D (1992) Effect of inoculum size on bacteriolytic activity of cefminox and four other beta-lactam antibiotics against Escherichia coli. Antimicrob Agents Chemother 36: 223–226 [DOI] [PMC free article] [PubMed] [Google Scholar]
- Soriano F, Ponte C, Santamaria M, Jimenez-Arriero M (1990) Relevance of the inoculum effect of antibiotics in the outcome of experimental infections caused by Escherichia coli. J Antimicrob Chemother 25: 621–627 [DOI] [PubMed] [Google Scholar]
- Suzuki H, Kilgore WW (1967) Decomposition of ribosomal particles in Escherichia coli treated with mitomycin C. J Bacteriol 94: 666–676 [DOI] [PMC free article] [PubMed] [Google Scholar]
- Sykes MT, Shajani Z, Sperling E, Beck AH, Williamson JR (2010) Quantitative proteomic analysis of ribosome assembly and turnover in vivo. J Mol Biol 403: 331–345 [DOI] [PMC free article] [PubMed] [Google Scholar]
- Tadmor AD, Tlusty T (2008) A coarse-grained biophysical model of E. coli and its application to perturbation of the rRNA operon copy number. PLoS Comput Biol 4: e1000038. [DOI] [PMC free article] [PubMed] [Google Scholar]
- Thron CD (1997) Bistable biochemical switching and the control of the events of the cell cycle. Oncogene 15: 317–325 [DOI] [PubMed] [Google Scholar]
- Tolker-Nielsen T, Molin S (1996) Role of ribosome degradation in the death of heat-stressed Salmonella typhimurium. FEMS Microbiol Lett 142: 155–160 [DOI] [PubMed] [Google Scholar]
- Udekwu KI, Parrish N, Ankomah P, Baquero F, Levin BR (2009) Functional relationship between bacterial cell density and the efficacy of antibiotics. J Antimicrob Chemother 63: 745–757 [DOI] [PMC free article] [PubMed] [Google Scholar]
- Vanbogelen RA, Neidhardt FC (1990) Ribosomes as sensors of heat and cold shock in Escherichia coli. Proc Natl Acad Sci USA 87: 5589–5593 [DOI] [PMC free article] [PubMed] [Google Scholar]
- Yarwood JM, Schlievert PM (2003) Quorum sensing in Staphylococcus infections. J Clin Invest 112: 1620–1625 [DOI] [PMC free article] [PubMed] [Google Scholar]
- Yeh PJ, Hegreness MJ, Aiden AP, Kishony R (2009) Drug interactions and the evolution of antibiotic resistance. Nat Rev 7: 460–466 [DOI] [PMC free article] [PubMed] [Google Scholar]
Associated Data
This section collects any data citations, data availability statements, or supplementary materials included in this article.
Supplementary Materials
Supplementary Figures S1-S7
A Matlab file for Fig. 1B
A Matlab file for Fig. 1C
A SBML file for Fig. 1D
A Matlab file for Fig. 1D