Abstract
Low birth-weight (LBW) offspring exhibit reduced hypothalamic neural satiety pathways and dysregulated signaling leading to programmed hyperphagia and adult obesity. Hypothalamic appetite circuits develop during early life, under the influence of neurotrophic hormones (leptin, insulin). Notably, LBW newborns have reduced plasma leptin and insulin levels. As neurons and glia arise from neuronal progenitor cells (NPC), we postulated that a programmed impairment of NPCs may contribute to reduced hypothalamic neural pathway development in LBW offspring. Control dams received ad libitum food, whereas study dams were 50% food-restricted from pregnancy day 10 to 21 (LBW). At day 1 of age, hypothalamic NPCs were cultured as neurospheres (NS) and treated with leptin/insulin. We analyzed in vitro NPCs proliferation and differentiation into neurons/ astrocytes, expression of signal molecules promoting proliferation (activated Notch1 and its downstream target, Hes1) and in vivo NPC proliferation and migration. LBW offspring had impaired in vivo evidence of NPC division and migration, and reduced in vitro evidence of proliferation and differentiation to neurons and astrocytes, under basal and stimulated conditions. The reduced Notch1 and Hes1 expression in LBW neurosphere, under both basal and stimulated conditions, suggests a reduced progenitor cell population or reduced cell density within the neurosphere.
Keywords: Neuron, astrocyte, cell proliferation, cell differentiation, Notch1/Hes1, developmental programming
1. Introduction
There is convincing evidence that the in utero environment impacts on fetal development and alters a diversity of adult regulatory mechanisms. Consistent with the finding that low birth weight infants (LBW) have an increased risk for developing obesity in later life (Desai and Hales, 1997), poor maternal nutrition is associated with increased rates of obesity in adult male offspring (Ravelli, Der Meulen, Osmond, Barker, and Bleker, 1999). Most notably, among men born during the Dutch Hunger Winter of 1944–1945, those exposed to famine during the first half of gestation had a markedly increased risk of adult obesity (Ravelli, Stein, and Susser, 1976).
Animal studies confirm that maternal undernutrition may lead to offspring metabolic syndrome (Desai, Babu, and Ross, 2007). LBW newborns often exhibit rapid catch-up growth, culminating in adult obesity. Recent evidence indicates that altered development of orexigenic and anorexigenic central pathways contribute to offspring hyperphagia and obesity. In addition, LBW human or animal offspring exhibit reduced neuronal development of the hippocampus, visual cortex and cerebellar cortex (Lodygensky, Seghier, Warfield, Tolsa, Sizonenko, Lazeyras, and Huppi, 2008;Martinussen, Fischl, Larsson, Skranes, Kulseng, Vangberg, Vik, Brubakk, Haraldseth, and Dale, 2005;Stanley, Fleming, and Morgan, 1991;Thordstein, Sultan, Wennergren, Tornqvist, Lindecrantz, and Kjellmer, 2004). The impaired appetite pathway development, and perhaps other neuronal dysfunction, has been appropriately attributed, in part, to reduced expression of neuronal growth factors in LBW or growth restricted fetuses.
In regards to appetite development, several studies point to a critical role of leptin, both in utero and during the newborn period. Leptin, a primary adult satiety factor, is the obesity (Ob) gene product, a 16 kDa protein synthesized by adipocytes. Leptin is transported into the brain and acts principally in the hypothalamus, activating the JAK-STAT pathway via its long form receptor (ObRb) to suppress food intake (Campfield, Smith, Guisez, Devos, and Burn, 1995).
Although leptin serves as a hypothalamic modulator of appetite/satiety in the adult, it has critical neurotrophic properties during fetal development (Bouret and Simerly, 2004). In mice, ObRb has been identified in embryonic brain as early as e10.5 by RT-PCR and at e11.5 by in situ hybridization (Udagawa, Hatta, Naora, and Otani, 2000) whereas in rodents, protein expression was demonstrated as early as e14 (Matsuda, Yokota, Tsuruo, Murakami, Ishimura, Shima, and Kuroda, 1999). Leptin’s neurotrophic effect is also mediated through extracellular signal regulated kinase (ERK1/2) pathway (Cui, Cai, and Belsham, 2006).
Leptin-deficient (ob/ob) mice have reduced brain weight and lower brain protein and DNA content than wild type mice (Bereiter and Jeanrenaud, 1979). The ob/ob mice have permanently disrupted neuronal appetite-regulatory pathways from the arcuate (ARC) to the paraventricular nucleus (PVN) which can be prevented or reversed by leptin treatment during the neonatal period, though not in adulthood (Bouret, Draper, and Simerly, 2004). In a parallel to ob/ob mice, growth restricted fetuses demonstrate decreased placental leptin mRNA and protein, and reduced cord blood leptin levels (Geary, Pringle, Persaud, Wilshin, Hindmarsh, Rodeck, and Brook, 1999;Hoggard, Haggarty, Thomas, and Lea, 2001) while LBW human, rat, or calf newborns have reduced plasma leptin levels (Blum, Zbinden, Hammon, and Chilliard, 2005;Kotani, Yokota, Kitamura, Matsuda, Naito, and Kuroda, 2004;McMillen, Muhlhausler, Duffield, and Yuen, 2004).
Akin to leptin, insulin gains access to the hypothalamus by means of a saturable receptor-mediated process and diffusion from the median eminence (Schwartz, Figlewicz, Baskin, Woods, and Porte, Jr., 1992). Insulin regulates hypothalamic anorexigenic responses via a membrane-bound tyrosine kinase, which in turn, activates PI3K signaling cascade (Plum, Belgardt, and Bruning, 2006). Although insulin has been considered a peripheral hormone, a series of studies (Schechter and Abboud, 2001;Schechter, Abboud, and Johnson, 1999) have demonstrated the presence of insulin synthesis machinery in the fetal brain. Insulin receptors are widely expressed throughout the brain, suggesting a role in neuronal growth (Chiu, Chen, and Cline, 2008;Chiu and Cline, 2010). Exogenous insulin promotes cell growth and serves as a trophic factor in fetal neuron cell culture (Aizenman and de, 1987). Rat fetal brain cell culture at e16 expresses preproinsulin mRNA and insulin immunoreaction, and stimulates axonal growth in insulin medium (Schechter, Abboud, and Johnson, 1999). Insulin further stimulates ERK1/2 phosphorylation, suggesting that neurite growth may be mediated via this signaling pathway (Schechter, Yanovitch, Abboud, Johnson, III, and Gaskins, 1998).
Our studies have shown that maternal food restriction during rat pregnancy results in LBW newborns with decreased plasma leptin and insulin levels (Desai, Gayle, Babu, and Ross, 2005;Desai, Gayle, Babu, and Ross, 2007). Importantly, LBW offspring exhibit dysregulated hypothalamic leptin and insulin signaling with subsequent impaired anorexigenic responses, increased food intake and obesity (Desai, Gayle, Han, and Ross, 2007). Thus, maternal food restriction that causes LBW programs offspring hyperphagia by impairing hypothalamic neuronal development and altering neuronal signaling pathways in the developing circuits that regulate appetite. As neurons and glia arise from neural stem progenitor cells (NPC), we postulated that a programmed impairment of NPCs may contribute to reduced hypothalamic neural pathway development. The present studies utilized a model in which NPC grown in culture form neurosphere colonies, which can be proliferated into further NPCs or differentiated into neurons and astrocytes, dependent upon the culture medium.
2. Results
2.1 In Vivo NPC Proliferation and Migration
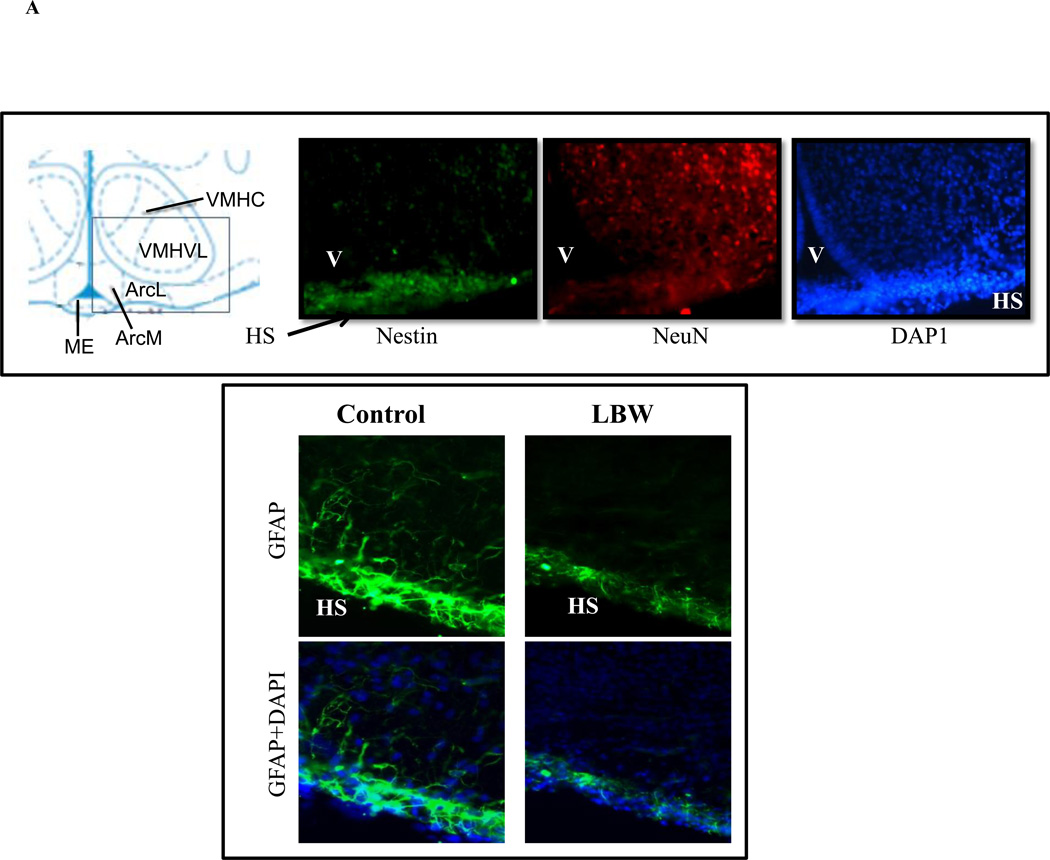
Figure 1A demonstrates the presence of neurons (NeuN) throughout the hypothalamic region. Consistent with the neural stem cell/NPC localization, nestin-positive staining is observed bordering the third ventricular region. Astrocytes labeled with GFAP are detected along the hypothalamic epithelium layer, and this is notably less in LBW newborns.
Figure 1.
A: Evidence of Hypothalamic NPCs and GFAP in 1 Day Newborn
Brain from 1 day newborn was fixed, sectioned (20µm) and stained for markers of NPC (nestin), neuronal (NeuN), astrocyte (GFAP) and nuclei (DAPI). Upper images show evidence of hypothalamic NPCs around third venticular (V) region and lower images show hypothalamic surface (HS) GFAP (astrocyte). Images shown are at ×40 magnification.
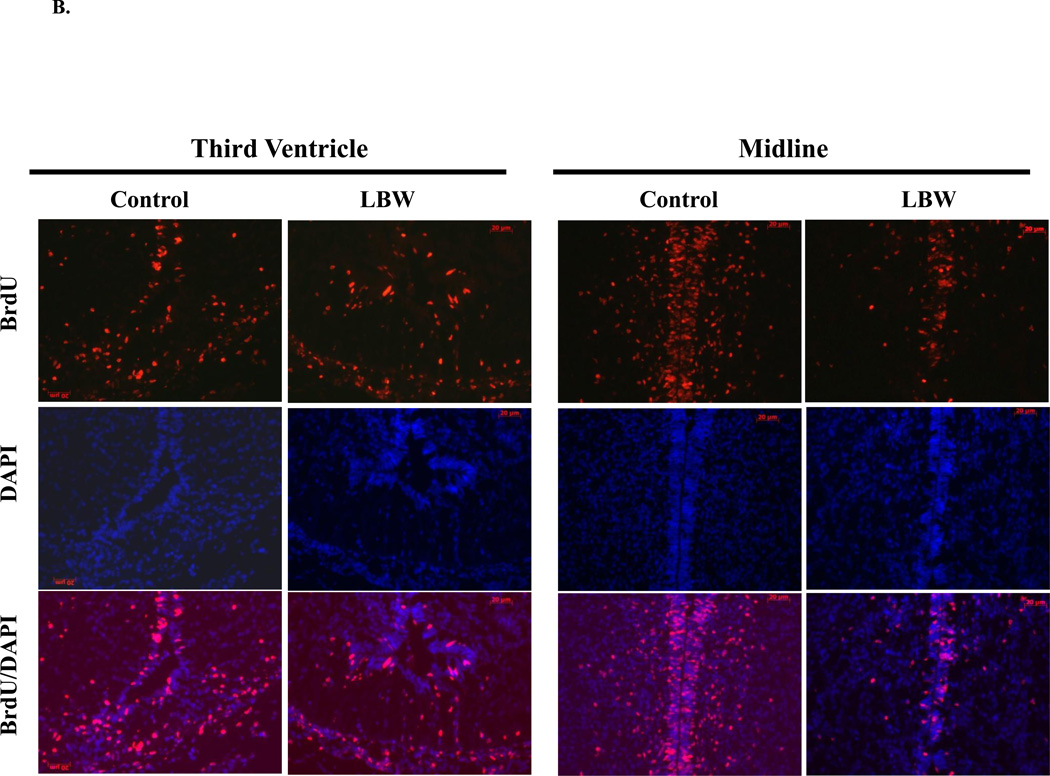
B: In Vivo NPC Proliferation and Migration: Hypothalamic Immunostaining of BrdU Incorporation
Food-restricted (n=3) and control (n=3) pregnant dams were injected with BrdU (50 mg/kg/day, i.p.) from e17–e19. After birth, brains were collected from 1 day old Control ( ) and LBW (
 ) newborn males. The images (×20) show hypothalamic BrdU (cell proliferation) and DAPI (nuclear marker) immunostaining around third venticular (V) region.
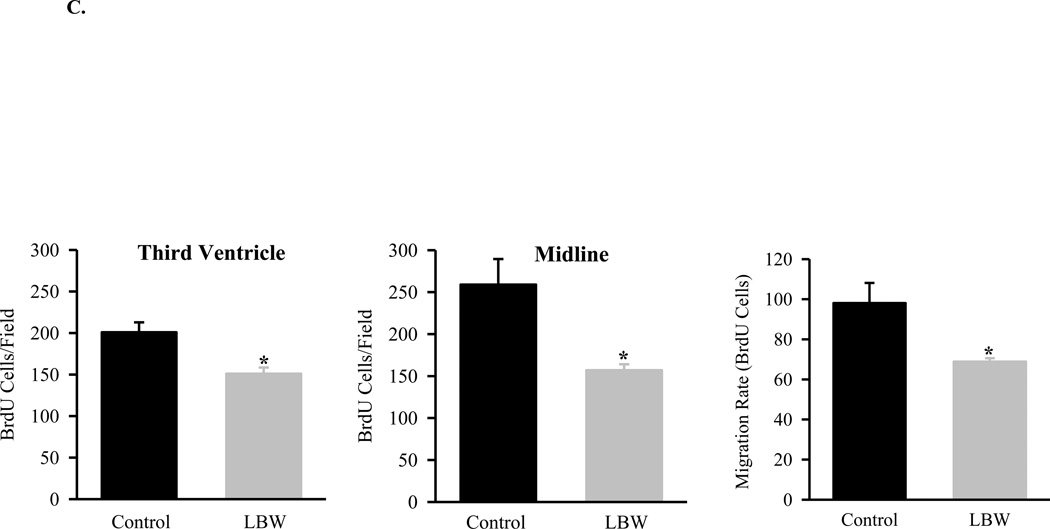
C: In Vivo NPC Proliferation and Migration
Food-restricted (n=3) and control (n=3) pregnant dams were injected with BrdU (50 mg/kg/day, i.p.) from e17–e19. After birth, brains were collected from 1 day old Control ( ) and LBW (
 ) newborn males. Three brains per litter were frozen, and three sections per brain were immunostained. Cell proliferation was determined by counting BrdU positive cells in third ventricle and midline. Migration rate was determined by counting BrdU labeled cells in the area between 30 µm to 100 µm from midline. The average of BrdU-labeled cell numbers of three sections represented one brain and average of three brain cell numbers represented one litter. Values are mean±SE; *P<0.05 vs. Control.
Following BrdU injection, control offspring brains demonstrated incorporation in the peri-third ventricular region, indicating NPC proliferation, and migration of BrdU positive cells away from the midline. LBW brains visually and quantitatively exhibited decreased BrdU staining around the third ventricular region, suggesting reduced NPC proliferation, and reduced NPC migration as determined by the number of BrdU stained cells between 30µm to 100µm from midline (Figures 1B and 1C).
2.2 Basal NPC Growth and Differentiation
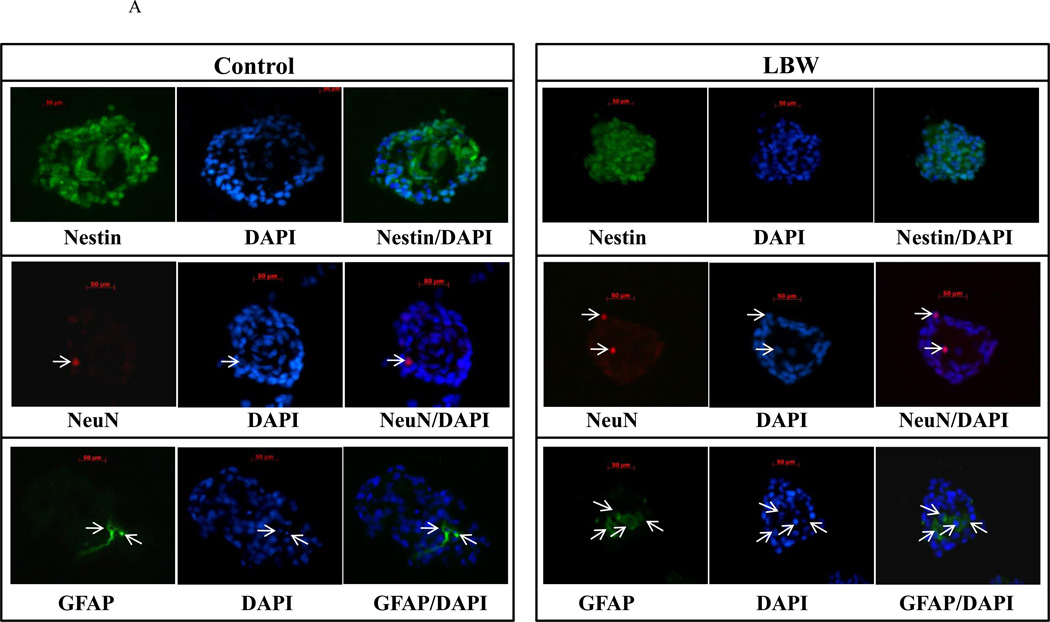
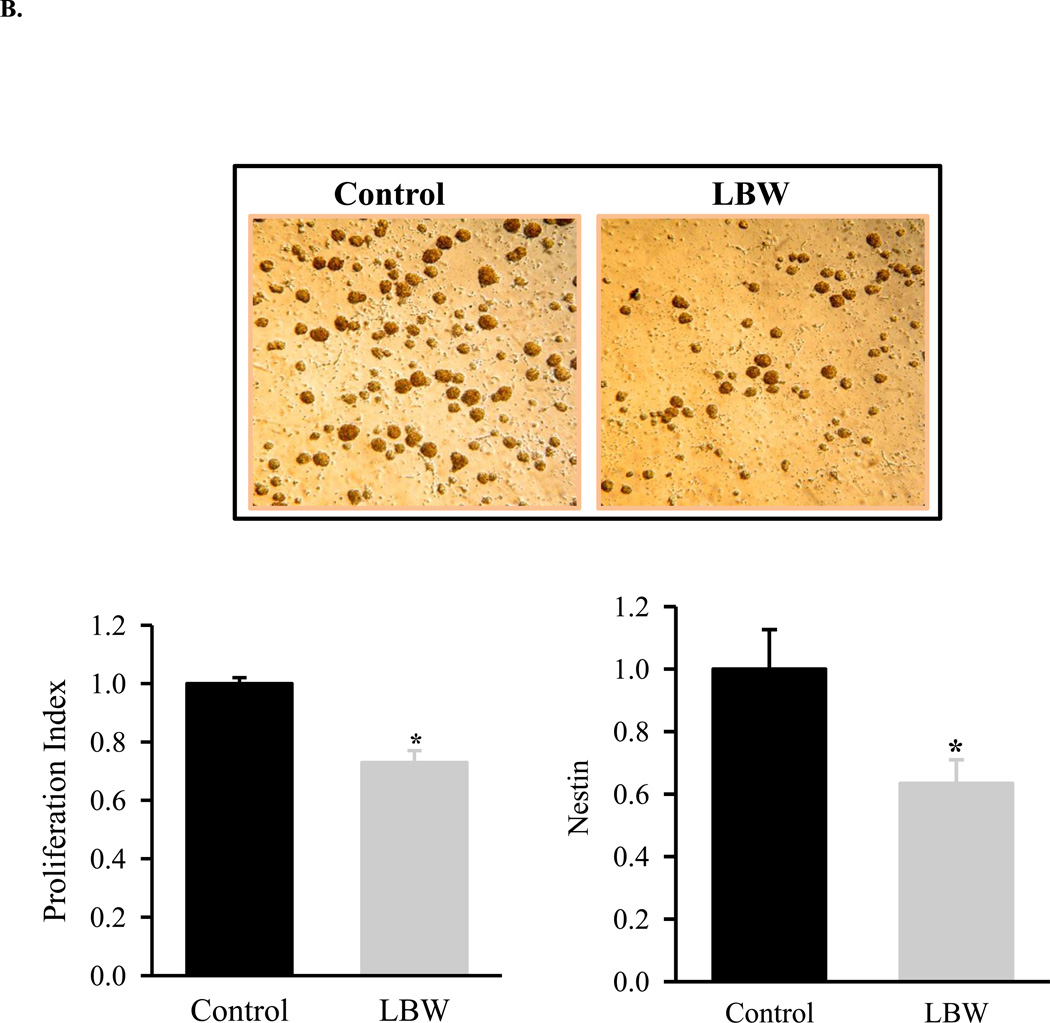
Under complete media (CM) conditions, neurospheres were cultured from both control and LBW hypothalamic regions. When stained for nuclei (DAPI), NPC (nestin), neurons (NeuN) and astrocytes (GFAP), control and LBW neurospheres demonstrated the predominance of NPCs, with minor expression of neurons and astrocytes (Figure 2A). LBW neurospheres were visually smaller than controls (Figures 2A, 2B).
Figure 2.
A: Nestin immunostaining of Neurosphere Sections
Hypothalamic NPC from 1 day old Control ( ) and LBW (
 ) newborn males were cultured in complete media. Neurospheres were sectioned (5 µm) and immunostained with nestin, Neu and GFAP. Images of LBW and Control are shown at 40× magnification.
B: Basal Hypothalamic NPC Proliferation
Hypothalamic NPC from 1 day old Control ( ) and LBW (
 ) newborn males were cultured in complete media. Live images (magnification ×20), basal cell proliferation rate and nestin protein expression of LBW and Control NPCs. Values are fold change (mean ± SE); * P < 0.05 LBW vs. Control.
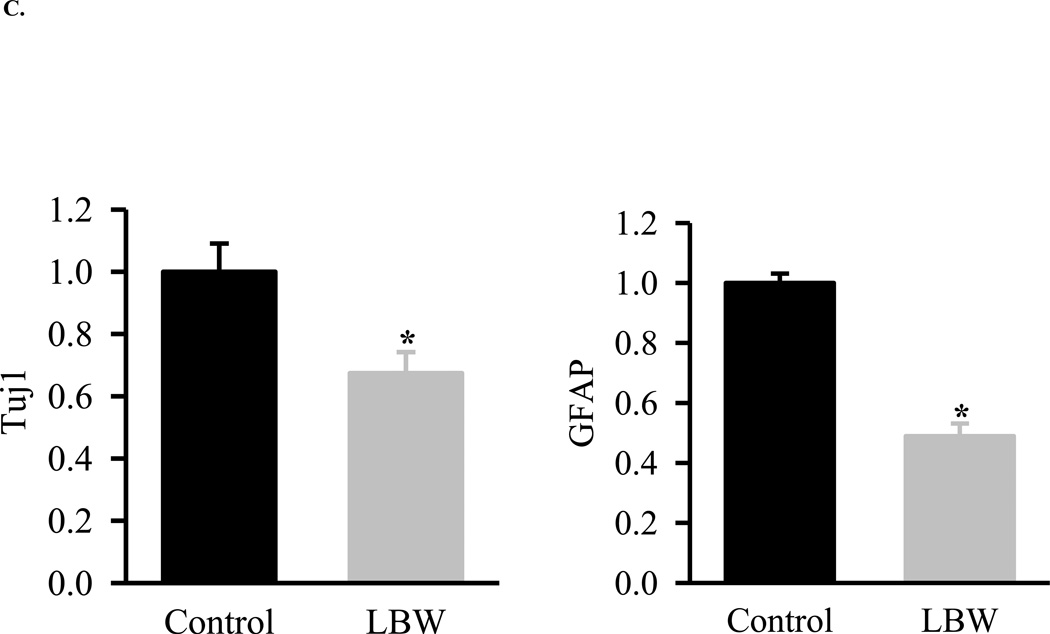
C: Basal Hypothalamic NPC Differentiation
Hypothalamic NPC from 1 Control ( ) and LBW (
 ) newborn males were cultured in differentiating media. NPC were harvested and protein expression of neuronal marker (Tuj1)) and astrocyte marker (GFAP) were determined. Values are fold change (mean ± SE); * P < 0.05 LBW vs. Control.
As compared to controls, the LBW NPC demonstrated markedly reduced basal growth as measured by MTT proliferation assay and by protein expression of nestin, a neuroprogenitor cell marker (Figures 2A and 2B). When placed in differentiation media (DM), both control and LBW neurospheres demonstrated expression of neurons (Tuj1) and astrocytes (GFAP). Consistent with impaired proliferation, LBW NPCs demonstrated markedly reduced differentiation to both neurons and astrocytes (Figure 2C).
2.3 Leptin/Insulin Stimulated NPC Growth and Differentiation
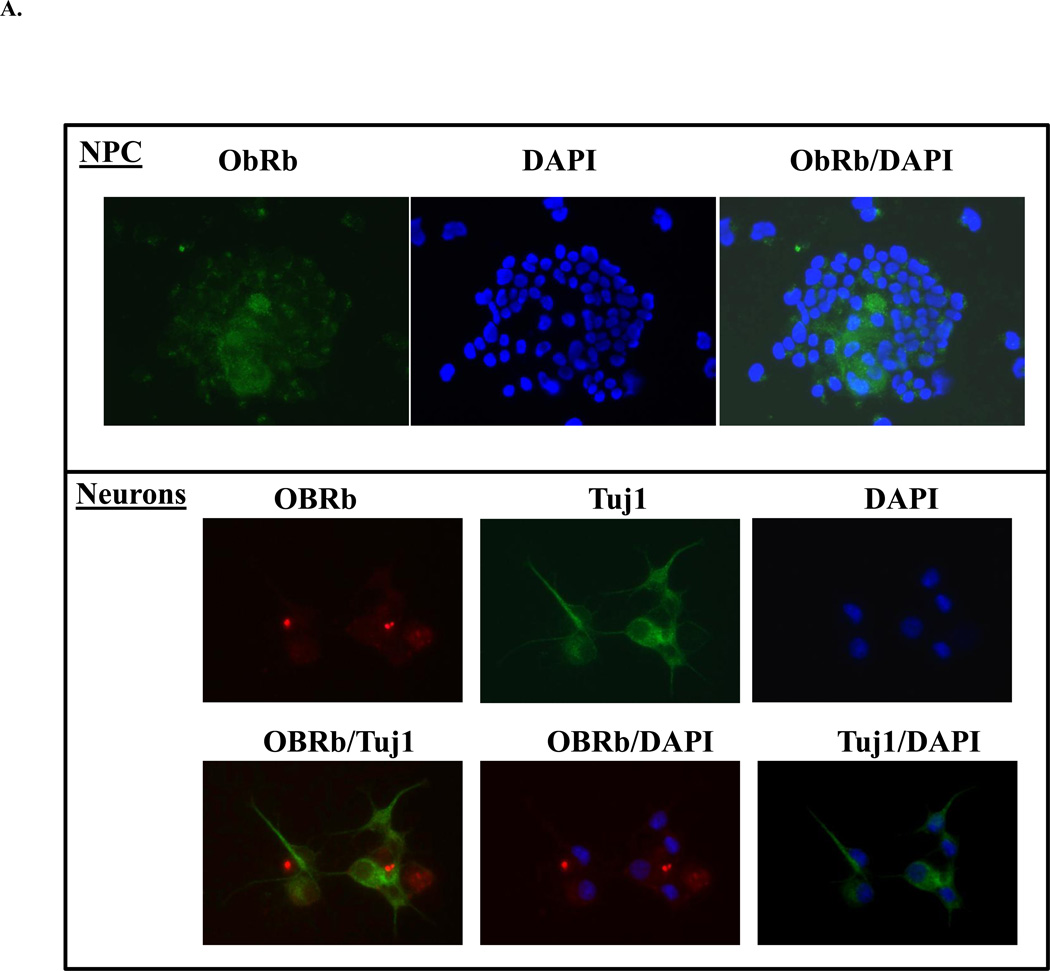
To further explore the potential mechanisms contributing to reduced NPC proliferation and differentiation in LBW newborns, we studied the response of NPC to neurotrophic effects of leptin and insulin. Unlike the acknowledged expression of insulin receptors on NPC, including neurons and astrocytes (Han, Wang, Xiao, Gao, Zhao, Zhang, Chen, Wang, and Dai, 2008;Laron, 2009), the presence of leptin receptor (ObRb) on NPC and neurons (Baskin, Schwartz, Seeley, Woods, Porte, Jr., Breininger, Jonak, Schaefer, Krouse, Burghardt, Campfield, Burn, and Kochan, 1999) is not well-documented. Figure 3A confirms that NPCs and differentiated neuronal cells indeed express ObRb.
Figure 3.
A: Evidence for NPC and Neuronal Leptin Receptor
NPC grown in complete or differentiating media were immunostained for leptin receptor (ObRb), neuronal marker (Tuj1) and nuclear stain (DAPI).
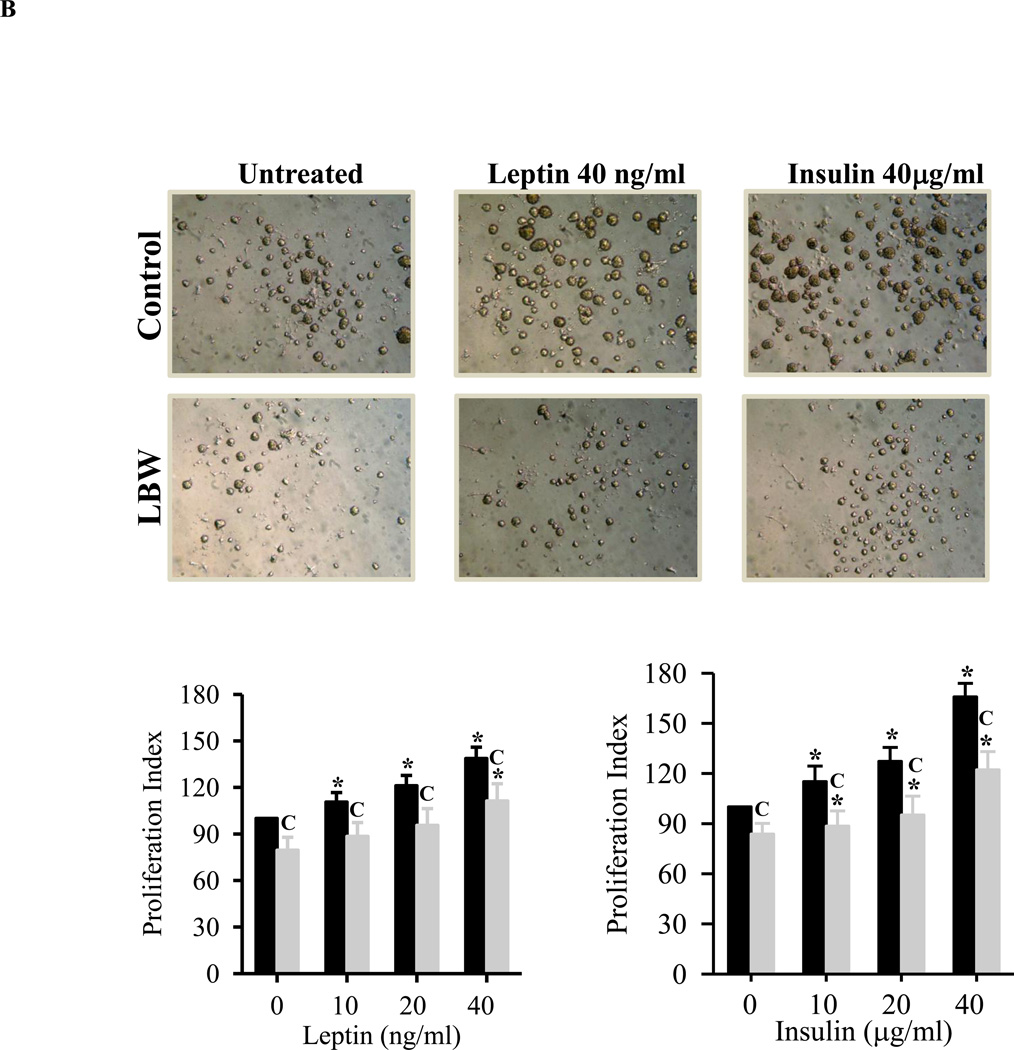
B: Leptin and Insulin Stimulated Hypothalamic NPC Proliferation
Hypothalamic NPC from 1 day old Control ( ) and LBW (
 ) males were cultured in complete media. On second day of seeding, NS were treated with leptin/insulin every 48h for 8 days and cell proliferation rate was determined. Values are percentage of untreated Control (mean ± SE); * P < 0.05 vs. untreated NS; “C” P < 0.05 LBW vs. Control.
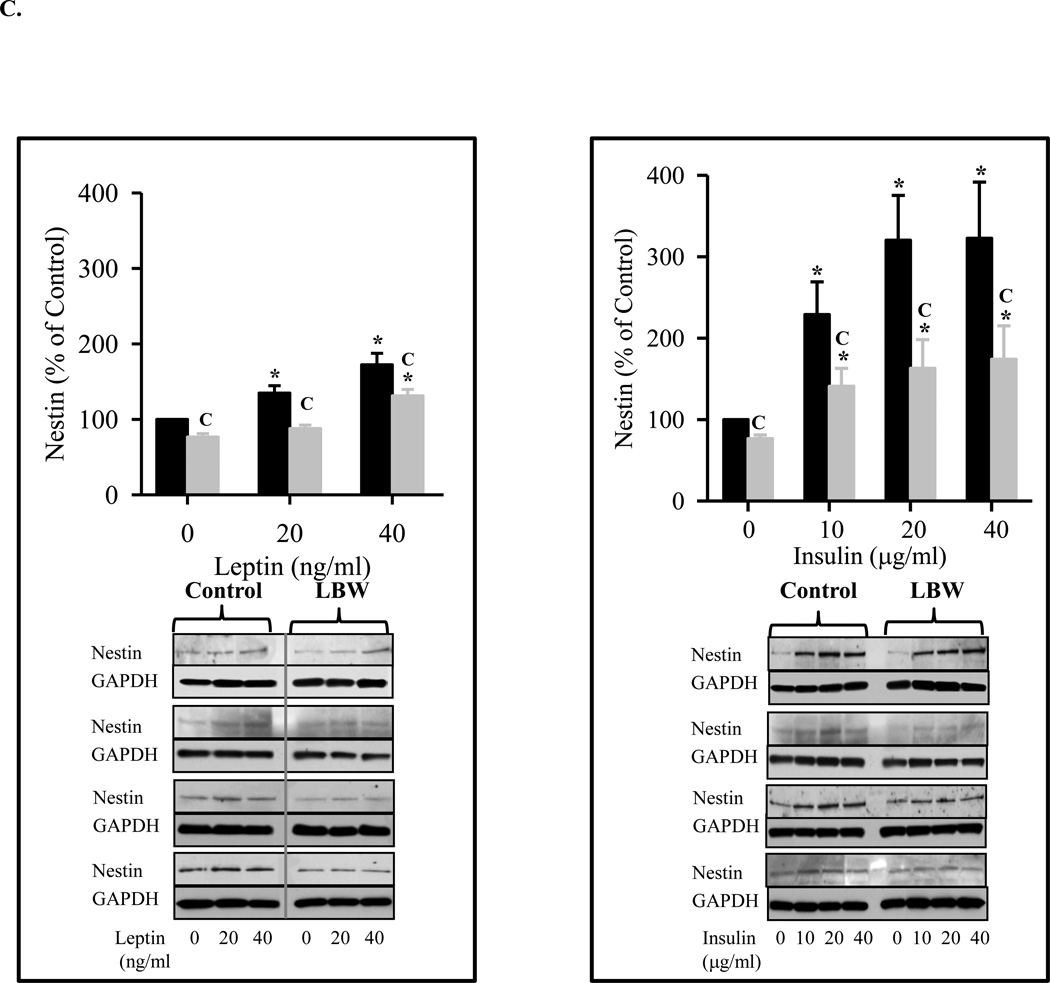
C: Leptin and Insulin Stimulated Hypothalamic Nestin Expression
Hypothalamic NS from 1 day old Control ( ) and LBW (
 ) males were cultured in complete media. On second day of seeding, NS were treated with leptin/insulin every 48h for 8 days. Nestin protein expression (marker of NPC) was determined. Values are mean ± SE; * P < 0.05 vs. untreated NS; “C” P < 0.05 LBW vs. Control.
In CM conditions, leptin and insulin induced dose dependent increases in control NPC proliferation, as measured by both proliferation index (Figure 3B) and nestin expression (Figure 3C). Hypothalamic NPCs from LBW newborns demonstrated reduced leptin and insulin stimulated proliferation (Figure 3B) as compared to controls. Notably, insulin appeared to be significantly more potent as a stimulator of proliferation increasing nestin expression by 300% as compared to less than 200% for leptin at the maximum dosage (Figure 3C).
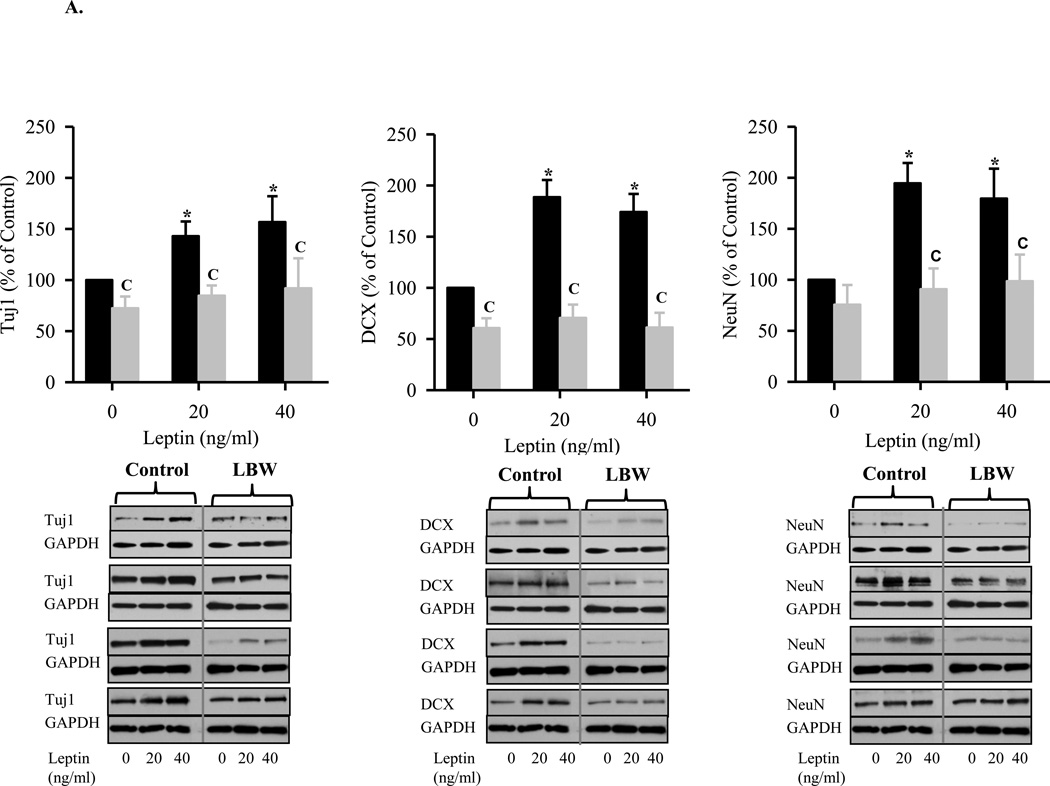
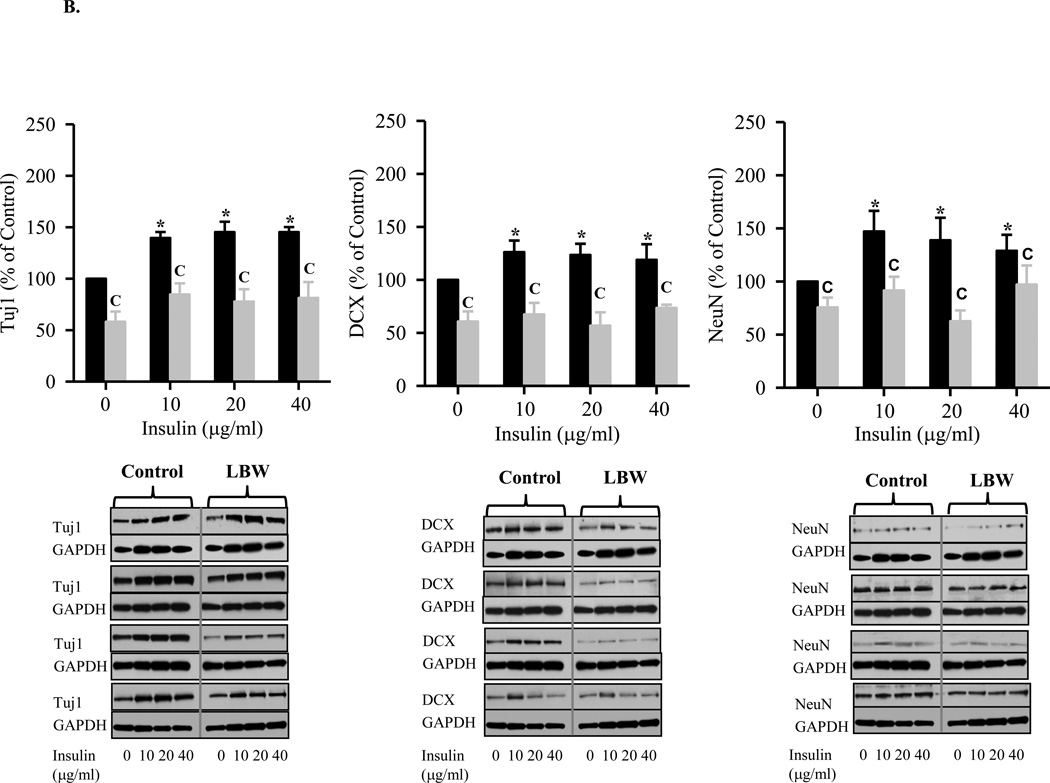
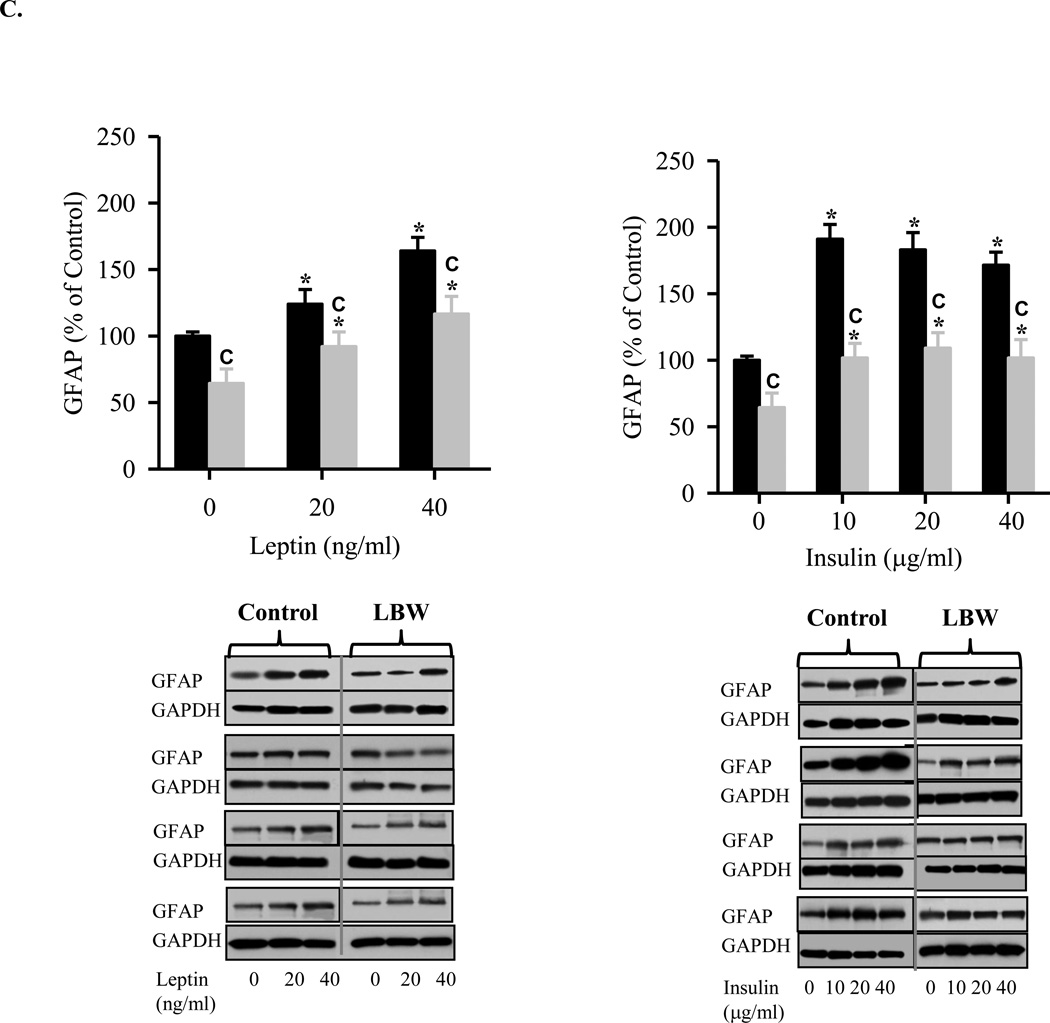
In DM conditions, stimulation of control neurospheres induced significant expression of neurons (Tuj1, DCS, NeuN), with a more potent effect induced by leptin as compared to insulin. In comparison, NPCs grown from LBW newborns demonstrated minimal differentiation to neurons in response to both leptin and insulin (Figures 4A and 4B). Leptin and insulin also induced expression of astrocytes (GFAP) in control neurospheres, with a greater response to insulin than leptin. Consistent with neuronal responses, LBW NPCs also demonstrated reduced leptin and insulin induced astrocyte differentiation as compared to Controls, though the LBW astrocyte differentiation was quantitatively greater than neuronal differentiation (Figure 4C).
Figure 4.
A: Leptin Stimulated Hypothalamic Neuronal Differentiation from NPC
Hypothalamic NPC from 1 day old Control ( ) and LBW (
 ) males were cultured in differentiating media. On second day of seeding, NPC were treated with leptin every 48h for 8 days. NPC were harvested and protein expression of neuronal markers, DCX (immature neurons), and Tuj1 and NeuN (mature neurons) were determined. Values are mean ± SE; * P < 0.05 vs. untreated NPC; “C” P < 0.05 LBW vs. Control.
B: Insulin Stimulated Hypothalamic Neuronal Differentiation from NPC
Hypothalamic NPC from 1 day old Control ( ) and LBW (
 ) males were cultured in differentiating media. On second day of seeding, NPC were treated with insulin every 48h for 8 days. NPC were harvested and protein expression of neuronal markers, DCX (immature neurons), and Tuj1 and NeuN (mature neurons) were determined. Values are mean ± SE; * P < 0.05 vs. untreated NPC; “C” P < 0.05 LBW vs. Control.
C: Leptin and Insulin Stimualted Hypothalamic Astrocyte Differentiation from NPC
Hypothalamic NPC from 1 day Control ( ) and LBW (
 ) males were cultured in differentiating media. On second day of seeding, NPC were treated with leptin or insulin every 48h for 8 days. NPC were harvested and protein expression of astrocyte marker, GFAP, were determined. Values are mean ± SE; * P < 0.05 vs. untreated NPC; “C” P < 0.05 LBW vs. Control.
2.4 Notch Signaling
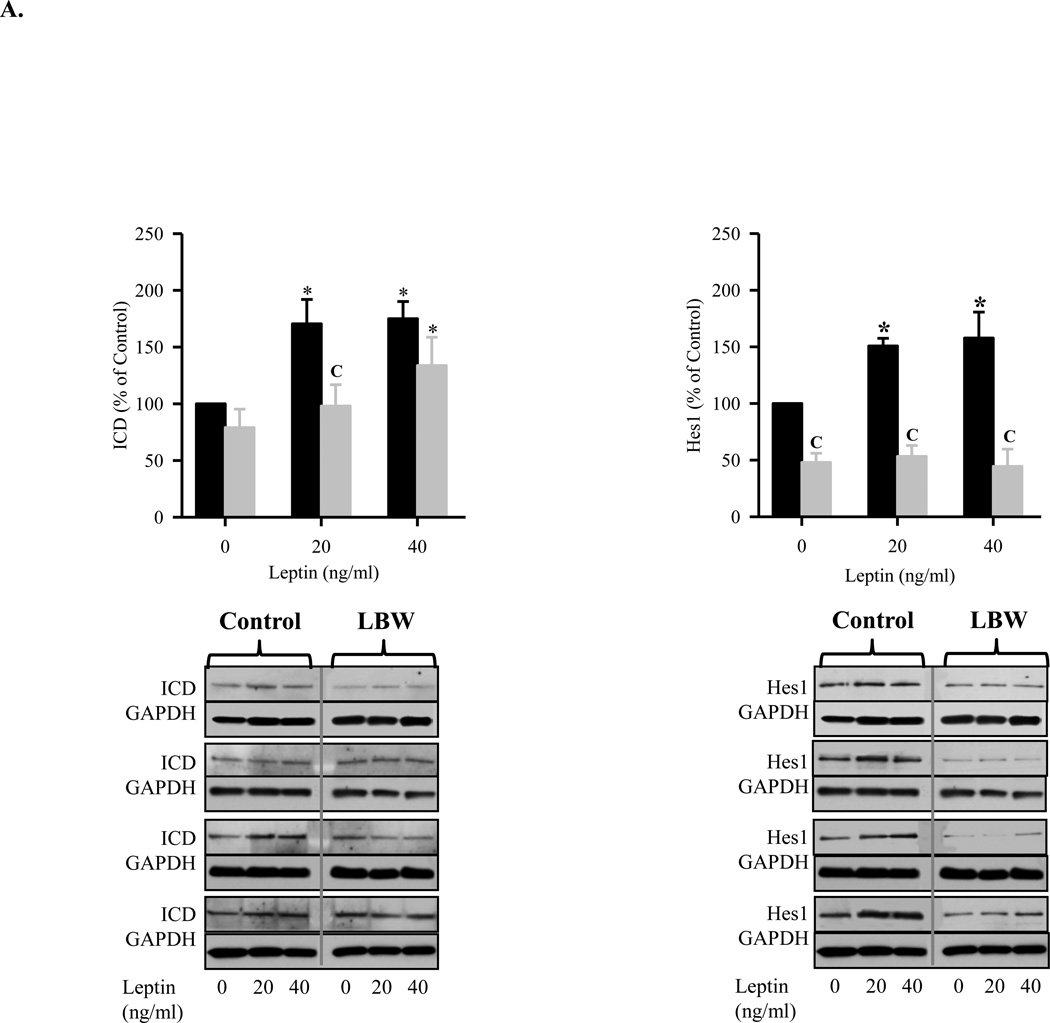
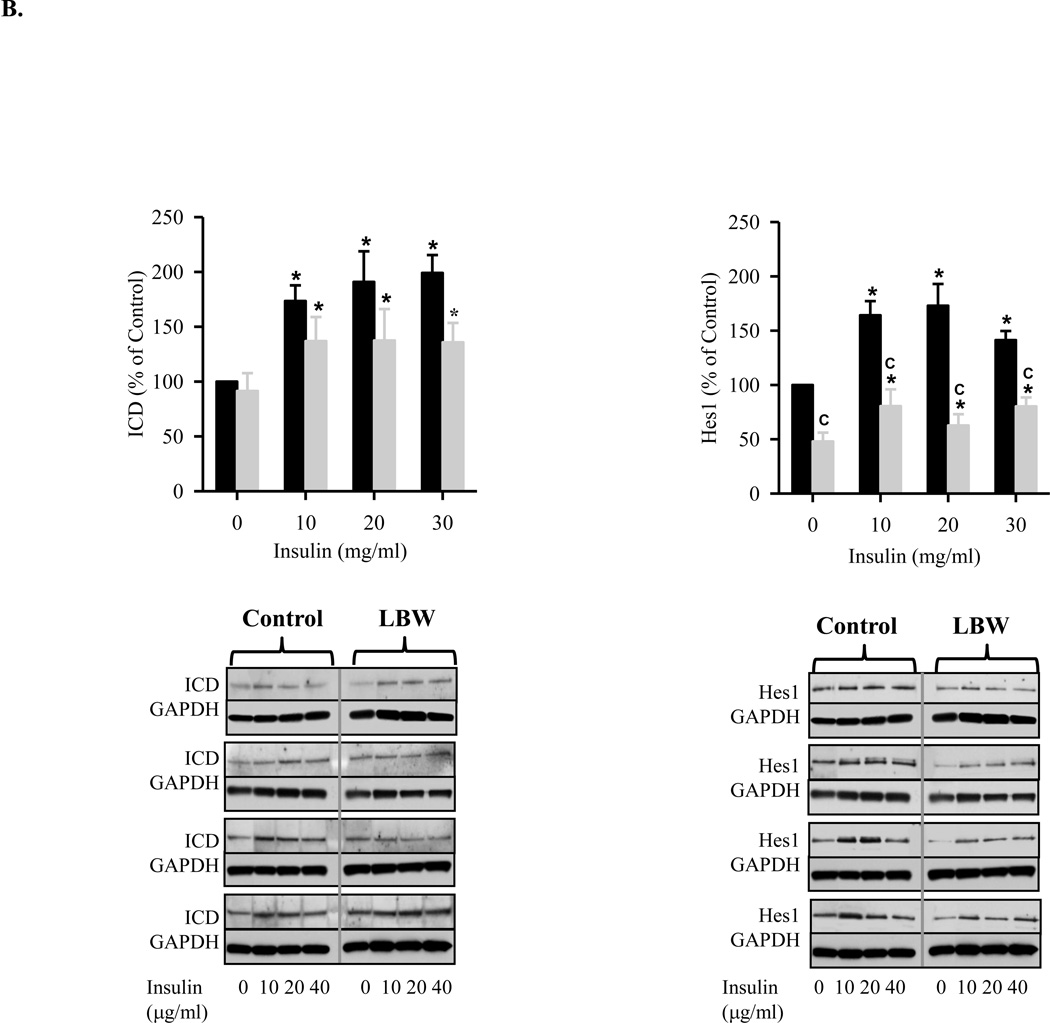
To elucidate the pathways contributing to the reduced proliferation and differentiation responses of LBW NPCs, we examined Notch1 and its downstream target Hes1 which are central factors in NPC proliferation. Under CM conditions, leptin and insulin induced Notch1 signaling in control neurospheres, as evidenced by increased activation of the Notch1 intracellular domain (ICD) and Hes1 expression. In contrast, LBW NPCs demonstrated reduced Notch1 ICD expression to leptin and insulin, and only demonstrated Hes1 expression to insulin treatment (Figures 5A and 5B). There was no stimulation of ICD or Hes1 in differentiation media (data not shown).
Figure 5.
A: Leptin Induced Notch1 Signaling during NPC Proliferation
Hypothalamic NPC from 1 day old Control ( ) and LBW (
 ) males were cultured in complete media. On second day of seeding, NPC were treated with leptin every 48h for 8 days. NPC were harvested and protein expression of Notch1 activation (cleaved Notch1, ICD) and Hes1 were determined. Values are mean ± SE; * P < 0.05 vs. untreated NPC; “C” P < 0.05 LBW vs. Control.
B: Insulin Induced Notch1 Signaling during NPC Proliferation
Hypothalamic NPC from 1 day old Control ( ) and LBW (
 ) males were cultured in complete media. On second day of seeding, NPC were treated with insulin every 48h for 8 days. NPC were harvested and protein expression of Notch1 activation (cleaved Notch1, ICD) and Hes1 were determined. Values are mean ± SE; * P < 0.05 vs. untreated NPC; “C” P < 0.05 LBW vs. Control.
3. Discussion
Greater than 60% of adults in the United States are overweight and more than 1 in 5 are obese, representing a modern health crisis. Obesity and its related diseases are the leading cause of death in western society, yet there are markedly limited effective strategies for prevention or treatment. Our studies and others demonstrate that LBW offspring have a developmentally programmed dysfunction of appetite/satiety pathways and responses. To date, it has been thought that developmental programming acts at the level of differentiated cells following embryogenesis. The data presented here indicate that LBW offspring hypothalamic NPCs are programmed in utero, resulting in impaired cell proliferation and differentiation.
As demonstrated in Figure 1, the hypothalamic region surrounding the third ventricle contained a density of nestin positive neural progenitor cells (NPC) as well as NeuN positive neurons. NPCs from this periventricular region ultimately contribute to a diversity of both hypothalamic and likely extra hypothalamic nuclei. The BrdU staining in control and LBW brains indicates that these NPCs are actively dividing. LBW brains demonstrated reduced BrdU staining in the periventricular region, consistent with an intrinsic reduction in NPC proliferation and/or a reduced NPC population by day 1 of life. Furthermore, the reduced evidence of migration is consistent with either an intrinsic dysfunction in NPC proliferation, neuronal differentiation or migration, and likely contributes to reduced anorexigenic pathways. Although it is possible that less BrdU crossed from the maternal dam to the LBW fetus, the similar intensity of BrdU staining, though reduced cell population, is more consistent with impaired NPC function. We utilized neurospheres generated from whole hypothalamic sections. The findings in the present study would therefore suggest that a diversity of brain stem regions, and perhaps cortical regions, may be impacted by the sequelae of intrauterine growth restriction. Of note, studies have suggested that LBW human newborns have a reduction in neuronal density in regions including the hippocampus (Lodygensky, Seghier, Warfield, Tolsa, Sizonenko, Lazeyras, and Huppi, 2008), visual cortex (Stanley, Fleming, and Morgan, 1991;Thordstein, Sultan, Wennergren, Tornqvist, Lindecrantz, and Kjellmer, 2004), and cortical mass (Martinussen, Fischl, Larsson, Skranes, Kulseng, Vangberg, Vik, Brubakk, Haraldseth, and Dale, 2005;van, 2005). Consequently, the programming of NPC’s may extend to the cortical regions and perhaps explain reductions in IQ reported in growth restricted offspring (de Bie, Oostrom, and Delemarre-van de Waal HA, 2010;Dubois, Benders, Borradori-Tolsa, Cachia, Lazeyras, Ha-Vinh, Sizonenko, Warfield, Mangin, and Huppi, 2008;Tolsa, Zimine, Warfield, Freschi, Sancho, Lazeyras, Hanquinet, Pfizenmaier, and Huppi, 2004).
In control neurospheres, both leptin and insulin induced NPC proliferation. Although MTT responses were similar, insulin induced greater nestin expression than did insulin. The visual perception of reduced neurosphere growth in LBW offspring was confirmed by the significant reduction in both the proliferation index and nestin protein expression. Both leptin and insulin revealed a dose dependent response, though insulin again demonstrated a greater degree of nestin expression. Neurospheres have been demonstrated to contain a mixture of cell types including neuroprogenitor cells and early differentiated neurons and astrocytes. Under basal conditions (Figure 2), both control and LBW neurospheres contain almost exclusively NPCs (nestin). Although we are currently examining the cellular distribution of neurospheres under basal and stimulated conditions, the markedly increased expression of nestin in comparison to the proliferation index induced by insulin versus leptin may suggest that insulin preferentially induces proliferation of NPCs within the neurosphere culture. Despite these responses, leptin induced NS proliferation (DAPI) was significantly greater than that induced by insulin (despite the 1000 fold dose of insulin). Although normal human umbilical cord plasma leptin and insulin average approximately 6ng/ml and 0.5ng/ml, respectively (Tsai, Yu, Hsu, Lee, Chiou, Hsu, Ho, and Chu, 2004), the actual brain concentrations are not known. Unless there was greater cerebral transfer of insulin, these findings would suggest a greater physiologic role for leptin-mediated neurotrophic effects, as compared to insulin.
LBW neurospheres demonstrated a modest increase in proliferation index and nestin expression to both leptin and insulin though with consistently reduced responses as compared to controls. Consistent with the basal nestin staining, we postulate that the LBW neurospheres have reduced the population of NPCs, accounting for the reduced proliferation potential. It is also possible that reduced leptin and insulin receptor expression accounts for reduced proliferation responses in LBW NPCs. Though we have confirmed the evidence for leptin receptor within the neurospheres, current studies are underway quantifying the density of OBRb receptor levels as well as examining the expression and intensity of putative insulin receptors within the neurosphere population and cellular subpopulations.
When placed in differentiation media, control neurospheres demonstrated differentiation into neurons and astrocytes. Under leptin stimulation, control neurospheres demonstrated a near doubling of neuronal markers (TJ1, DCX, NeuN) and a 1.5-fold increase in the astrocyte marker GFAP. In contrast, increasing doses of insulin demonstrated a more modest increase in neuronal markers (approximately 1.5-fold) and a greater increase in the astrocyte GFAP marker (2-fold). These findings suggest that leptin preferentially induces NPC differentiation to neurons, whereas insulin stimulation favors astrocyte differentiation. Consistent with the impaired proliferation responses, LBW neurospheres demonstrated reduced neuronal and astrocyte differentiation. LBW neurospheres showed a negligible increase to both leptin and insulin induced neuronal differentiation, as compared to basal conditions in the differentiation media. In contrast, LBW neurospheres demonstrated significant increases in astrocyte differentiation in response to both leptin and insulin, though to levels significantly below that of control neurospheres. This phenomenon is reminiscent of conditions such as oxidative stress, neurological disease and inflammation, wherein NPCs differentiate preferentially into astrocytes rather than neurons (Monje, Toda, and Palmer, 2003;Rodriguez, Olabarria, Chvatal, and Verkhratsky, 2009;Zipp and Aktas, 2006). It is known that during development, interplay between intrinsic epigenetic status, transcription factors, and environmental cues permit developmental stage-dependent NPC differentiation initially to neuronal and later to astrocyte cell fates (Takizawa, Nakashima, Namihira, Ochiai, Uemura, Yanagisawa, Fujita, Nakao, and Taga, 2001). Notably, this timed cell genesis can be changed by altering signaling pathways, growth factors and methylation status of specific CpG site (Chenn, 2009;Miller and Gauthier, 2007;Namihira, Nakashima, and Taga, 2004). For instance, upregulation of JAK-STAT or Notch signaling, addition of growth factors, deletion of the maintenance DNA methyltransferase I (Dnmt1) or activation of histone deacetylase (HDAC) activity promote astrocyte differentiation in the developing brain (Fan, Martinowich, Chin, He, Fouse, Hutnick, Hattori, Ge, Shen, Wu, ten, Shuai, and Sun, 2005;Hsieh, Nakashima, Kuwabara, Mejia, and Gage, 2004;Qian, Shen, Goderie, He, Capela, Davis, and Temple, 2000;Rajan and McKay, 1998).
Notch represents an extracellular receptor involved in cell-cell signaling. With activation of notch via cellular signals (e.g., delta, jagged), NPC differentiation pathways are restricted and proliferation is maintained through activation of Hes1. The increase in Notch1 and Hes1 in control neurospheres in response to leptin and insulin is consistent with stimulation of NPC neurospheres into daughter cells in CM conditions. Neither control nor LBW demonstrated Notch1 or Hes1 expression in DM conditions, as Notch is activated under proliferation not differentiation responses. The reduced Notch1 and Hes1 expression in LBW as compared to control neurosphere, under both basal and stimulated conditions, suggests a reduced progenitor cell population or reduced cell density within the neurosphere. Whereas day 1 control neurospheres maintain NPC proliferative potential, increasing the population of NPCs, LBW neurospheres may be prone to differentiation and thus a reduced progenitor pool. This may be a “SIRT1-mediated mechanism. SIRT1 is an NAD+ dependent HDAC which is sensor for intracellular energy and redox status, and importantly been shown to regulate the fate of NPCs. Activation of SIRT1, under conditions of energy deprivation or oxidative conditions, suppresses proliferation of NPCs and directs their differentiation towards the astroglial lineage at the expense of the neuronal lineage. This has been demonstrated both in vitro and in vivo where a pro-oxidative induced SIRT1 expression in NPC promotes astrogenesis and inhibits neurogenesis through the interaction of SIRT1 with Hes1 with subsequent repression of Mash1 (Monje, Toda, and Palmer, 2003).
In summary, day 1 control offspring demonstrate significant expression of NPCs in the peri-third ventricular region and marked proliferation and differentiation in response to leptin and insulin. Evidence of BrdU staining and cell migration indicates continued brainstem and likely cortical development during the postnatal period. LBW offspring had impaired in vivo evidence of NPC division and migration, and reduced in vitro evidence of proliferation and differentiation to neurons and astrocytes, under basal and stimulated conditions. Prior studies have indicated that newborn leptin administration to ob/ob mice normalizes anorexigenic pathway development, and corrects the obesity phenotype of LBW rats. However, these present studies suggest that the brain architecture of LBW offspring is altered at birth, and has reduced physiologic or therapeutic responsiveness to neurotrophic factors. Previous studies have demonstrated that the ARC is largely undeveloped and undifferentiated in newborn male and female rats. Specifically, there is a significant population of immature neuronal cell profiles in still evident in 2–5 day old rat pups and there is progressive maturation of ARC through first two weeks of postnatal life (Walsh and Brawer, 1979;Walsh, Brawer, and Naftolin, 1982). Although select neural pathways or phenotypic expression may be normalized by postnatal therapy, these findings indicate that sequelae of brain maldevelopment may extend to a diversity of cortical and brainstem systems. As recent studies confirm the continued presence of NPCs in adult brains, perhaps serving a neuroprotective or neurorepair function, a reduced NPC pool may have further implications for susceptibility to adult neurodegenerative diseases.
4. Experimental Procedure
4.1 Maternal Rat Diets
Studies were approved by the Animal Research Committee of the Los Angeles Biomedical Research Institute at Harbor-UCLA (LABioMed), and were in accordance with the American Association for Accreditation of Laboratory Care (AALC), and National Institutes of Health (NIH) guidelines. The rat model utilized for maternal food restriction during pregnancy and lactation has been previously described (Desai, Gayle, Babu, and Ross, 2005). Briefly, first time pregnant Sprague Dawley rats (Charles River Laboratories, Hollister, California) were housed in a facility with constant temperature and humidity and controlled 12:12 hour light/dark cycle. From day 10 of pregnancy to term (21 days), rats were provided either an ad libitum (Control) diet of standard laboratory chow (protein 23%, fat 4.5%, metabolizable energy 3030 kcal/kg; Lab Diet 5001, Brentwood, MO), or a 50% food restricted diet determined by quantification of normal intake in ad libitum fed rats, to create low birth weight offspring (LBW).
4.2 In Vivo Hypothalamic Cell Proliferation and Migration
To examine in vivo NPC proliferation and migration, food-restricted (n=3) and control (n=3) pregnant dams were injected with 5-bromo-2'-deoxyuridine (BrdU; 50mg/kg/day, i.p.) from e17–e19. After birth, brains were collected from 1 day old LBW and Control newborn males. Three brains per litter were frozen, and three sections per brain were immunostained and photomicrographs were captured at ×20 magnification. Image PRO software (version 5.1) was used to determine cell proliferation by counting BrdU positive cells in third ventricle and midline per field. Migration rate was determined by counting BrdU labeled cells in the area between 30 mm to 100mm from midline. The average of BrdU-labeled cell numbers of three sections represented one brain and average of three brain cell numbers represented one litter.
4.3 Culture of hypothalamic neural stem/progenitor cells
Brains were collected from 1 day old LBW and control male newborns. For culture studies, 4 litters per group were studied and 4 brains per litter were pooled. Following Hank’s solution wash, the brains were transferred to DMEM/F12 medium and hypothalamuses were dissected, minced and digested by 0.1% Trypsin-EDTA (Invitrogen) plus 0.01 DNase (Sigma) for 30 min at 37°C in CO2 incubator. Trypsin was inactivated with 10% FBS and the digested cells were filtered and centrifuged at 1000 rpm for 5 min. Cells were re-suspended (~ 5×10⁴ cells/ml) in complete medium [CM; Neurobasal™ Medium containing 1% anti-anti (Invitrogen), 2% B27 (GIBCO, Cat#17504-044), 20ng/ml FGF2 (Sigma), 20ng/ml EGF (Sigma), 1µg/ml Heparin (Lylli), and 2.5µg/ml L-glutamine (Invitrogen)] and were cultured for 8–9 days in CO2 incubator. FGF2 (10ng/ml) was added to the culture every 3 days and the neurospheres at this stage represented passage 0 (P0). P0 neurospheres were collected and disassociated into single cells by 1% trypsin-EDTA digestion at 37°C for 5 min. The disassociated cells were centrifuged at 1000 rpm for 5 min, reseeded in CM at same cell density as above and represented P1 cells. P1 cells were used for treatment (see below) or after 8 days underwent further trypsinization and reseeding, representing P2 cells. All experiments on NPC proliferation and differentiation utilized only P1 and P2 cells.
4.4 Induction of NPC differentiation
For the induction of differentiation, the disassociated cells were re-suspended in differentiating medium (DM; in absence of FGF2, EGF and heparin) and seeded in culture dishes pre-coated with 0.01% poly-L-lysine (Sigma).
4.5 Leptin and Insulin Treatments
For studying leptin and insulin effects, the neurospheres or NPC cultured in both CM and DM and treated with leptin (0, 20 and 40ng/ml; Sigma) or insulin (0, 10, 20, 40µg/ml) every 48h for 8 days. Subsequently the cells were harvested for cell proliferation or protein expression analysis.
4.6 NPC proliferation (MTT assay)
NPC proliferation rate was determined by the MTT (3-(4,5-dimethylthiazol-2-yl)-diphenyl tetrazolium bromide; Sigma) colorimetric assay (Mosmann, 1983). Disassociated neurosphere cells in CM were seeded in 24 well-culture plate (1ml/well). At day 8 of culture, 50µl MTT solution (5mg/ml in BPS) was added to each cell culture well and incubated for 1h at 37°C in CO2 incubator. The cultured cells were harvested and MTT reaction product formazan was extracted with 300µl acidic isopropanol (isopropanol in 0.04N HCl). The optical density of the formazan solution was measured on an ELISA plate reader (VICTOR™ 1420 Multilabel Counter) at 570nm. Cell proliferating index was expressed as value of OD 570nm.
4.7 Western blot
The disassociated neurosphere cells in CM or DM were seeded in 6 well plates. At day 8 of culture, the cells were harvested and dissolved in RIPA solution (Cell Signaling) with protease inhibitor cocktail (Thermo). Following a brief sonication, the cell lysates were pre-cleared by centrifugation (10,000 rpm) for 10 min at 4°C. Protein content of the cell lysates were determined by BAC™ Protein Assay Kit (Thermo). Then the cell lysates were denatured in XT sample buffer (Bio-Rad) with XT Reducing Agent (Bio-Rad) at 100°C for 3 min and 20µg proteins for each sample were used to run Critrion™ XT Precast Gel. After electro-transferring the fragmented proteins to Nitrocellulose Membrane (Bio-Rad), the blots were blocked for 1h in Tris buffered saline containing 0.05% Tween20 (TBST) and 5% fat-free milk powder. Primary antibodies were diluted in blocking solution and incubated with blots overnight at 4°C. The blots were then washed in TBST for 10 min (3 cycle washes) and incubated for 1h in solution of secondary antibodies conjugated horseradish peroxidase (HRP) at room temperature. The secondary antibody included anti-mouse IgG-HRP (1:2000, cell Signaling), anti-rabbit IgG-HRP (1: 2000, Cell Signaling) and anti-goat IgG-HRP (1:1000, Santa Cruz). Following 3 cycle washes by TBST, blots were applied with SuperSignal West Pico Chemiluminescence Substrate (Pierce) to produce chemiluminescence which was visualized by exposing blots to X-ray film (HyBlot CL™ Autoradiography Film, Denville Scientific Inc). Densities of target protein bands were determined by densitometer (Alpha digidoc 1000, Alpha Innotech Corporation, CA, USA) and normalized against GAPDH loading controls. The primary antibodies used included: rabbit anti-nestin (1:5000, Sigma), rabbit anti-Tuj1 (1:5000, Sigma), mouse anti-NeuN (1:1000, Millipore), goat anti-DCX (1:1000, Santa Cruz), rabbit anti-GFAP (1:10000, DAKO), rabbit anti-cleaved Notch1 (1:1000, Cell Signaling), rabbit anti-Hes1 (1:1000, Santa Cruz) and mouse anti-GAPDH (1:10000, Chemicon).
Many of the NPC makers, (e.g., nestin, Sox2, Musashi, CD133) are not specifically expressed by NPC. As nestin has been the commonly used NPC marker, we elected to use the same in the present study (Dahlstrand, Lardelli, and Lendahl, 1995;Lendahl, Zimmerman, and McKay, 1990).
4.8 Immunostaining
For hypothalamic staining, newborn brains were harvested at day 1 of age, fixed in 4% paraformaldehyde overnight and transferred to 30% sucrose for one day. Coronal cryostat sections of hypothalamus (25µm thickness) were cut and kept in PBS for immunohistochemistry. The sections were washed (saline buffered by Tris-HCl with 0.1% Triton 100 (TBST)) and incubated in 10% donkey serum in TBST for 1h to block non-specific antibody biding. Subsequently, the sections were incubated in rabbit anti-nestin solution (Sigma, 1:500, in TBST) at 4°C overnight, washed with TBST and incubated in donkey anti rabbit IgG conjugated with Alexa 488 for 1h at room temperature. The sections were mounted using Vectashield mounting medium with DAPI (VECTOR, Cat# H1500) and images obtained using fluorescent microscope (Zeiss, Axioskop 40).
For staining cultured cells, disassociated neurosphere cells in CM or DM were seeded in 24 well plates in which round cover glasses (Fisher, catalogue number: 12-545-84 18CIR-1D) were pre-placed. At day 8 of cell culture, the cells were fixed in 4% paraformaldehyde in PBS for 30 min and stained as described as above. Primary antibodies included: rabbit anti-nestin (Sigma), rabbit anti-Tuj1 (1:500, Sigma), rabbit anti-GFAP (1:500, DAKO), mouse anti-NeuN (1:250, Millpore). Secondary antibodies were donkey anti-rabbit IgG-Alexa 488 (1:250) or donkey anti-mouse IgG-Alexa 568 (1:250).
4.9 Data analysis
Differences between Control and LBW were analyzed by ANOVA with Dunnett’s posthoc test. For protein expression, data was normalized to GAPDH and presented as percentage of Control. For leptin or insulin treatments, values were compared between LBW and Controls and to their respective non-treated cells. Values are expressed as mean ± SE.
Research Highlights.
At 1 day of age, low birth weight (LBW) rat newborns demonstrate:
Evidence of neuronal progenitor cells (NPC) in the peri-third ventricular region.
Reduced in vivo proliferation and migration of NPC as evident by BrdU staining.
Reduced basal proliferation and differentiation of hypothalamic NPCs cultures.
Reduced leptin/insulin stimulated hypothalamic NPC proliferation/differentiation.
Downregulated Notch1/Hes1 mediated mechanism for reduced NPC proliferation.
Acknowledgements
We acknowledge Linda Day and Stacy Behare for their technical assistance. This work was supported by National Institute of Health Grants R01HD054751, R01DK081756 and R03HD060241.
Footnotes
Publisher's Disclaimer: This is a PDF file of an unedited manuscript that has been accepted for publication. As a service to our customers we are providing this early version of the manuscript. The manuscript will undergo copyediting, typesetting, and review of the resulting proof before it is published in its final citable form. Please note that during the production process errors may be discovered which could affect the content, and all legal disclaimers that apply to the journal pertain.
Disclosure of Interests: All authors have significantly contributed to the article. Dr. Desai was primarily responsible for the concept, study design, data analysis, supervision of technical analysis and manuscript writing. Dr. Li had undertaken the laboratory analysis. Dr. Ross had been responsible for overseeing all aspects of the study, including manuscript writing. All authors declare that no competing interests exist and have approved this final article.
Contributor Information
Mina Desai, Email: mdesai@obgyn.humc.edu.
Tie Li, Email: tieli@obgyn.humc.edu.
Michael G. Ross, Email: mikeross@ucla.edu.
Reference List
- 1.Desai M, Hales CN. Role of fetal and infant growth in programming metabolism in later life. Biol. Rev. Camb. Philos. Soc. 1997;72:329–348. doi: 10.1017/s0006323196005026. [DOI] [PubMed] [Google Scholar]
- 2.Ravelli AC, Der Meulen JH, Osmond C, Barker DJ, Bleker OP. Obesity at the age of 50 y in men and women exposed to famine prenatally. Am. J. Clin. Nutr. 1999;70:811–816. doi: 10.1093/ajcn/70.5.811. [DOI] [PubMed] [Google Scholar]
- 3.Ravelli GP, Stein ZA, Susser MW. Obesity in young men after famine exposure in utero and early infancy. N. Engl. J. Med. 1976;295:349–353. doi: 10.1056/NEJM197608122950701. [DOI] [PubMed] [Google Scholar]
- 4.Desai M, Babu J, Ross MG. Programmed metabolic syndrome: prenatal undernutrition and postweaning overnutrition. Am J Physiol Regul Integr Comp Physiol. 2007;293:R2306–R2314. doi: 10.1152/ajpregu.00783.2006. [DOI] [PubMed] [Google Scholar]
- 5.Lodygensky GA, Seghier ML, Warfield SK, Tolsa CB, Sizonenko S, Lazeyras F, Huppi PS. Intrauterine growth restriction affects the preterm infant's hippocampus. Pediatr. Res. 2008;63:438–443. doi: 10.1203/PDR.0b013e318165c005. [DOI] [PubMed] [Google Scholar]
- 6.Stanley OH, Fleming PJ, Morgan MH. Development of visual evoked potentials following intrauterine growth retardation. Early Hum. Dev. 1991;27:79–91. doi: 10.1016/0378-3782(91)90029-3. [DOI] [PubMed] [Google Scholar]
- 7.Thordstein CM, Sultan BL, Wennergren MM, Tornqvist E, Lindecrantz KG, Kjellmer I. Visual evoked potentials in disproportionately growth-retarded human neonates. Pediatr. Neurol. 2004;30:262–270. doi: 10.1016/j.pediatrneurol.2003.10.002. [DOI] [PubMed] [Google Scholar]
- 8.Martinussen M, Fischl B, Larsson HB, Skranes J, Kulseng S, Vangberg TR, Vik T, Brubakk AM, Haraldseth O, Dale AM. Cerebral cortex thickness in 15-year-old adolescents with low birth weight measured by an automated MRI-based method. Brain. 2005;128:2588–2596. doi: 10.1093/brain/awh610. [DOI] [PubMed] [Google Scholar]
- 9.Campfield LA, Smith FJ, Guisez Y, Devos R, Burn P. Recombinant mouse OB protein: evidence for a peripheral signal linking adiposity and central neural networks. Science. 1995;269:546–549. doi: 10.1126/science.7624778. [DOI] [PubMed] [Google Scholar]
- 10.Bouret SG, Simerly RB. Minireview: Leptin and development of hypothalamic feeding circuits. Endocrinol. 2004;145:2621–2626. doi: 10.1210/en.2004-0231. [DOI] [PubMed] [Google Scholar]
- 11.Udagawa J, Hatta T, Naora H, Otani H. Expression of the long form of leptin receptor (Ob-Rb) mRNA in the brain of mouse embryos and newborn mice. Brain Res. 2000;868:251–258. doi: 10.1016/s0006-8993(00)02334-9. [DOI] [PubMed] [Google Scholar]
- 12.Matsuda J, Yokota I, Tsuruo Y, Murakami T, Ishimura K, Shima K, Kuroda Y. Development changes in long-form leptin receptor expression and localization in rat brain. Endocrinol. 1999;140:5233–5238. doi: 10.1210/endo.140.11.7152. [DOI] [PubMed] [Google Scholar]
- 13.Cui H, Cai F, Belsham DD. Leptin signaling in neurotensin neurons involves STAT, MAP kinases ERK1/2, and p38 through c-Fos and ATF1. FASEB J. 2006;20:2654–2656. doi: 10.1096/fj.06-5989fje. [DOI] [PubMed] [Google Scholar]
- 14.Bereiter DA, Jeanrenaud B. Altered neuroanatomical organization in the central nervous system of the genetically obese (ob/ob) mouse. Brain Res. 1979;165:249–260. doi: 10.1016/0006-8993(79)90557-2. [DOI] [PubMed] [Google Scholar]
- 15.Bouret SG, Draper SJ, Simerly RB. Trophic action of leptin on hypothalamic neurons that regulate feeding. Science. 2004;304:108–110. doi: 10.1126/science.1095004. [DOI] [PubMed] [Google Scholar]
- 16.Geary M, Pringle PJ, Persaud M, Wilshin J, Hindmarsh PC, Rodeck CH, Brook CG. Leptin concentrations in maternal serum and cord blood: relationship to maternal anthropometry and fetal growth. Br. J. Obstet. Gynaecol. 1999;106:1054–1060. doi: 10.1111/j.1471-0528.1999.tb08113.x. [DOI] [PubMed] [Google Scholar]
- 17.Hoggard N, Haggarty P, Thomas L, Lea RG. Leptin expression in placental and fetal tissues: does leptin have a functional role? Biochem. Soc. Trans. 2001;29:57–63. doi: 10.1042/0300-5127:0290057. [DOI] [PubMed] [Google Scholar]
- 18.Blum JW, Zbinden Y, Hammon HM, Chilliard Y. Plasma leptin status in young calves: effects of pre-term birth, age, glucocorticoid status, suckling, and feeding with an automatic feeder or by bucket. Domest. Anim Endocrinol. 2005;28:119–133. doi: 10.1016/j.domaniend.2004.06.011. [DOI] [PubMed] [Google Scholar]
- 19.Kotani Y, Yokota I, Kitamura S, Matsuda J, Naito E, Kuroda Y. Plasma adiponectin levels in newborns are higher than those in adults and positively correlated with birth weight. Clin. Endocrinol. (Oxf) 2004;61:418–423. doi: 10.1111/j.1365-2265.2004.02041.x. [DOI] [PubMed] [Google Scholar]
- 20.McMillen IC, Muhlhausler BS, Duffield JA, Yuen BS. Prenatal programming of postnatal obesity: fetal nutrition and the regulation of leptin synthesis and secretion before birth. Proc. Nutr. Soc. 2004;63:405–412. doi: 10.1079/pns2004370. [DOI] [PubMed] [Google Scholar]
- 21.Schwartz MW, Figlewicz DP, Baskin DG, Woods SC, Porte D., Jr Insulin in the brain: a hormonal regulator of energy balance. Endocr. Rev. 1992;13:387–414. doi: 10.1210/edrv-13-3-387. [DOI] [PubMed] [Google Scholar]
- 22.Plum L, Belgardt BF, Bruning JC. Central insulin action in energy and glucose homeostasis. J Clin. Invest. 2006;116:1761–1766. doi: 10.1172/JCI29063. [DOI] [PMC free article] [PubMed] [Google Scholar]
- 23.Schechter R, Abboud M, Johnson G. Brain endogenous insulin effects on neurite growth within fetal rat neuron cell cultures. Brain Res. Dev. Brain Res. 1999;116:159–167. doi: 10.1016/s0165-3806(99)00089-9. [DOI] [PubMed] [Google Scholar]
- 24.Schechter R, Abboud M. Neuronal synthesized insulin roles on neural differentiation within fetal rat neuron cell cultures. Brain Res. Dev. Brain Res. 2001;127:41–49. doi: 10.1016/s0165-3806(01)00110-9. [DOI] [PubMed] [Google Scholar]
- 25.Chiu SL, Cline HT. Insulin receptor signaling in the development of neuronal structure and function. Neural Dev. 2010;5:7. doi: 10.1186/1749-8104-5-7. [DOI] [PMC free article] [PubMed] [Google Scholar]
- 26.Chiu SL, Chen CM, Cline HT. Insulin receptor signaling regulates synapse number, dendritic plasticity, and circuit function in vivo. Neuron. 2008;58:708–719. doi: 10.1016/j.neuron.2008.04.014. [DOI] [PMC free article] [PubMed] [Google Scholar]
- 27.Aizenman Y, de VJ. Brain neurons develop in a serum and glial free environment: effects of transferrin, insulin, insulin-like growth factor-I and thyroid hormone on neuronal survival, growth and differentiation. Brain Res. 1987;406:32–42. doi: 10.1016/0006-8993(87)90766-9. [DOI] [PubMed] [Google Scholar]
- 28.Schechter R, Yanovitch T, Abboud M, Johnson G, III, Gaskins J. Effects of brain endogenous insulin on neurofilament and MAPK in fetal rat neuron cell cultures. Brain Res. 1998;808:270–278. doi: 10.1016/s0006-8993(98)00842-7. [DOI] [PubMed] [Google Scholar]
- 29.Desai M, Gayle D, Babu J, Ross MG. Programmed obesity in intrauterine growth-restricted newborns: modulation by newborn nutrition. Am J Physiol Regul Integr Comp Physiol. 2005;288:R91–R96. doi: 10.1152/ajpregu.00340.2004. [DOI] [PubMed] [Google Scholar]
- 30.Desai M, Gayle D, Babu J, Ross MG. The timing of nutrient restriction during rat pregnancy/lactation alters metabolic syndrome phenotype. Am J Obstet Gynecol. 2007;196:555–557. doi: 10.1016/j.ajog.2006.11.036. [DOI] [PMC free article] [PubMed] [Google Scholar]
- 31.Desai M, Gayle D, Han G, Ross MG. Programmed hyperphagia due to reduced anorexigenic mechanisms in intrauterine growth-restricted offspring. Reprod. Sci. 2007;14:329–337. doi: 10.1177/1933719107303983. [DOI] [PubMed] [Google Scholar]
- 32.Laron Z. Insulin and the brain. Arch. Physiol Biochem. 2009;115:112–116. doi: 10.1080/13813450902949012. [DOI] [PubMed] [Google Scholar]
- 33.Han J, Wang B, Xiao Z, Gao Y, Zhao Y, Zhang J, Chen B, Wang X, Dai J. Mammalian target of rapamycin (mTOR) is involved in the neuronal differentiation of neural progenitors induced by insulin. Mol. Cell Neurosci. 2008;39:118–124. doi: 10.1016/j.mcn.2008.06.003. [DOI] [PubMed] [Google Scholar]
- 34.Baskin DG, Schwartz MW, Seeley RJ, Woods SC, Porte D, Jr, Breininger JF, Jonak Z, Schaefer J, Krouse M, Burghardt C, Campfield LA, Burn P, Kochan JP. Leptin receptor long-form splice-variant protein expression in neuron cell bodies of the brain and co-localization with neuropeptide Y mRNA in the arcuate nucleus. J. Histochem. Cytochem. 1999;47:353–362. doi: 10.1177/002215549904700309. [DOI] [PubMed] [Google Scholar]
- 35.van WA. Neurodevelopmental consequences of being born SGA. Pediatr. Endocrinol. Rev. 2005;2:372–377. [PubMed] [Google Scholar]
- 36.de Bie HM, Oostrom KJ, Delemarre-van de Waal HA. Brain development, intelligence and cognitive outcome in children born small for gestational age. Horm. Res. Paediatr. 2010;73:6–14. doi: 10.1159/000271911. [DOI] [PubMed] [Google Scholar]
- 37.Dubois J, Benders M, Borradori-Tolsa C, Cachia A, Lazeyras F, Ha-Vinh LR, Sizonenko SV, Warfield SK, Mangin JF, Huppi PS. Primary cortical folding in the human newborn: an early marker of later functional development. Brain. 2008;131:2028–2041. doi: 10.1093/brain/awn137. [DOI] [PMC free article] [PubMed] [Google Scholar]
- 38.Tolsa CB, Zimine S, Warfield SK, Freschi M, Sancho RA, Lazeyras F, Hanquinet S, Pfizenmaier M, Huppi PS. Early alteration of structural and functional brain development in premature infants born with intrauterine growth restriction. Pediatr. Res. 2004;56:132–138. doi: 10.1203/01.PDR.0000128983.54614.7E. [DOI] [PubMed] [Google Scholar]
- 39.Tsai PJ, Yu CH, Hsu SP, Lee YH, Chiou CH, Hsu YW, Ho SC, Chu CH. Cord plasma concentrations of adiponectin and leptin in healthy term neonates: positive correlation with birthweight and neonatal adiposity. Clin. Endocrinol. (Oxf) 2004;61:88–93. doi: 10.1111/j.1365-2265.2004.02057.x. [DOI] [PubMed] [Google Scholar]
- 40.Rodriguez JJ, Olabarria M, Chvatal A, Verkhratsky A. Astroglia in dementia and Alzheimer's disease. Cell Death. Differ. 2009;16:378–385. doi: 10.1038/cdd.2008.172. [DOI] [PubMed] [Google Scholar]
- 41.Zipp F, Aktas O. The brain as a target of inflammation: common pathways link inflammatory and neurodegenerative diseases. Trends Neurosci. 2006;29:518–527. doi: 10.1016/j.tins.2006.07.006. [DOI] [PubMed] [Google Scholar]
- 42.Monje ML, Toda H, Palmer TD. Inflammatory blockade restores adult hippocampal neurogenesis. Science. 2003;302:1760–1765. doi: 10.1126/science.1088417. [DOI] [PubMed] [Google Scholar]
- 43.Takizawa T, Nakashima K, Namihira M, Ochiai W, Uemura A, Yanagisawa M, Fujita N, Nakao M, Taga T. DNA methylation is a critical cell-intrinsic determinant of astrocyte differentiation in the fetal brain. Dev. Cell. 2001;1:749–758. doi: 10.1016/s1534-5807(01)00101-0. [DOI] [PubMed] [Google Scholar]
- 44.Namihira M, Nakashima K, Taga T. Developmental stage dependent regulation of DNA methylation and chromatin modification in a immature astrocyte specific gene promoter. FEBS Lett. 2004;572:184–188. doi: 10.1016/j.febslet.2004.07.029. [DOI] [PubMed] [Google Scholar]
- 45.Chenn A. A top-NOTCH way to make astrocytes. Dev. Cell. 2009;16:158–159. doi: 10.1016/j.devcel.2009.01.019. [DOI] [PubMed] [Google Scholar]
- 46.Miller FD, Gauthier AS. Timing is everything: making neurons versus glia in the developing cortex. Neuron. 2007;54:357–369. doi: 10.1016/j.neuron.2007.04.019. [DOI] [PubMed] [Google Scholar]
- 47.Rajan P, McKay RD. Multiple routes to astrocytic differentiation in the CNS. J Neurosci. 1998;18:3620–3629. doi: 10.1523/JNEUROSCI.18-10-03620.1998. [DOI] [PMC free article] [PubMed] [Google Scholar]
- 48.Qian X, Shen Q, Goderie SK, He W, Capela A, Davis AA, Temple S. Timing of CNS cell generation: a programmed sequence of neuron and glial cell production from isolated murine cortical stem cells. Neuron. 2000;28:69–80. doi: 10.1016/s0896-6273(00)00086-6. [DOI] [PubMed] [Google Scholar]
- 49.Fan G, Martinowich K, Chin MH, He F, Fouse SD, Hutnick L, Hattori D, Ge W, Shen Y, Wu H, ten HJ, Shuai K, Sun YE. DNA methylation controls the timing of astrogliogenesis through regulation of JAK-STAT signaling. Development. 2005;132:3345–3356. doi: 10.1242/dev.01912. [DOI] [PubMed] [Google Scholar]
- 50.Hsieh J, Nakashima K, Kuwabara T, Mejia E, Gage FH. Histone deacetylase inhibition-mediated neuronal differentiation of multipotent adult neural progenitor cells. Proc. Natl Acad. Sci U. S. A. 2004;101:16659–16664. doi: 10.1073/pnas.0407643101. [DOI] [PMC free article] [PubMed] [Google Scholar]
- 51.Walsh RJ, Brawer JR, Naftolin F. Early postnatal development of the arcuate nucleus in normal and sexually reversed male and female rats. J Anat. 1982;135:733–744. [PMC free article] [PubMed] [Google Scholar]
- 52.Walsh RJ, Brawer JR. Cytology of the arcuate nucleus in newborn male and female rats. J Anat. 1979;128:121–133. [PMC free article] [PubMed] [Google Scholar]
- 53.Mosmann T. Rapid colorimetric assay for cellular growth and survival: application to proliferation and cytotoxicity assays. J. Immunol. Methods. 1983;65:55–63. doi: 10.1016/0022-1759(83)90303-4. [DOI] [PubMed] [Google Scholar]
- 54.Lendahl U, Zimmerman LB, McKay RD. CNS stem cells express a new class of intermediate filament protein. Cell. 1990;60:585–595. doi: 10.1016/0092-8674(90)90662-x. [DOI] [PubMed] [Google Scholar]
- 55.Dahlstrand J, Lardelli M, Lendahl U. Nestin mRNA expression correlates with the central nervous system progenitor cell state in many, but not all, regions of developing central nervous system. Brain Res. Dev. Brain Res. 1995;84:109–129. doi: 10.1016/0165-3806(94)00162-s. [DOI] [PubMed] [Google Scholar]


