

Abstract
Study Design
Cost-effectiveness analysis of a randomized plus observational cohort trial
Objective
Analyze cost-effectiveness of Spine Patient Outcomes Research Trial (SPORT) data over 4 years comparing surgery with non-operative care for three common diagnoses: spinal stenosis (SpS), degenerative spondylolisthesis (DS) and intervertebral disc herniation (IDH).
Summary of Background Data
Spine surgery rates continue to rise in the US, but the safety and economic value of these procedures remains uncertain.
Methods
Patients with image-confirmed diagnoses were followed in randomized or observational cohorts with data on resource use, productivity and EQ-5D health state values measured at 6 weeks, 3, 6, 12, 24, 36, and 48 months. For each diagnosis, cost per quality-adjusted life year (QALY) gained in 2004 US Dollars was estimated for surgery relative to non-operative care using a societal perspective, with costs and QALYs discounted at 3% per year.
Results
Surgery was performed initially or during the 4-year follow-up among 414/634 (65.3%) SPS, 391/601 (65.1%) DS and 789/1192 (66.2%) IDH patients. Surgery improved health, with persistent QALY differences observed through 4 years (SpS QALY gain 0.22; 95%CI: 0.15, 0.34; DS QALY gain 0.34, 95%CI: 0.30, 0.47; IDH QALY gain 0.34, 95%CI: 0.31, 0.38). Costs per QALY gained decreased for SPS from $77,600 at 2 years to $59,400 (95%CI: $37,059, $125,162) at 4 years; for DS from $115,600 to $64,300/QALY (95%CI: $32,864, $83,117); and for IDH from $34,355 to $20,600/QALY (95%CI: $4,539, $33,088).
Conclusions
Comparative effectiveness evidence for clearly defined diagnostic groups from SPORT shows good value for surgery compared with non-operative care over 4-years.
INTRODUCTION
The American Recovery and Reinvestment Act of 2009 mandated a $1.1 billion investment in comparative effectiveness research, defined by the Institute of Medicine (IOM) as “…the generation and synthesis of evidence that compares the benefits and harms of alternative methods to prevent, diagnose, treat, and monitor a clinical condition….”1 While the role of economic endpoints in comparative effectiveness research remains controversial, the marked growth in complex spine surgery and accompanying expenditures in the US population over the past two decades has prompted concern regarding spine surgery’s value for both individual patients and society. 2-4 Begun more than a decade ago, the Spine Patient Outcomes Research Trial (SPORT) addresses IOM priority conditions and addresses the comparative effectiveness of surgery and non-operative care using clinical and economic endpoints from both randomized and observational study cohorts.5-10
SPORT was designed with a secondary objective of assessing the cost-effectiveness of spine surgery for patients with back and/leg symptoms for three specific clinical conditions. The economic value of surgery relative to non-operative care at 2 years compared favorably with many health interventions.11,12 However, surgery for degenerative spondylolisthesis was somewhat more costly than for patients with stenosis alone (mean cost per QALY gained of $115,600 vs. $77,600 for stenosis alone). This was largely due to differences in the initial cost of surgery for patients with degenerative spondylolisthesis; these patients often undergo fusion surgery, which is more costly than decompressive laminectomy alone (the most common procedure in patients who have only stenosis). In contrast to prior literature, we hypothesized that surgery’s value–in these well-defined conditions–would improve over time. This would occur if health gains remained durable, especially if patients receiving surgery had lower ongoing health care costs relative to non-operatively treated patients, taking into account the offsetting cost of repeat surgeries, which would have the potential to diminish surgery’s cost-effectiveness. In this paper we report SPORT 4-year cost-effectiveness outcomes for all patient groups.
MATERIALS AND METHODS
Details of SPORT’s design and conduct are provided elsewhere.6-8,10,13 In brief, participants enrolled in either a randomized or observational cohort from 13 participating U.S. multidisciplinary spine practices in 11 states between March 2000 and March 2005 and were followed for outcomes over 4 years. Participants in the randomized group were assigned treatment while those in the observational cohort chose their treatment. Eligible participants were aged 18 and older with well-defined symptoms, physical findings and imaging-confirmed diagnosis of spinal stenosis either alone (SpS) or associated with degenerative spondylolisthesis (DS), or diagnosis of intervertebral disc herniation (IDH). Non-operative treatments were ‘usual care’ determined by patients’ and physicians’ choice. For SpS, the protocol surgical intervention was a standard posterior laminectomy. For DS, the protocol surgery was the same procedure with or without bilateral single-level fusion with or without instrumentation. For IDH, the protocol surgical intervention was a standard open discectomy. An independent Data Safety and Monitoring Board oversaw the study and a human subjects committee approved the protocol at each institution.
Treatment Effectiveness
For the cost-effectiveness analysis, treatment effectiveness was measured using quality-adjusted life years (QALYs), which account for both length and quality of life,14 by weighting time spent in each health state by a health state value. Health state values–reflecting societal health preferences on a scale where a year in best imaginable health is assigned a value of 1 and death is assigned a value of 0–were obtained using the EuroQol EQ-5D instrument with US scoring15,16. Secondary analyses used the SF-6D (UK scoring) health state values derived from SF-36 health status instrument. 17 Mean health states were estimated at baseline, 6 weeks, 3, 6, 12, 24, 36 and 48 months.
Treatment Cost
Participants were given health care diaries to assist them in tracking both medical resource use and time lost from work and other activities. Total costs included direct medical costs (based on patient-reported utilization; limited to spine-related services except for physician visits and hospitalizations) and indirect costs (based on patient-reported time away from work and/or usual activities due to spine-related problem(s)). Information was collected from patients with questionnaires at each time point, using either a 6-week (at 6 weeks and 3 months) or 1-month recall period. Reports of hospitalizations, surgeries and device use were not confined to a recall window.
Direct medical costs included any emergency room or outpatient visits (surgeons, chiropractors, other physicians, physical therapists, acupuncturists, or other health care providers) and spine-related diagnostic tests (radiograph, computed tomography scan, magnetic resonance imaging); electromyography; injections; devices (e.g., braces, canes, walkers); medications; and rehabilitation or nursing home days. To estimate direct medical costs, unit costs were assigned to each visit, test, and procedure based on 2004 Medicare national allowable payment amounts18 (see Appendix Table), with medication costs based on 2004 average wholesale prices.19 For each participant, medical resource use was multiplied by unit costs to estimate total direct medical cost at each time point. All costs are expressed in 2004 US dollars.
Surgery costs depended on the procedure performed and occurrence of complications, which in turn determined the diagnosis-related group. The observed 2004 Medicare mean total diagnosis-related group payment was used to reflect hospital-related surgery costs. Surgeon costs were based on 2004 Medicare allowable amounts using the resource-based relative value scale.20 Anesthesiology costs were estimated using operative time. For hospitalizations not associated with a spine surgery, costs were based on the diagnosis-related group using mean observed 2004 Medicare payments.
At each follow-up the impact of spine-related problems on productivity was assessed. Participants were asked to report missed work days if employed outside of the home and missed homemaking days if housekeeping was designated as the primary work activity. Use of unpaid caregivers for spine-related problems (including spousal care giving) was also obtained. Costs were estimated using the standard human capital approach21 by multiplying the change in hours worked by the gross-of-tax wage rate based on self-reported wages at study entry. Costs for missed days of housekeeping and unpaid caregivers were valued based on average wages plus non-health benefits for individuals ages 35 and older.22-24
Statistical Analysis
Data were analyzed separately by disease group according to treatment received for the pooled SPORT randomized and observational cohorts, using longitudinal regression models fitted with generalized estimating equations 25,26. Separate models were fit for EQ-5D and for 30-day costs measured at each follow-up time point after surgery or the beginning of non-operative therapy. If a visit was missing, all other available visits for that patient were included in the analysis.
The treatment indicator (surgery versus non-operative care) was a time-dependent covariate, allowing for variable surgery times. Following surgery, outcomes were assigned to the surgical group, with follow-up times measured from the date of surgery. To adjust for potential confounding in each model and the possible effects of missing data, baseline variables associated with missing data or treatment received were included as covariates. All models included a fixed effect for center. To account for correlations among repeated measurements for individuals, including observations before and after surgery, the longitudinal regression models were fit with PROC GENMOD (SAS version 9.1 Windows XP Pro, Cary, NC), specifying a compound symmetry assumption for the working covariance matrix.
Cost-Effectiveness Analysis
The primary cost-effectiveness endpoint was the incremental cost-effectiveness ratio (ICER) estimated as cost per QALY gained for surgery relative to non-operative treatment. For stenosis patients with or without degenerative spondylolisthesis we report cost per QALY gained by surgery type relative to non-operative care.
Mean total costs and QALYs from baseline to 4 years were estimated for each diagnosis and treatment group using a 3% annualized discount rate for both endpoints. Discounting is used to weigh near-term costs and health more heavily in the analysis than those occurring in the future. A time-weighted average was used to estimate the difference in QALYs between the surgical and non-operative treatments based on adjusted mean differences in EQ-5D estimated from longitudinal regression models at each follow-up. QALY differences between treatment groups were estimated using a common baseline EQ-5D value. For costs, mean differences were based on adjusted mean costs summed across time points for each treatment group. To estimate a confidence interval for the cost per QALY gained, a bootstrap method was applied using 1000 samples taken with replacement from the original sample with the individual as the unit of observation.
Sensitivity analyses of analytic assumptions included: restricting analyses to the randomized or observational cohort; limiting costs to direct medical costs only to facilitate comparison with Reference Case recommendations of the US Panel on Cost-effectiveness in Health and Medicine; increasing surgery costs to 70% of the amount billed to Medicare; using SF-6D to estimate effectiveness; and accounting for observed mortality. We also performed a sensitivity analysis in which patients who received surgery more than 2 years after study entry were censored from the analysis at the time of surgery.
RESULTS
A total of 414/ 634 (65.3%) SpS, 391/601 (65.1%) DS and 789/1,192 (66.2%) IDH participants underwent surgery. Examination of baseline participant characteristics by treatment received over 4 years (Table 1) shows that surgically treated patients, in general, were younger; more frequently perceived that their problem was getting worse; and had a definite surgical preference compared with non-operatively treated participants.
Table 1.
Baseline participant characteristics by disease group and treatment received within 4 years.
| Spinal Stenosis | Degenerative Spondylolisthesis | Intervertebral Disc Herniation | |||||||
|---|---|---|---|---|---|---|---|---|---|
| Surgery (n=414) | Non-Operative (n=220) | p-value | Surgery (n=391) | Non-Operative (n=210) | p-value | Surgery (n=789) | Non-Operative (n=403) | p-value | |
| Mean Age (SD) | 63.8 (12.2) | 66.1 (10.5) | 0.02 | 64.7 (10.1) | 68.6(10.2) | <0.001 | 40.6 (10.8) | 43.9 (12.2) | <0.001 |
| Women, n (%) | 159 (38%) | 90 (41%) | 0.60 | 269 (69%) | 143 (68%) | 0.93 | 340 (43%) | 167 (41%) | 0.63 |
| Ethnicity: Not Hispanic, n (%) | 397 (96%) | 208 (95%) | 0.57 | 382 (98%) | 205 (98%) | 0.82 | 753 (95%) | 384 (95%) | 0.98 |
| Race - White, n (%) | 349 (84%) | 184 (84%) | 0.92 | 334 (85%) | 172 (82%) | 0.31 | 695 (88%) | 338 (84%) | 0.05 |
| At least some college education, n (%) | 260 (63%) | 141 (64%) | 0.82 | 264 (68%) | 136 (65%) | 0.55 | 572 (72%) | 312 (77%) | 0.08 |
| Annual income < $50,000, n (%) | 84 (20%) | 38 (17%) | 0.42 | 88 (23%) | 49 (23%) | 0.90 | 367 (47%) | 168 (42%) | 0.13 |
| Married, n (%) | 301 (73%) | 145 (66%) | 0.09 | 263 (67%) | 133 (63%) | 0.38 | 549 (70%) | 286 (71%) | 0.67 |
| Work Status | 0.77 | 0.94 | 0.01 | ||||||
| Full or part time | 134 (32%) | 64 (29%) | 126 (32%) | 66 (31%) | 456 (58%) | 266 (66%) | |||
| Disabled | 40 (10%) | 20 (9%) | 35 (9%) | 16 (8%) | 121 (15%) | 37 (9%) | |||
| Homemaker | 78 (19%) | 41 (19%) | 107 (27%) | 60 (29%) | 55 (7%) | 24 (6%) | |||
| Other | 162 (39%) | 95 (43%) | 123 (31%) | 68 (32%) | 156 (20%) | 76 (19%) | |||
| Disability compensation status, n (%)* | 30 (7%) | 18 (8%) | 0.79 | 34 (9%) | 7 (3%) | 0.02 | 161 (20%) | 47 (12%) | <0.001 |
| Straight leg raise or femoral tension, n (%) | 89 (21%) | 43 (20%) | 0.64 | 52 (13%) | 33 (16%) | 0.49 | 678 (86%) | 292 (72%) | <0.001 |
| Any neurologic deficit, n (%) | 224 (54%) | 125 (57%) | 0.57 | 210 (54%) | 117 (56%) | 0.70 | 617 (78%) | 285 (71%) | 0.006 |
| Reflexes - asymmetric depressed | 109 (26%) | 59 (27%) | 0.97 | 101 (26%) | 49 (23%) | 0.56 | 325 (41%) | 156 (39%) | 0.45 |
| Sensory - asymmetric decrease | 123 (30%) | 59 (27%) | 0.50 | 110 (28%) | 59 (28%) | 0.93 | 429 (54%) | 174 (43%) | <0.001 |
| Motor - asymmetric weakness | 109 (26%) | 68 (31%) | 0.26 | 90 (23%) | 56 (27%) | 0.37 | 354 (45%) | 147 (36%) | 0.007 |
| Perceive problem is getting worse | 277 (67%) | 101 (46%) | <0.001 | 270 (69%) | 91 (43%) | <0.001 | 379 (48%) | 93 (23%) | <0.001 |
| Definite surgical treatment preference, n (%) | 190 (46%) | 6 (3%) | <0.001 | 162 (41%) | 5 (2%) | <0.001 | 409 (52%) | 14 (3%) | <0.001 |
Receiving workers’ compensation, Social Security compensation, or other compensation, or application for compensation pending.
Among surgically treated patients, reoperations were not common. For SpS, 43 (10.4%) patients underwent 47 additional surgeries; for DS, 48 (12.3%) patients had 52 additional surgeries, and for IDH 70 (8.9%) patients had 82 repeat surgeries. In each case, the majority of repeat surgeries were within 2 years of the initial surgery with a substantial minority occurring after 2 years, including 32.6% of SpS, 20.8% of DS and 24.4% of IDH repeat procedures.
Higher health state values were observed over time among surgically treated patients, than among non-operatively treated patients (Figure 1). Mean quality-adjusted life years over the 4-year study period ranged from 2.66 to 3.24 (Table 2). QALY differences between treatment groups over 4 years were 0.22 (95%CI: 0.15, 0.34) for SpS; 0.34 (95%CI: 0.30, 0.47) for DS; and 0.34 (95%CI: 0.31, 0.38) for IDH.
Figure 1.
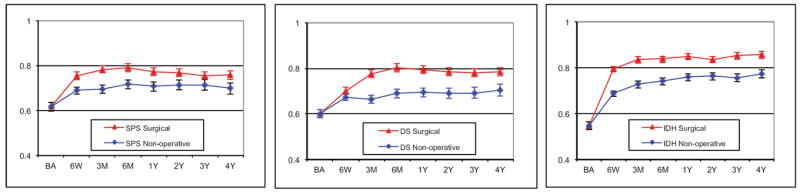
Adjusted mean EQ-5D health state values and 95% confidence intervals over time by treatment received for A) spinal stenosis, B) degenerative spondylolisthesis with stenosis and C) intervertebral disc herniation disease groups. Treatment groups are compared assuming a common baseline value.
Table 2.
Adjusted* mean 4-year costs (95% CI), QALY (95%), and cost QALY gained by patients group and type of surgery relative to non-operative treatment.
| Patient Group | N | Mean Cost | 95% CI | QALY | 95% CI | Cost per QALY gained† | 95% CI | |||
|---|---|---|---|---|---|---|---|---|---|---|
| Spinal Stenosis | ||||||||||
| Non-operative | 220 | $24,611 | $20,814 | $27,838 | 2.72 | 2.63 | 2.76 | |||
| All surgery | 414 | $37,758 | $35,773 | $43,748 | 2.94 | 2.87 | 2.98 | $59,400 | $37,059 | $125,162 |
| Type of Surgery: | ||||||||||
| Decompression surgery | 327 | $34,617 | $32,976 | $40,692 | 2.95 | 2.89 | 3.01 | $42,800 | $23,623 | $91,993 |
| Fusion surgery | 47 | $59,612 | $46,974 | $75,196 | 2.85 | 2.59 | 3.01 | $257,600 | $83,991 | $4,344,662 |
| Degenerative spondylolisthesis | ||||||||||
| Non-operative | 210 | $31,095 | $26,802 | $37,959 | 2.66 | 2.56 | 2.68 | |||
| All surgery | 391 | $53,222 | $49,393 | $57,368 | 3.00 | 2.96 | 3.07 | $64,300 | $32,864 | $83,117 |
| Type of Surgery: | ||||||||||
| Decompression surgery | 23 | $34,953 | $16,805 | $52,031 | 2.89 | 2.57 | 3.19 | $17,000 | save | $234,460 |
| Fusion surgery | 356 | $54,402 | $50,653 | $58,768 | 3.01 | 2.97 | 3.08 | $66,300 | $34,863 | $84,416 |
| Type of Fusion Surgery: | ||||||||||
| Noninstrumented fusion | 80 | $56,195 | $46,173 | $60,818 | 3.01 | 2.89 | 3.14 | $71,200 | $28,515 | $99,673 |
| Instrumented fusion | 276 | $53,882 | $50,128 | $59,723 | 3.01 | 2.97 | 3.09 | $64,900 | $33,708 | $88,574 |
| Type of Instrumentation: | ||||||||||
| Posterolateral fusion (pedical screws) | 213 | $52,329 | $47,942 | $58,558 | 2.99 | 2.93 | 3.07 | $64,100 | $30,972 | $93,819 |
| Circumferential (360) fusion‡ | 63 | $59,134 | $49,142 | $73,547 | 3.08 | 2.96 | 3.28 | $66,900 | $26,855 | $111,555 |
| Intervertebral Disc Herniation | ||||||||||
| Non-operative | 403 | $22,067 | $18,979 | $25,825 | 2.90 | 2.81 | 2.92 | |||
| All surgery | 789 | $29,061 | $26,758 | $31,384 | 3.24 | 3.22 | 3.30 | $20,600 | $4,539 | $33,088 |
Baseline covariates used for spinal stenosis models were age, gender, stomach co-morbidity, SLR or femoral tension sign, smoking status, joint co-morbidity, patient self-assessed health trend, income, compensation, BMI, baseline EQ-5D and center. Baseline covariates used for degenerative spondylolisthesis models were age, gender, work status, depression, osteoporosis, joint problems, current symptom duration, reflex deficit, number of moderate/severe stenotic levels, baseline EQ-5D, baseline stenosis bothersomeness and center. Baseline covariates used for intervertebral disc herniation models were age, gender, marital status, smoking status, race, compensation, herniation location, work status, stomach co-morbidity, depression, other*** comorbidity, self-rated health trend, duration of most recent episode, treatment preference and baseline EQ-5D and center.
Versus non-operative with estimates rounded to 100’s.
Circumferential fusions included both anterior and plif and tlif interbody fusions.
“Other comorbidities include: stroke, diabetes, osteoporosis, cancer, fibromyalgia, cfs, PTSD, alcohol, drug dependency, heart, lung, liver, kidney, blood vessel, nervous system, hypertension, migraine, anxiety, stomach, bowel.
Adjusted total mean costs remained higher for surgically treated patients than for non-operatively treated patients across all patient groups (Table 2). Cost differences between treatment groups over 4 years were $13,147 (95%CI: $9,168, 21,716) for SpS; $22,127 (95%CI: $13,149, $38,317) for DS; and $6,994 (95%CI: $1,900, $11,237) for IDH. Examination of costs by treatment received showed somewhat different patterns over time (Figure 2). Ongoing direct medical costs were observed for all groups (Figure 2A) with similar expenditure patterns between treatment groups within each disease category (data not shown). The largest ongoing costs occurred for DS patients, who had higher ongoing indirect costs among non-operatively treated patients (Figure 2B).
Figure 2.
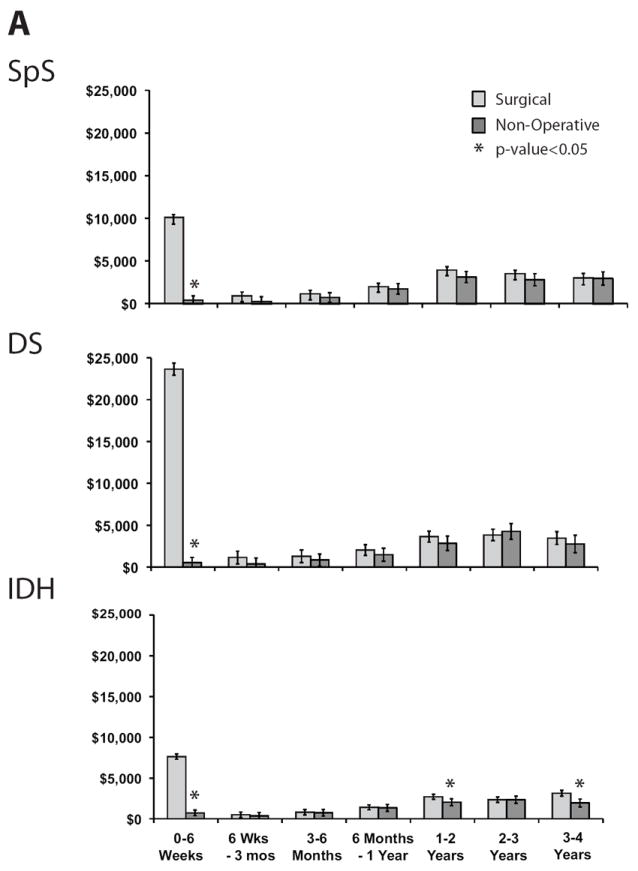
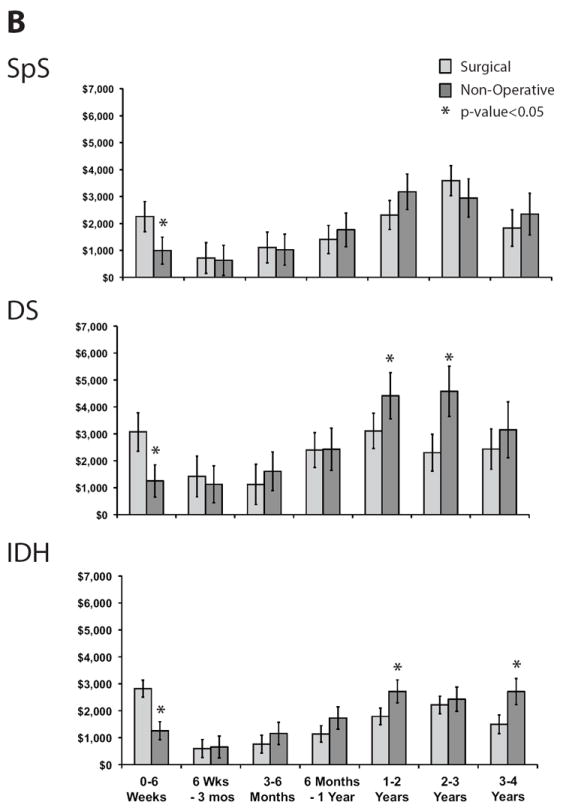
Mean costs and 95% confidence intervals by time period and treatment received for each disease group and type of cost: A) Direct medical costs, B) Indirect costs.
The cost per QALY gained for surgery relative to non-operative care was lowest for those with IDH ($20,600) and highest for those with DS ($64,300) (Table 2). Only 23 DS patients underwent decompression alone and only 47 SpS patients underwent fusion surgery, making definitive comparisons between procedures within disease groups impractical. Among those with SpS, fusion surgery’s cost per QALY gained relative to non-operative care was $257,600 with a very wide confidence interval (Table 2). Among those with DS, fusion surgery’s cost per QALY gained relative to non-operative care was $66,300.
When type of instrumentation was examined for DS patients who underwent instrumented fusion, no statistically significant differences in QALY outcomes were found. The cost-effectiveness of each type of instrumentation relative to non-operative treatment was comparable at approximately $65,000 to $75,000 per QALY gained.
In sensitivity analyses, mortality adjustment, method of QALY estimation, and limiting the analysis to surgeries occurring within 2 years had little impact on cost-effectiveness estimates (Table 3). While study cohort (randomized vs. not) had little impact on cost-effectiveness for DS or IDH, in the SpS group the randomized cohort cost per QALY gained was somewhat higher at $124,700. Estimates remained below $125,000 per QALY gained across disease groups when higher surgery costs were used.
Table 3.
Sensitivity analysis results shown as mean cost per QALY gained (95% confidence interval) for surgery relative to non-operative care by disease group as analytic assumptions are varied.
| Analytic Assumptions | Mean Cost per QALY Gained (95%CI) | ||
|---|---|---|---|
|
| |||
| Spinal Stenosis | Degenerative Spondylolisthesis | Intervertebral Disc Herniation | |
|
| |||
| Primary analysis* | $59,400 ($37,059, $125,162) | $64,300 ($32,864, $83,117) | $20,600 ($4,539, $33,088) |
| Observational Cohort | $48,300 ($12,011, $110,277) | $88,000 ($33,577, $151,986) | $28,200 ($5,283, $54,337) |
| Randomized Cohort | $124,700 ($35,592, $459,143) | $51,600 ($18,885, $79,327) | $17,700 (save, $33,331) |
| Direct Medical Costs** | $52,100 ($29,504, $84,516) | $73,200 ($48,906, $87,650) | $26,500 ($16,784, $33,574) |
| Direct Medical & Worker Productivity Costs | $53,900 ($31,362, $91,012) | $72,200 ($48,124, $88,020) | $26,800 ($14,110, $33,863) |
| Higher Surgery Payment Amount | $102,400 ($63,558, $180,753) | $122,500 ($78,827, $148,691) | $43,800 ($22,291, $57,563) |
| With Mortality Adjustment | $63,600 ($32,443, $115,557) | $61,400 ($33,199, $82,307) | $20,700 ($4,571, $33,037) |
| Initial Surgery Occurred within 2 Years | $52,300 ($28,977, $96,795) | $55,100 ($29,220, $71,046) | $18,500 ($3,457, $29,514) |
| QALY Estimation with SF-6D | $66,700 ($38,138, $122,820) | $79,300 ($43,314, $109,123) | $28,000 ($5,836, $46,913) |
Combined randomized and observational cohorts, all costs, Medicare surgery costs, no mortality adjustment, and EuroQol EQ-5D scores used to estimated QALYs.
Consistent with reference-case analysis recommended by Panel on Cost-effectiveness in Health and Medicine.
DISCUSSION
We used longitudinal patient-reported data on resource use, productivity loss, and health-related quality of life to evaluate the cost-effectiveness of surgery relative to non-operative care for three well-defined clinical cohorts. Compared with findings over 2 years, when assessed over 4 years the value of surgery improved for all groups, and most notably for individuals with DS. This finding warrants examination of both the effectiveness and cost sides of the cost-effectiveness equation in comparison to previously reported 2-year outcomes.11,12
QALY differences at 2 years between surgically and non-operatively treated individuals of 0.17 (95%CI: 0.12, 0.22) for SpS; 0.23 (95%CI: 0.19, 0.27) for DS; and 0.21 (95%CI:0.16, 0.25) for IDH were previously reported.11,12 Using these 2-year differences as benchmarks, the 4-year QALY results reported here continue to favor surgery (additional QALY differences of 0.05 for SpS; 0.13 for both DS and IDH for 4-year minus 2-year outcomes). However, the magnitude of the difference for SpS patients diminished far more than can be explained by the 3% per year discount rate employed in our analysis. For SpS patients, differences favoring surgery in years 3 and 4 were reduced by approximately 75% from those observed over 2 years. For DS and IDH QALY gains remained comparable over time.
Net costs over 2 years were higher for surgically vs. non-operatively treated patients with reported differences, inclusive of initial and repeat surgery costs, of approximately $13,000 for SpS; $22,000 for DS; and $7,000 for IDH under Medicare costing.11,12 Both DS and IDH patients who were non-operatively treated tended to have ongoing costs in years 3 and 4 that were higher than those observed for surgically treated patients, with this effect being most pronounced for individuals with DS, mainly due to productivity losses. By contrast, SpS patients had costs that were fairly comparable between surgically and non-operatively treated patients, with costs during years 3 and 4 being slightly higher in operatively treated patients.
Following effectiveness and cost patterns over time resulted in improved estimates of surgery’s value–particularly for DS and IDH patients. These findings highlight the importance of following health and economic outcomes longitudinally to determine value over an extended time horizon.
While the randomized clinical trial remains a cornerstone for comparative effectiveness research, it is widely recognized that alternative study designs, including observational cohorts, are necessary to support comparative evidence development for many diseases and population subgroups. Our analyses included SPORT’s randomized and observational cohorts and adjusted for factors known to affect treatment received due to the cross-over between treatment groups. We acknowledge, however, that our analytic approach cannot control for any un-measured differences between the two patient groups. To assess the potential impact of treatment selection on cost-effectiveness results in sensitivity analyses we reported results for the observational and randomized cohorts separately and also undertook an analysis where surgeries occurring beyond two years were removed from consideration. Mean costs per QALY gained remained fairly stable and in all cases fell within the 95% confidence interval reported for the primary analysis.
Previous randomized and non-randomized observational studies have shown a diminution in effect of surgery over time and cost-effectiveness reports have been based on decision-analytic models and/or incomplete longitudinal data.27-29 For example, a model-based analysis compared types of surgery 30 for stenosis patients, but did not assess surgery’s value relative to non-operative care and did not use longitudinal resource utilization data. Other economic analyses have addressed the value of spinal fusion for various populations or lumbar discectomy for IDH but have not reported outcomes using the recommended effectiveness measure, QALYs. 4,14,29,31 Although our study addressed many of these shortcomings, several limitations warrant mention. First, our study relied on patient self-report of resource use and work/ activity limitations over time. While these have not been validated against an external source, comparisons between treatment groups using the same self-report methodology are likely to provide reasonable estimates of cost differences between treatment groups over time. Second, although the SPORT cohorts represent the largest groups followed to date with health-related quality of life outcomes collected prospectively at multiple follow-ups, we are limited in our ability to make comparisons between types of surgery due to the predominance of one type of surgery within each disease group. For example, 79% of stenosis surgeries involved decompression without fusion while 91% of surgeries in those with degenerative spondylolisthesis involved fusion. Likewise, our study was not powered to examine surgery by fusion type (instrumentation vs. not; type of instrumentation, etc), yet the SPORT study represents the best available evidence to date with outcomes reported over 4 years. Finally, it is also important to emphasize that our results address the value of spine surgery in individuals with well-defined indications for surgery and cannot be generalized to other populations such as individuals with degenerative disc disease in whom surgery has become increasingly common. 4
Early cost-effectiveness results from SPORT suggested good value for surgery relative to non-operative care for IDH and SPS, while the value of surgery for DS was not quite as favorable. 11,12 However, it was noted that longer-term follow-up would be essential to fully characterize the cost-effectiveness of surgery for these specific indications. With follow-up over two additional years, it is evident that surgery for IDH has very favorable value regardless of the approach to costing that is undertaken. The cost-effectiveness of surgery for stenosis improved slightly, while the cost-effectiveness of surgery for DS improved markedly and now falls within the range of many commonly accepted medical and surgical practices. Continued follow-up of surgically and non-operatively treated patients is necessary to provide further evidence regarding the clinical effectiveness and cost-effectiveness of surgery over time. These data provide a basis for promoting fully informed choice for patients with disc herniation or spinal stenosis with or without degenerative spondylolisthesis who face the difficult decision of whether or not to undergo spine surgery.
Key Points.
The cost-effectiveness of spine surgery for patients in three well-defined clinical groups (SpS, DS, IDH) was assessed over 4 years among SPORT participants.
For each group, the cost per quality-adjusted life year (QALY) gained for surgery relative to non-operative care improved compared with previously reported 2-year outcomes.
Changes in the value of surgery when viewed over the longer time horizon were due both to durable QALY differences between surgically and non-operatively treated patients and to patterns of ongoing care costs.
Our findings highlight the importance of including a contemporary comparison group in cost-effectiveness studies of spine surgery.
SPORT may serve as a paradigm for future comparative effectiveness studies whose objective is to provide evidence on outcomes for a diverse group of participant with varying initial treatment preferences.
Acknowledgments
We gratefully acknowledge Catherine C. Lindsay, S.M. for extensive work in the development of the cost weights used in this analysis, Tamara S. Morgan for creation of the patient diaries and for her assistance in preparing this manuscript, and Loretta Pearson for editorial assistance.
Grant Support: The authors acknowledge funding from the following sources: The National Institute of Arthritis and Musculoskeletal and Skin Diseases (U01-AR45444), and the Office of Research on Women’s Health, the National Institutes of Health, and the National Institute of Occupational Safety and Health, the Centers for Disease Control and Prevention. The Multidisciplinary Clinical Research Center in Musculoskeletal Diseases is funded by NIAMS (P60-AR048094).
Grant funds were received in support of this work. One or more of the author(s) has/have received or will receive benefits for personal or professional use from a commercial party related directly or indirectly to the subject of this manuscript: e.g., honoraria, gifts, consultancies, royalties, stocks, stock options, decision making position.
References
- 1.Institute of Medicine. Initial National Priorities for Comparative Effectiveness Research. Washington, DC: National Academies Press; 2009. [Google Scholar]
- 2.Dartmouth Atlas Working Group JW, PI. Dartmouth Atlas of Musculoskeletal Health Care. Chicago, IL: American Hospital Association Press; 2000. [Google Scholar]
- 3.Weinstein JN, Lurie JD, Olson PR, et al. United States’ trends and regional variations in lumbar spine surgery: 1992-2003. Spine. 2006;31(23):2707–14. doi: 10.1097/01.brs.0000248132.15231.fe. [DOI] [PMC free article] [PubMed] [Google Scholar]
- 4.Deyo RA, Mirza SK, Martin BI, et al. Trends, major medical complications, and charges associated with surgery for lumbar spinal stenosis in older adults. JAMA. 2010;303(13):1259–65. doi: 10.1001/jama.2010.338. [DOI] [PMC free article] [PubMed] [Google Scholar]
- 5.IOM (Institute of Medicine) Initial National Priorities for Comparative Effectiveness Research. Washington, D.C.: The National Academies Press; 2009. [Google Scholar]
- 6.Weinstein JN, Lurie JD, Tosteson TD, et al. Surgical versus nonsurgical treatment for lumbar degenerative spondylolisthesis. N Engl J Med. 2007;356(22):2257–70. doi: 10.1056/NEJMoa070302. [DOI] [PMC free article] [PubMed] [Google Scholar]
- 7.Weinstein JN, Lurie JD, Tosteson TD, et al. Surgical vs nonoperative treatment for lumbar disk herniation: the Spine Patient Outcomes Research Trial (SPORT) observational cohort. Jama. 2006;296(20):2451–9. doi: 10.1001/jama.296.20.2451. [DOI] [PMC free article] [PubMed] [Google Scholar]
- 8.Weinstein JN, Tosteson TD, Lurie JD, et al. Surgical versus nonoperative treatment for lumbar spinal stenosis: Two-year results of the Spine Patient Outcomes Research Trial (SPORT) randomized and observational cohorts. N Engl J Med. 2008 in press. [Google Scholar]
- 9.Weinstein JN, Tosteson TD, Lurie JD, et al. Surgical Versus Nonoperative Treatment for Lumbar Spinal Stenosis Four-Year Results of the Spine Patient Outcomes Research Trial. Spine (Phila Pa 1976) 2010 doi: 10.1097/BRS.0b013e3181e0f04d. ePub. [DOI] [PMC free article] [PubMed] [Google Scholar]
- 10.Weinstein JN, Tosteson TD, Lurie JD, et al. Surgical vs nonoperative treatment for lumbar disk herniation: the Spine Patient Outcomes Research Trial (SPORT): a randomized trial. Jama. 2006;296(20):2441–50. doi: 10.1001/jama.296.20.2441. [DOI] [PMC free article] [PubMed] [Google Scholar]
- 11.Tosteson AN, Lurie JD, Tosteson TD, et al. Surgical treatment of spinal stenosis with and without degenerative spondylolisthesis: cost-effectiveness after 2 years. Ann Intern Med. 2008;149(12):845–53. doi: 10.7326/0003-4819-149-12-200812160-00003. [DOI] [PMC free article] [PubMed] [Google Scholar]
- 12.Tosteson AN, Skinner JS, Tosteson TD, et al. The cost effectiveness of surgical versus nonoperative treatment for lumbar disc herniation over two years: evidence from the Spine Patient Outcomes Research Trial (SPORT) Spine. 2008;33(19):2108–15. doi: 10.1097/brs.0b013e318182e390. [DOI] [PMC free article] [PubMed] [Google Scholar]
- 13.Birkmeyer NJ, Weinstein JN, Tosteson AN, et al. Design of the Spine Patient outcomes Research Trial (SPORT) Spine. 2002;27(12):1361–72. doi: 10.1097/00007632-200206150-00020. [DOI] [PMC free article] [PubMed] [Google Scholar]
- 14.Gold M, Siegel J, Russell L, et al. Cost-Effectiveness in Health and Medicine. New York: Oxford University Press; 1996. [Google Scholar]
- 15.Anonymous. EuroQol--a new facility for the measurement of health-related quality of life. The EuroQol Group. Health Policy. 1990;16(3):199–208. doi: 10.1016/0168-8510(90)90421-9. [comment] [DOI] [PubMed] [Google Scholar]
- 16.Shaw JW, Johnson JA, Coons SJ. US valuation of the EQ-5D health states: development and testing of the D1 valuation model. Med Care. 2005;43(3):203–20. doi: 10.1097/00005650-200503000-00003. [DOI] [PubMed] [Google Scholar]
- 17.Brazier J, Roberts J, Deverill M. The estimation of a preference-based measure of health from the SF-36. Journal of health economics. 2002;21(2):271–92. doi: 10.1016/s0167-6296(01)00130-8. [DOI] [PubMed] [Google Scholar]
- 18.Schmidt K, Hart AC, editors. DRG Expert: A Comprehensive Reference to the DRG Classification System. 20. Eden Prairie, MN: Ingenix; 2004. [Google Scholar]
- 19.Red Booked. Montvale, NJ: Thompson PDR; 2004. [Google Scholar]
- 20.Anonymous. RBRVS Fee Schedule: A Plain-English Guide. Rockville, MD: Decision Health; 2004. [Google Scholar]
- 21.Hodgson T, Meiners M. Cost-of-illness medthodology: A guide to current practices and procedures. Milbank Memorial Fund Quarterly. 1982;60(3):429–62. [PubMed] [Google Scholar]
- 22.Bureau USC. Income, Expenditures and Wealth. 2004-2005 [Google Scholar]
- 23.Statistics BoL. Employer Costs for Employee Compensation Summary. [September 7, 2005];2005 Available from: http://www.bls.gov/news.release/ecec.nr0.htm.
- 24.Statistics BoL. Employment Cost Index. U.S. Department of Labor; 2005. [September 7, 2006]. Available from: http://data.bls.gov/PDQ/servlet/SurveyOutputServlet?data_tool=latest_numbers&series_id=ECU10001A. [Google Scholar]
- 25.Diggle P, Haeagerty P, Liang K, et al. The analysis of longitudinal data. 2. Oxford, England: Oxford University Press; 2002. [Google Scholar]
- 26.Fitzmaurice G, Laird N, Ware J. Applied Longitudinal Analysis. Philadelphia, PA: John Wiley & Sons; 2004. [Google Scholar]
- 27.Atlas SJ, Deyo RA, Keller RB, et al. The Maine Lumbar Spine Study, Part II. 1-year outcomes of surgical and nonsurgical management of sciatica. Spine. 1996;21(15):1777–86. doi: 10.1097/00007632-199608010-00011. [DOI] [PubMed] [Google Scholar]
- 28.Atlas SJ, Keller RB, Wu YA, et al. Long-term outcomes of surgical and nonsurgical management of lumbar spinal stenosis: 8 to 10 year results from the maine lumbar spine study. Spine. 2005;30(8):936–43. doi: 10.1097/01.brs.0000158953.57966.c0. [DOI] [PubMed] [Google Scholar]
- 29.Weber H. Lumbar disc herniation: A controlled, prospective study with ten years of observation. Spine. 1983;8(2):131–40. [PubMed] [Google Scholar]
- 30.Kuntz KM, Snider RK, Weinstein JN, et al. Cost-effectiveness of fusion with and without instrumentation for patients with degenerative spondylolisthesis and spinal stenosis. Spine. 2000;25(9):1132–9. doi: 10.1097/00007632-200005010-00015. [DOI] [PubMed] [Google Scholar]
- 31.Soegaard R, Christensen FB. Health economic evaluation in lumbar spinal fusion: a systematic literature review anno 2005. Eur Spine J. 2006;15(8):1165–73. doi: 10.1007/s00586-005-0031-6. [DOI] [PMC free article] [PubMed] [Google Scholar]