

Abstract
Humans can attend to different objects independent of their spatial locations. While selecting an object has been shown to modulate object processing in high-level visual areas in occipitotemporal cortex, where/how behavioral importance (i.e., priority) for objects is represented is unknown. Here we examined the patterns of distributed neural activity during an object-based selection task. We measured brain activity with functional magnetic resonance imaging (fMRI), while participants viewed two superimposed, dynamic objects (left- and right-pointing triangles) and were cued to attend to one of the triangle objects. Enhanced fMRI response was observed for the attention conditions compared to a neutral condition, but no significant difference was found in overall response amplitude between two attention conditions. By using multi-voxel pattern classification (MVPC), however, we were able to distinguish the neural patterns associated with attention to different objects in early visual cortex (V1 to hMT+) and lateral occipital complex (LOC). Furthermore, distinct multi-voxel patterns were also observed in frontal and parietal areas. Our results demonstrate that object-based attention has a wide-spread modulation effect along the visual hierarchy and suggest that object-specific priority information is represented by patterned neural activity in the dorsal frontoparietal network.
Keywords: attention, fMRI, object-based, pattern classification, top-down control
1. Introduction
Attention helps us selectively process information in complex visual scenes. Visual attention can be directed towards spatial locations (Posner, 1980; Treisman & Gelade, 1980), feature properties such as color or orientation (Maunsell & Treue, 2006; Saenz, Buracas, & Boynton, 2002). There is also considerable behavioral evidence for object-based attention, an ability to select whole perceptual objects, often independent of their spatial locations (Blaser, Pylyshyn, & Holcombe, 2000; Duncan, 1984; Kanwisher & Driver, 1992). Object-based attention is important because objects tend to be the focus of our perceptual awareness and also the target of our action. Object-based selection is particularly necessary when different objects occupy similar location (e.g., due to occlusion).
Previous functional magnetic resonance imaging (fMRI) studies have revealed enhanced response in higher-level object-selective regions (e.g. fusiform face area and lateral occipital complex) during object-based selection (Murray & Wojciulik, 2004; O'Craven, Downing, & Kanwisher, 1999; Serences, Schwarzbach, Courtney, Golay, & Yantis, 2004). Recent studies using neural pattern analyses also revealed identity- and category-specific population responses during visual search tasks in these areas (Peelen, Fei-Fei, & Kastner, 2009; Peelen & Kastner, 2011; Zhang et al., 2011). Although the majority of studies on object-based attention have focused on high-level visual areas, neurophysiological studies using a curve tracing task have demonstrated a modulation of neuronal activity due to object-based selection in early visual cortex such as V1 (Khayat, Spekreijse, & Roelfsema, 2006; Roelfsema, Lamme, & Spekreijse, 1998). However, there is a lack of neuroimaging evidence on whether object-based attention can modulate early visual activity in human cortex.
Furthermore, and more importantly for the present study, although previous studies have documented the effects of object-based attention on visual cortex, the nature of the top-down control signals for object-based selection is unknown. Here we hypothesized that if people can select different objects behaviorally, there should be neural signals representing the behavioral importance for selected objects, i.e., attentional priority, that exert top-down modulation on sensory representations. Using a similar logic, studies on spatial attention have suggested the dorsal frontal and parietal areas in both humans and monkeys encode priority information for spatial locations (Bisley & Goldberg, 2010; Silver, Ress, & Heeger, 2005; Thompson & Bichot, 2005). These areas (frontal eye field and lateral intraparietal area in monkeys and their human analog) contain topographic maps of the visual space which provide spatial frameworks to exert top-down retinotopic-specific modulation. However, a pure spatial priority signal is not sufficient to explain selection of stimuli that share the same spatial location (e.g., superimposed objects). Indeed, we have shown in a recent study (Liu, Hospadaruk, Zhu, & Gardner, 2011) that these areas also contain motion and color-selective responses during feature-based selection. This observation suggests that the dorsal frontal and parietal areas encode priority information for not only spatial locations, but also for visual features. In this study, we further test whether these areas encode more abstract, non-spatial priority signals for visual objects.
We conducted an fMRI experiment in which participants viewed a compound stimulus including two spatially superimposed objects and performed a detection task on one of the objects. A conventional univariate analysis identified brain areas active during object-based selection compared to a baseline condition. Furthermore, using multivariate pattern analysis we found distinct neural patterns for different attended objects in both dorsal frontoparietal areas and the visual cortex. A control experiment ruled out contribution from spatial attention. These results suggest that the dorsal frontoparietal areas represent priority information for selected objects and modulate object processing in the visual cortex.
2. Material and Methods
2.1 Participants
Six individuals (two females) participated in the main experiment; all had normal or corrected-to-normal vision. Two of the participants were authors, the rest were graduate and undergraduate students at Michigan State University. Four individuals (1 female) participated in the control experiment, two of whom also participated in the main experiment, including one author. All participants were given informed consent according to the study protocol that was approved by the Institutional Review Board at Michigan State University. Participants were compensated at the rate of $25 per scanning session.
2.2 Stimuli and display
The stimuli were composed of two superimposed equilateral triangles (2.17-4.33° in length per side, 0.15° edge in thickness, luminance: 18.2 cd/m2) presented on a dark background (0.01 cd/m2). The triangles were centered at fixation and were oriented such that one pointed to the left and the other one pointed to the right (see Figure 1). All the stimuli were generated using MGL (http://gru.brain.riken.jp/doku.php?id=mgl:overview) running in Matlab (Mathworks, Natick, MA).
Figure 1.

Schematic of experimental task and behavioral results. (A). A trial in the attention task. (B). Behavioral data in the scanner. The number of reported target is plotted as a function of number of targets in the cued object (solid lines) and number of distracters in the uncued object (dashed lines). Error bars indicate ±1 s.e.m. across participants. (C). Eye tracking data outside the scanner. Average horizontal (x) and vertical (y) eye positions across trials and participants are plotted for T1 (red) and T2 (green) trials. Light red and light green denote 95% confidence interval across participants.
Images were projected on a rear-projection screen located in the scanner bore by a Toshiba TDP-TW100U projector outfitted with a custom zoom-lens (Navitar, Rochester, NY). The screen resolution was set to 1024×768 and the display was updated at 60 Hz. Participants viewed the screen via an angled mirror attached to the head coil at a viewing distance of 60 cm.
2.3 Design and Procedure
2.3.1 Main experiment: task and procedure
Two triangles centered in a fixation cross expanded and contracted in a counter-phase fashion, i.e., when one triangle increased in size the other decreased in size and vice versa (Figure 1A). The white fixation cross (width: 0.25°) was displayed in the center of the screen throughout the experiment. Participants were cued to attend to either the triangle with a left-pointing vertex (T1), the triangle with a right-pointing vertex (T2), or the fixation (null). At the beginning of each trial, an arrow cue (“←”, “→”, “↔”) was presented for 500 ms, which indicated participant to attend to T1, T2, or the fixation. Trials were 19.8 s long, with the order pseudo-randomized such that the first trial in a run was always a null trial and each trial type followed/preceded each other trial type equally often. Each scanning run contained 5 trials of each type, for a total of 15 trials (297 s/run). In addition, an 8.8 s fixation period was presented at the beginning of the run whose imaging data were subsequently discarded. Each participant completed 10 of these runs in the scanner for a total of 50 T1, 50 T2 and 50 null trials.
Meanwhile, participants performed a luminance change detection task which probed whether they were able to selectively attend to the cued object. Both objects underwent brief luminance increments on one of the edges at randomized intervals (duration: 0.5 s, average interval: 5.43 s), and the timing of the luminance increments were randomized independently for two objects. Participants were instructed to count the number of luminance increments (targets) they detected in the cued object, which could be 3, 4, or 5. At the end of each trial, the fixation cross turned to yellow for 1 s, which indicated to participants to report the number of targets. Participants pressed one of three buttons using their index finger, middle finger, or ring finger, to indicate 3, 4, or 5 targets occurred on the cued object, respectively. The magnitude of the luminance increments was determined in a separate behavioral experiment, using a 1-up 2-down staircase procedure, to maintain performance at an intermediate level.
2.3.2 Control experiment
The control experiment was run to test whether a spatial attention bias can be detected in our protocol. The stimuli and timing were identical to the main experiment while the task and instruction differed. The arrow cues instructed participants to attend to either the corner of the cued object, or the fixation cross. Brief luminance increments (0.5 s) at the corner of the triangles (17% along the length of the edge, see Figure 6A), as well as luminance increments of the fixation cross, appeared at random times and participants pressed a button to indicate their detection of the luminance change on the attended object (T1, T2, or fixation). The magnitude of the luminance increment was controlled by separate 1-up 2-down staircases to maintain performance at an intermediate level. Each participant completed 6 scanning runs, which yielded 30 trials for each attention condition (T1, T2, and fixation).
Figure 6.
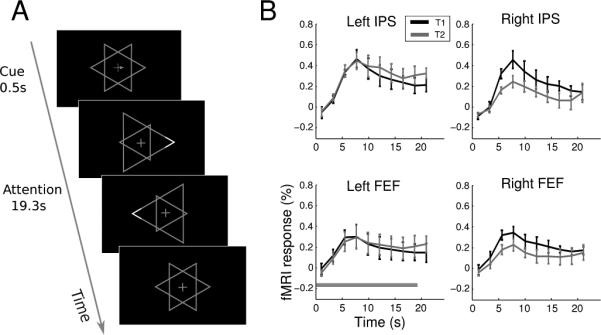
Control experiment: task and results. (A). Schematic of a trial in the control experiment. (B). Mean time course (N=4) of two regions (IPS and FEF) in each hemisphere. The horizontal bar in the lower left panel indicates the duration of a trial. Error bars denote ±1 s.e.m. across participants.
2.3.3 Eye tracking
To evaluate the stability of fixation, we monitored the eye position outside the scanner when participants performed the attention task. All participants took part in the eye tracking session, and each participant performed one run of the attention task. The position of the right eye was recorded with an Eyelink II system (SR Research, Ontario, Canada) at 250 Hz. Eye position data were analyzed offline using custom Matlab code.
2.3.4 Localizer experiment: task and procedure
For each participant, we also ran a localizer task to identify the lateral occipital complex (LOC), a key brain area for shape processing (Grill-Spector, Kourtzi, & Kanwisher, 2001). Twenty intact images (9.74°) of simple line drawings of 3-D recognizable object (“on”) or their scrambled version (“off”) were presented in a 19.8 s block. Each block contained 20 object images, with each image presented for 495 ms followed by a fixation interval of 495 ms. A total of 16 blocks (8 on-off cycles) were presented in one scanning run. In addition, an 8.8 s fixation period was presented at the beginning of the scanning run whose imaging data were subsequently discarded. Participants were instructed to maintain fixation on a cross in the center, and to press a button whenever they noticed two identical images in a row (one-back matching). Using this task we defined object selective regions LOC which were two areas in the occipital cortex, one on the lateral surface and one in ventral occipitotemporal regions (Grill-Spector et al., 2001).
2.3.5 Retinotopic mapping
Early visual cortex and parietal areas containing topographic maps were defined in a separate scanning session for each participant. We used rotating wedge and expanding/contracting rings to map the polar angle and radial component, respectively (DeYoe et al., 1996; Engel, Glover, & Wandell, 1997; Sereno et al., 1995). Borders between visual areas were defined as phase reversals in a polar angle map of the visual field. Phase maps were visualized on computationally flattened representations of the cortical surface, which were generated from the high resolution anatomical image using FreeSurfer and custom Matlab code. In addition to occipital visual areas, our retinotopic mapping procedure also identified topographic areas in the parietal areas, IPS1-4 (Liu et al., 2011; Swisher, Halko, Merabet, McMains, & Somers, 2007). In a separate run, we also presented moving vs. stationary dots in alternating blocks and localized the human motion-sensitive area, hMT+, as an area near the junction of the occipital and temporal cortex that responded more to moving than stationary dots (Watson et al., 1993). Thus for each participant, we indentified the following areas: V1, V2d, V2v, V3d, V3v, V3A/B, V4, V7, hMT+ and four full-field maps in the intraparietal sulcus (IPS): IPS1, IPS2, IPS3, and IPS4.
2.4 MRI Data acquisition
All functional and structural brain images were acquired using a GE Healthcare (Waukesha, WI) 3T Signa HDx MRI scanner with an 8-channel head coil, in the Department of Radiology at Michigan State University. For each participant, high-resolution anatomical images were acquired using a T1-weighted MP-RAGE sequence (FOV = 256 mm × 256 mm, 180 sagittal slices, 1mm isotropic voxels) for surface reconstruction and alignment purposes.
Functional images were acquired using a T2*-weighted echo planar imaging sequence consisted of 30 slices (TR = 2.2 s, TE = 30 ms, flip angle = 80°, matrix size = 64×64, in-plane resolution = 3mm x3 mm, slice thickness = 4 mm, interleaved, no gap). In each scanning session, a 2D T1-weighted anatomical image was also acquired that had the same slice prescription as the functional scans, but with higher in-plane resolution (0.75 mm × 0.75 mm × 4 mm) for the purpose of aligning function data to high resolution structural data.
2.5 fMRI data analysis
Data were processed and analyzed using mrTools (http://www.cns.nyu.edu/heegerlab/wiki/doku.php?id=mrtools:top) and custom code in Matlab. Preprocessing of function data included head movement correction, linear detrend and temporal high pass filtering at 0.01Hz. The functional images were then aligned to high resolution anatomical images for each participant. Functional data were converted to percent signal change by dividing the time course of each voxel by its mean signal over a run, and data from the 10 scanning runs were concatenated for subsequent analysis.
2.5.1 Functional localizer
We performed a Fourier-based analysis on data from the localizer experiment. For each voxel, we computed the correlation (coherence) between the best-fitting sinusoid at the stimulus alternation frequency and the measured time series (Heeger, Boynton, Demb, Seidemann, & Newsome, 1999). The coherence indicates the modulation magnitude of experimental parameters on the response of the particular voxel and thus serves as an index of how active a voxel responded to the visual stimulation. We used a threshold coherence value of 0.3 to define the object selective area LOC.
2.5.2 Univariate analysis
For univariate analysis, each voxel's time series were fitted with a general linear model whose regressors corresponded to the two attentional conditions (attending T1 vs. T2). Each regressor was composed of 10 volumes, modeling the fMRI response in a 22 s window after the onset of trial. The design matrix was pseudo-inversed and multiplied by the time series to obtain an estimate of the hemodynamic response evoked by the attention task. To measure the response magnitude of a region, we averaged the deconvolved response across all the voxels in a region-of-interest (ROI).
In addition to the visual and parietal regions defined by retinotopic mapping, we also defined ROIs active during the attention task (Figure 2). This was done by using the goodness of fit measure (r2 value), which is the amount of variance in the fMRI time series explained by the deconvolution model. The statistical significance of the r2 value was evaluated via a permutation test by randomizing event times and recalculating the r2 value using the deconvolution model. One thousand permutations were performed and the largest r2 value in each permutation formed a null distribution expected at chance (Nichols & Holmes, 2002). Each voxel's p-value was then calculated as the percentile of voxels in the null distribution that exceeded the r2 value of that voxel. Using a cut-off p-value of 0.005, we defined six additional areas that were active during the attention task: frontal eye field (FEF), anterior intraparietal sulcus (aIPS), medial frontal gyrus (MFG), superior frontal gyrus (mSFG), insula (INS), post-central gyrus (PCG, see Figure 2).
Figure 2.

Group r2 map and averaged task-defined brain areas. (A). Grouped averaged (N=6) r2 map in the object-based attention task, shown on an inflated Caret atlas surface. The approximate locations of the six task-defined areas (FEF, MFG, M1, PCG, IPS, and mSFG) and localizer-defined LOC are indicated by the arrowheads. Color bar indicated the scale of r2 value. Maps were thresholded at a voxelwise r2 value of 0.09, corresponding to an estimated p-value of 0.005, and a cluster size of 12 voxels. This corresponded to a whole-brain corrected false positive rate of 0.004 according to AlphaSim (see Methods). (B). Visualization of task-defined areas on the atlas surface. The union of each individually defined area is shown in the atlas space.
2.5.3 Multi-voxel pattern classification
For each voxel in a region, we obtained single-trial fMRI response by averaging the fMRI time series between the 2nd and the 9th time point (2.2 s to 19.8 s) after trial onset. For each ROI, there were 50 instances for each object-based attention condition (T1 and T2) in an n-dimensional space (n is the number of voxels). We selected voxels that were most strongly modulated by the attention task, ranked by their r2 value. Then we used a binary Fisher linear discriminant analysis (FDA) and cross-validation procedure (leave-one-instance-out) to evaluate the reliability of the multi-voxel activity patterns associated with the two attentional conditions. During the binary FDA, we projected each test instance onto a weight vector, converting the n-dimensional instance to a scalar which was then compared to a bias point to predict which class the instance belonged to. We trained the FDA on 99 instances and tested on data from one instance. The procedure was repeated for each instance of the data and we calculated overall classification accuracy for each ROI. We varied number of voxels used for the classifier from 1 to 200 voxels (or the maximum number of voxels for ROIs less than 200 voxels). The classification accuracy generally improved with increasing number of voxels. However, classification accuracy was not always a monotonic function of number of voxels; this could be caused by noise in weakly-responding voxels as they were included in the classifier or by overfitting when the classifier contained too many features (voxels) which could lead to poor generalization. Because we did not perform sophisticated feature selection procedure (De Martino et al., 2008; Yamashita, Sato, Yoshioka, Tong, & Kamitani, 2008), we used the maximum classification accuracies for the purpose of quantification. Importantly, the statistical tests were based on exactly the same set of voxels as those used for main classification analysis (see below).
We then used a permutation test to evaluate the statistical significance of the classifier performance. For each permutation, we randomly interchanged the trial labels and obtained a classification accuracy using identical classification and cross-validation method as above. For each ROI in each participant, we used the exactly the same set of voxels as those used to compute the classification accuracy plotted in Figure 4A. We repeated this process 1,000 times to obtain a distribution of classification accuracies, which represented classifier performance expected by chance. The observed classification accuracy was then compared with this chance distribution and the significance was defined as the proportion of the chance distribution greater than the observed classification accuracy.
Figure 4.
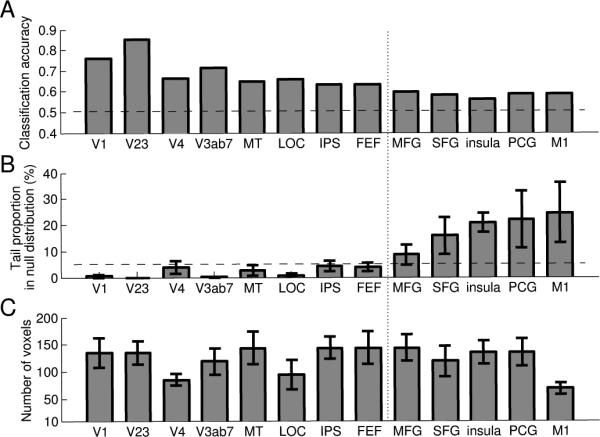
Multi-voxel pattern classification results. (A). Mean classification accuracy across participants (N=6) for each brain area. Horizontal line indicates 50% accuracy, the theoretical chance level. (B). Average percentile ranks that the observed classification accuracy fell in the null distribution of chance performance, obtained by permutation test. Horizontal dashed line indicates 5% tail in the null distribution. The vertical dotted line separates areas with significant vs. non-significant classification accuracies as assessed by the permutation test. (C). Average size of the classifier (number of voxels) for each brain area corresponding to the maximum classification accuracy (plotted in A). Error bars are ±1 s.e.m. across participants.
2.5.4 Surface-based registration and visualization of group data
All analyses were performed on individual subject data, and all quantitative results reported were based on averages across individual subject results. However, to visualize the task-related brain areas, we also performed group averaging of the individual maps (see Figure 2A). Each participant's two hemispherical surfaces were first imported into Caret and affine-transformed into the 711-2B space of the Washington University at St. Louis. The surface was then inflated to a sphere and six landmarks were drawn, which were used for spherical registration to the landmarks in the Population-Average, Landmark- and Surface-based (PALS) atlas (van Essen, 2005). We then transformed individual maps to the PALS atlas space and performed group averaging, before visualizing the results on the PALS atlas surface. To correct for multiple comparisons, we set the threshold of the maps based on individual voxel level p-value in combination with a cluster constraint.
For the r2 map (Figure 2A), we derived a voxel level p-value based on aggregating the null distributions generated from the permutation test for each individual participant. Specifically, 1000 randomizations were performed; in each randomization we randomly selected one sample (with replacement) from each participant's distribution (of 1000 values). This generated a distribution of 6000 values, which represented the maximum r2 values for all voxels expected to be at the chance level across participants. The p-value of each individual voxel was thus the percentile of voxels that has a higher r2 value in the null distribution. We then performed 10,000 Monte-Carlo simulations with AFNI's AlphaSim program, to determine the appropriate cluster size given a particular voxel-level p-value, to control for the whole-brain false positive rate (cut-off p-value = 0.005, cluster size = 12, whole-brain corrected false positive rate = 0.004).
3. Results
3.1 Behavioral results
Behavior results showed that participants were able to selectively attend to the cued object. We plotted the number of reported target as a function of number of luminance changes in the cued and uncued object (Figure 1B). The number of reported targets increased as the number of luminance changes (targets) on the cued object increased, but there was no such relationship between the number of reported target and the number of luminance changes (distracters) on the uncued object. This was supported by a two-way repeated-measures ANOVA that showed a significant main effect of target number (F (2, 25) = 9.10, p < 0.005), and a significant interaction between number of targets and attention condition (F (2, 25) = 9.08, p < 0.005). This pattern of results suggested that participants were able to attend to the cued object and ignore the uncued object.
We further broke down the data from the attended condition into two cued object conditions (T1 vs. T2) and conducted a two-way repeated-measures ANOVA with factors: number of targets and cued object. This analysis revealed a significant main effect of target number (F (2, 25) = 28.16, p < 0.001), which suggested the participants successfully performed the task. Furthermore, there was no interaction between the number of target and the cued object (p > 0.5), indicating participants paid equal attention to the two objects (T1 and T2) during the detection task.
Eye position data averaged across trials and participants were shown in Figure 1C. There was no significant difference in mean eye position within a trial between the two attention conditions, for either the horizontal or vertical eye position (paired t-test, p > 0.5), suggesting participants maintained their fixation during the experiment and there was no systematic difference between fixation behavior in T1 and T2 conditions.
3.2 Cortical areas modulated by object-based attention
We first examined cortical areas activities during the attention task, using the r2 value (see Methods). This criterion selected voxels whose activities were consistently modulated by the task, regardless of their relative activities between the two attention conditions (T1 vs. T2). The group-averaged r2 map was projected onto the atlas surface and shown in Figure 2A. Object-based attention modulated activity in a network of areas in occipital, parietal, and frontal cortex. The occipital activity overlaps with localizer-defined areas (V1, V2, V3, V3A/B, V4, V7, hMT+, LOC). The parietal activity ran along the intraparietal sulcus and extended to postcentral gyrus. The posterior portion of this activity overlapped with the retinotopically defined IPS areas (IPS1-4). We defined the anterior portion of IPS as a separate ROI, aIPS, and the activity on postcentral gyrus and the adjacent postcentral sulcus as PCG. Frontal activity included a region around posterior superior frontal sulcus and precentral sulcus, the putative human frontal-eye-field (FEF, see Paus, 1996), middle frontal gyrus (MFG), and a posterior portion of the superior frontal gyrus on the medial wall (mSFG). All these areas were found in both hemispheres, displaying largely a bilateral symmetry. Notably, we found activity in left central sulcus which was absent in the right hemisphere; this is presumably the primary motor cortex (M1) as participant used their right hand to make button press responses. To provide further localization information about the individually defined ROIs, we showed the loci of these regions on a PALS atlas surface (Figure 2B).
3.3 fMRI response amplitude
We next examined the mean fMRI response amplitudes in different object-based attention conditions in individually defined ROIs. To simplify data presentation, for this and following analysis we combined visual areas V2 and V3 into a single area V23; V3A/B and V7 into a combined area V3AB7; and five intraparietal regions (IPS1-4 and aIPS) into a combined area IPS. Compared with these combined ROIs, results remained essentially the same for individual ROIs, except the multivariate result (see below) was weaker for individual IPS areas, presumably because these areas were small and contained fewer voxels.
All areas showed an increase in fMRI response compared to the baseline (null) condition Figure 3 shows fMRI time course from 16 select ROIs, separately for the left and right hemisphere; the rest of the ROIs showed similar time courses. Overall, the two attention conditions (T1 and T2) elicited equivalent levels of neural activity in all areas. We compared response amplitude associated with the two attention conditions, both for each single time point and for the average response across time points in the trial. None of the comparisons reached statistical significance in any ROI (paired t-test, all p > .14).
Figure 3.

Mean time course (N=6) of 16 regions of interest (8 in each hemisphere). The horizontal bar in the lower left panel indicates the duration of a trial. Error bars denote ±1 s.e.m. across participants.
Even though the two triangle objects occupied the same central location, because attention was cued by left- and right-ward pointing arrows, participants might preferentially attend to left and right visual field (or the left and right part of the object), respectively. We think this spatial strategy was unlikely because the target could occur on any edge of the triangle, which required participant to attend the whole object. Furthermore, this spatial strategy should predict a contralateral attention effect: left hemisphere ROIs should show a higher response when attending to rightward pointing triangle (T2) and vice versa. To test this prediction, we first obtained a response amplitude for each condition (T1 and T2) by averaging the time points around the peak (time points 2-5). Then for each pair of ROI (left vs. right), we performed a two-way repeated-measures ANOVA with factor attended object (T1 vs. T2) and hemisphere (left vs. right). We found no interaction effect among all areas (all p>0.07), suggesting no differential attentional modulation for left and right hemishperes associated with attending to the two objects. We also performed the same time course analysis for all ROIs using voxels that were selected for the classifier (see below) and obtained the same result—non-significant interaction between attended object and hemisphere (all p>0.10). Finally, we conducted a control experiment to further rule out the contribution of spatial attention (see section 3.6).
3.4 Multi-voxel pattern classification
Next we examined whether the patterns of brain activity varied as participants attended different objects by using multi-voxel pattern classification. In this analysis, we further combined the corresponding ROI in the left and right hemispheres to increase statistical power, except for M1, which was only present in the left hemisphere. We used Fisher linear discriminant analysis and a cross-validation procedure to evaluate the classifier performance (see Methods). In general, classifier performance increased rapidly at small voxel numbers but much more gradually afterwards. For the purpose of quantification, we plotted the maximal classification accuracy for each region (Figure 4A). The average number of voxels used for each area is shown in Figure 4C. We used a permutation test to evaluate whether these classification accuracies were significantly above chance using the same exact voxels. Figure 4B shows the average percentile rank of the observed accuracy in the null distributions generated by the permutation test. This value indicates the probability of obtaining the observed accuracy by chance and we used 5% tail as the criterion to determine statistical significance. The classifiers reliably differentiated the object-based attention conditions in all the visual areas (V1, V23, V4, hMT+ and V3AB7, LOC), parietal (IPS) and frontal cortex (FEF). Classification accuracies in other frontal regions (MFG, mSFG, INS, PCG and M1) were not significantly different from chance.
3.5 Control analyses for cue-evoked response
Because we used visual cues at the beginning of each trial to direct participant's attention, the classification results might be contributed by the sensory response to the cues. To evaluate this possibility, we performed two control analyses. In the first control analysis, we compared the classification accuracies using first and second half of the time series data within a trial (Figure 5A). If the visual cues can account for the classification results, we would predict higher classification accuracies in first half of the fMRI response than second half of the fMRI response, because the sensory response to the briefly presented cue should dissipate over time. We constructed two classifiers by using either the average response of first 4 time points (2.2 s-11 s) or the last 4 time points (11 s-19.8 s). The rest of the classification analysis was performed identically to the main analysis. There was no significant difference in classification accuracy for the first vs. second half response in any area (paired t-test, all p >.05).
Figure 5.
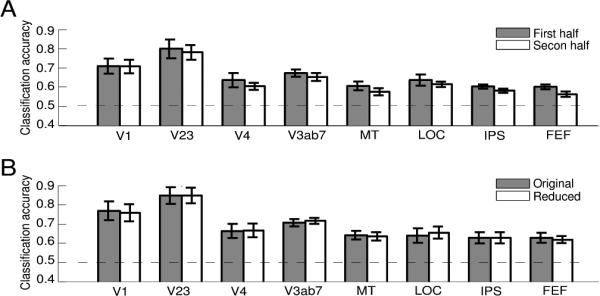
Results of the control analyses. (A). Mean classification accuracy using the first and second half data within a trial. (B). Mean classification accuracies of analysis with original ROIs (Original) and with reduced ROIs excluding voxels corresponding to the cues (Reduced). Error bars are ±1 s.e.m. across participants. Results are shown only for areas that showed significant classification performance; results for other areas were similar.
To further test the sensory effect of the cue, we conducted a second control analysis by excluding voxels that were directly stimulated by the cue. Recall that for each participant we also conducted the retinotopic mapping procedure, which included eccentricity mapping using expanding/contracting rings (see Methods). Thus for each voxel in a ROI we can use its phase in eccentricity mapping to infer its preferred retinal location. We excluded voxels whose response phase fell in the central 0.5° eccentricity (twice the size of the cue) and performed multi-voxel classification using the remaining voxels. If sensory response to the cue contributed to our pattern classification result, we should expect a decrease in accuracy using the reduced voxel set. However, we found no such decrease comparing classification accuracy from the reduced set voxels to the original set (Figure 5B, paired t-test, all p>.11). These control analyses showed that the observed classification accuracies were not driven by the sensory response to the attentional cues.
3.6 Control experiment for spatial attention
Although the two triangle objects in our experiment occupied the same overall location, they were not completely overlapping. In particular, the left and right corners of the two objects might provide anchors for employing a spatial attention strategy. That is, when cued to attend to object 1 (T1), participants attended to its left-pointing corner, and vice versa. We have argued against this possibility based on the task demands and the lack of contralateral attention effects. However, it might be that participants still used such a sub-optimal strategy and our protocol was not sensitive enough to detect such spatial biases. To evaluate how a spatial bias might contribute to our results, we conducted a control experiment, in which participants were explicitly instructed to attend to the corner region of the cued triangle (Figure 6A). We performed the same univariate analysis as in the attention experiment and conducted two-way repeated-measures ANOVA on the fMRI response amplitude with attended object (T1 vs. T2) and hemisphere (left vs. right) as factors. We found significant interactions between the two factors in both IPS (F(1,3)= 11.0, p<0.05) and FEF (F(1,3)= 10.1, p<0.05). The time course revealed a contralateral attention effect: attending to the left-pointing corner (T1) resulted in a larger fMRI response in the right hemisphere ROIs and vice versa (Figure 6B). There was an apparent asymmetry in this effect such that the difference between the two attention conditions was larger in the right than the left hemisphere. Although this result suggests a hemispheric asymmetry in the control of spatial attention, we should caution against any strong interpretation due to the small sample size. Importantly, however, the contralateral attentional effect stands in contrast with the lack of such effect in the main experiment. Thus we conclude that participants unlikely resorted to a spatial strategy to attend only to the corner region of the cued object in our main experiment.
4. Discussion
We studied the representations of attentional priority during an object-based selective attention task. By instructing participants to selectively attend to one of the spatially superimposed objects, we found identical fMRI response amplitude associated with attending to different objects using the univariate deconvolution analysis. However, using MVPC we were able to discern distinct neural patterns for different attended objects in both the dorsal frontoparietal network and visual cortex. We suggest that the distinct patterns in frontoparietal areas constitute top-down priority signals for object-based selection.
4.1 Object-based attention modulates response patterns in the visual cortex
In this study, we showed that attention to objects with dynamic feature properties can modulate both primary and extrastriate visual cortex in terms of multi-voxel activity patterns. Previous studies often employed superimposed faces and houses stimuli (O'Craven et al., 1999; Serences et al., 2004), and have demonstrated response amplitude changes due to object-based selection in category-selective visual areas FFA and PPA (Murray & Wojciulik, 2004; O'Craven et al., 1999; Serences et al., 2004). Our study employed simpler shapes to probe the early and intermediate levels of shape representation. Consistent with these early studies on category-selective high-level areas, our finding of successful classification of the attended object in LOC suggests that attention can modulate shape representations in this intermediate visual area (see also Stokes et al., 2009). Unlike previous studies, none of the brain areas showed an overall amplitude difference between attending to the two objects in our study. Thus, low-level differences that should affect overall response amplitude (e.g., size, contrast, brightness) cannot explain our results. Recent studies on scene categorization have also demonstrated different multi-voxel patterns for different scene categories in object-selective areas (Peelen et al., 2009; Peelen & Kastner, 2011). Our results are consistent with these results, which on a whole suggest that the intermediate and high-level visual areas could represent object identity in a rather abstract fashion.
Interestingly, we also observed significant classification in early stages of the visual hierarchy such as V1 and V2. Such results suggest that object-based selection can also modulate relatively early visual representations. Consistent with our findings, a recent study reported V1 modulation during surface-based selection (Ciaramitaro, Mitchell, Stoner, Reynolds, & Boynton, 2011). These authors reported a higher fMRI response amplitude when a transient target event occurred on the cued vs. uncued surface (object) composed of moving dots. However, these results could be partly driven by a bottom-up attentional capture effect due to the use of an exogenous attention cue and a transient target. Here we employed purely top-down attentional instructions and measured brain activity associated with the active maintenance of attention to visual objects. Thus our results complement and extend the finding of attentional modulation of V1 activity associated with transient visual targets (Ciaramitaro et al., 2011). Our results are also consistent with findings of significant decoding of attended orientation and direction in early visual areas using superimposed stimuli (Kamitani & Tong, 2005, 2006). One key difference is that in those studies the two stimuli differed by one simple feature, whereas more complex features distinguished our stimuli. Thus selection demands are likely more high-level and object-based in our study.
What are the possible neuronal mechanisms for modulation of early visual areas during object-based selection? One possibility is that attention can select high-level features such as the corners of the cued object. Given that some neurons in extrastriate areas are sensitive to such complex features (Hubel & Wiesel, 1965; Pasupathy & Connor, 2001), it seems plausible that attention can modulate their response. This explanation, however, cannot easily accommodate our finding of significant decoding in V1, where simple features such as orientation are represented. Interestingly, studies have also demonstrated V1 neuronal modulation due to object-level selection in a curve tracing task (Khayat et al., 2006; Roelfsema et al., 1998), which has been interpreted as attentional facilitation of horizontal connections that tend to connect neurons preferring collinear line elements and neurons with adjacent receptive fields (Schmidt, Goebel, Löwel, & Singer, 1997). A similar mechanism could be at work in our task such that the representation of the component parts of an object (e.g., line segments and vertices) can be linked together and enhanced in V1. Such neuronal enhancement could manifest as distinct multi-voxel activity patterns in fMRI BOLD measures. This scenario is akin to the “grouped array” account of object-based selection (Kramer, Weber, & Watson, 1997), which suggests that attention can be applied selectively to a shape outline and dynamically updated. Thus object-based selection could be implemented by sophisticated combination of spatial- and feature-level selections. Although this is a possible interpretation of our data, we should note that such a view of object-based selection is quite different from typically studied forms of spatial and feature selection which involves selection along a single dimension with large (often maximum) difference (e.g., left vs. right hemifield, upward vs. downward motion). Future studies with higher spatial and temporal resolution data could shed light on the nature of early visual modulation during object-based selection. Our current results suggest that attentional selection is a highly flexible mechanism that can highlight the prioritized object at multiple processing levels, from image-based representations in early visual areas, to object-based representations in LOC.
4.2 Domain general network of attention control
Here we showed that neural activities in FEF and IPS can be used to differentiate specific attended objects. This finding, together with previous work showing the importance of these areas in maintaining spatial attention (Silver et al., 2005; Szczepanski, Konen, & Kastner, 2010) and feature-based attention (Egner et al., 2008; Liu et al., 2011), suggest the dorsal frontoparietal areas contain domain-general control signals for different types of attention. Earlier studies which directly compared overall brain activity for spatial and object-based attention (Fink, Dolan, Halligan, Marshall, & Frith, 1997; Wojciulik & Kanwisher, 1999) also found largely overlapped brain networks active for different types of attention task. Here we further demonstrated that the distributed pattern of neural activity in these areas correlated with the specific attended object, a neural signature for attentional priority signal (see below for further discussion). The notion of a domain general network for the maintenance of attention is also complimentary to findings on attentional shift. Shifts of attention consistently evokes a transient response in a medial superior parietal lobule region (Liu, Slotnick, Serences, & Yantis, 2003; Serences et al., 2004; Yantis et al., 2002), which is thought to be domain general for resetting the current focus of attention. Thus current evidence supports the notion that the dorsal frontoparietal network controls both the shift and maintenance of attention in a variety of domains.
4.3 Priority signals for object-based selection
Accumulating evidences suggest frontal and parietal regions like FEF and IPS contain topographical representation of spatial locations (Silver & Kastner, 2009; Szczepanski et al., 2010) which direct spatial attention to important locations via feedback to visual cortex. Such findings support the theoretical proposal of the priority maps (Itti & Koch, 2001; Koch & Ullman, 1985; Wolfe, 1994), which encode the distribution of attentional resources in space. Although the notion of attentional priority map can accommodate a large number of findings in spatial attention, it does not explain how selective attention can operate on more abstract dimensions such as perceptual objects.
In this study, we found object-specific neural patterns in dorsal frontoparietal areas, suggesting these areas represent priority information for selected objects. We suggest these object-specific priority signals form the neural substrates for top-down modulation that highlight which particular object to attend. Such top-down modulation can select and sustain distinct neural activity patterns in the visual cortex to serve behavioral goals, reflected by the observed significant classification in visual areas. Thus neural signals in the dorsal frontoparietal areas seem to be sufficiently abstract to represent the current focus of attention, when attention needs to select an object which shares similar location and feature as a distracter.
We can only speculate about the format of such object-level priority signals. Because neurons in frontoparietal areas have spatial selectivity, one possibility is that priority is represented by assembly of neurons whose spatial receptive fields coincide with the attended object. This is essentially the implementation of the “grouped array” account of object-based selection in high level cortex. An alternative is that neurons in these areas develop genuine selectivity for whole objects or complex features that can bias attentional selection. This latter scenario is consistent with recent findings of feature-specific responses in selection tasks (Liu et al., 2011; Serences & Boynton, 2007) and findings that implicate these areas in other non-spatial tasks (e.g., Bichot, Schall, & Thompson, 1996; Konen & Kastner, 2008; Oristaglio, Schneider, Balan, & Gottlieb, 2006). Indeed, the posterior parietal cortex has been shown to represent abstract rule-based categorical distinctions in visual category learning tasks (Fitzgerald, Swaminathan, & Freedman, 2012), suggesting a possible multiplexed representation of both spatial and non-spatial properties. These additional considerations lead us to favor the interpretation of selectivity for object identity, not its location, that underlies our results, but more research is needed to further characterize the nature of attentional priority signals in dorsal frontoparietal areas.
5. Conclusions
Using multi-voxel pattern classification, we found distinct patterns of neural activity associated with attending to different objects in both the visual cortex and frontoparietal regions. We further ruled out explanations based on spatial attention effects and sensory effects of the cue. These results suggest that neural activity in early visual cortex can be modulated by object-based attention and the dorsal frontoparietal network contains priority information for object-specific top-down modulation.
Highlights.
Object-based attention is manipulated using dynamic superimposed stimuli.
MVPA is employed to classify content-specific attentional state.
Significant classification is found in early and intermediate visual areas.
Significant classification is also found in dorsal frontoparietal areas.
Acknowledgements
We thank Scarlett Doyle and David Zhu for help in data collection and the Department of Radiology at Michigan State University for the support of imaging research. This work was supported in part by a grant from the National Institutes of Health (1R01EY022727) to T.L.
Footnotes
Publisher's Disclaimer: This is a PDF file of an unedited manuscript that has been accepted for publication. As a service to our customers we are providing this early version of the manuscript. The manuscript will undergo copyediting, typesetting, and review of the resulting proof before it is published in its final citable form. Please note that during the production process errors may be discovered which could affect the content, and all legal disclaimers that apply to the journal pertain.
References
- Bichot NP, Schall JD, Thompson KG. Visual feature selectivity in frontal eye fields induced by experience in mature macaques. Nature. 1996;381:697–699. doi: 10.1038/381697a0. [DOI] [PubMed] [Google Scholar]
- Bisley JW, Goldberg ME. Attention, intention, and priority in the parietal lobe. Annual Review of Neuroscience. 2010;33:1–21. doi: 10.1146/annurev-neuro-060909-152823. [DOI] [PMC free article] [PubMed] [Google Scholar]
- Blaser E, Pylyshyn ZW, Holcombe AO. Tracking an object through feature space. Nature. 2000;408:196–199. doi: 10.1038/35041567. [DOI] [PubMed] [Google Scholar]
- Ciaramitaro VM, Mitchell JF, Stoner GR, Reynolds JH, Boynton GM. Object-based attention to one of two superimposed surfaces alters responses in human early visual cortex. Journal of Neurophysiology. 2011;105(3):1258–1265. doi: 10.1152/jn.00680.2010. [DOI] [PMC free article] [PubMed] [Google Scholar]
- De Martino F, Valente G, Staeren N, Ashburner J, Goebel R, Formisano E. Combining multivariate voxel selection and support vector machines for mapping and classification of fMRI spatial patterns. Neuroimage. 2008;43(1):44–58. doi: 10.1016/j.neuroimage.2008.06.037. [DOI] [PubMed] [Google Scholar]
- DeYoe EA, Carman GJ, Bandettini P, Glickman S, Wieser J, Cox R, et al. Mapping striate and extrastriate visual areas in human cerebral cortex. Proceedings of the National Academy of Sciences U S A. 1996;93:2382–2386. doi: 10.1073/pnas.93.6.2382. [DOI] [PMC free article] [PubMed] [Google Scholar]
- Duncan J. Selective attention and the organization of visual information. Journal of Experimental Psychology: General. 1984;113:501–517. doi: 10.1037//0096-3445.113.4.501. [DOI] [PubMed] [Google Scholar]
- Egner T, Monti JM, Trittschuh EH, Wieneke CA, Hirsch J, Mesulam MM. Neural integration of top-down spatial and feature-based information in visual search. Journal of Neuroscience. 2008;28:6141–6151. doi: 10.1523/JNEUROSCI.1262-08.2008. [DOI] [PMC free article] [PubMed] [Google Scholar]
- Engel SA, Glover GH, Wandell BA. Retinotopic organization in human visual cortex and the spatial precision of functional MRI. Cerebral Cortex. 1997;7:181–192. doi: 10.1093/cercor/7.2.181. [DOI] [PubMed] [Google Scholar]
- Fink GR, Dolan RJ, Halligan PW, Marshall JC, Frith CD. Space-based and object-based visual attention: shared and specific neural domains. Brain. 1997;120:2013–2028. doi: 10.1093/brain/120.11.2013. [DOI] [PubMed] [Google Scholar]
- Fitzgerald JK, Swaminathan SK, Freedman DJ. Visual categorization and the parietal cortex. Frontiers in Integrative Neuroscience. 2012;6:18. doi: 10.3389/fnint.2012.00018. [DOI] [PMC free article] [PubMed] [Google Scholar]
- Grill-Spector K, Kourtzi Z, Kanwisher N. The lateral occipital complex and its role in object recognition. Vision Research. 2001;41:1409–1422. doi: 10.1016/s0042-6989(01)00073-6. [DOI] [PubMed] [Google Scholar]
- Heeger DJ, Boynton GM, Demb JB, Seidemann E, Newsome WT. Motion opponency in visual cortex. Journal of Neuroscience. 1999;19:7162–7174. doi: 10.1523/JNEUROSCI.19-16-07162.1999. [DOI] [PMC free article] [PubMed] [Google Scholar]
- Hubel DH, Wiesel TN. Receptive Fields and Functional Architecture in Two Nonstriate Visual Areas (18 and 19) of the Cat. Journal of Neurophysiology. 1965;28:229–289. doi: 10.1152/jn.1965.28.2.229. [DOI] [PubMed] [Google Scholar]
- Itti L, Koch C. Computational modelling of visual attention. Nature Reviews Neuroscience. 2001;2:194–203. doi: 10.1038/35058500. [DOI] [PubMed] [Google Scholar]
- Kamitani Y, Tong F. Decoding the visual and subjective contents of the human brain. Nature Neuroscience. 2005;8:679–685. doi: 10.1038/nn1444. [DOI] [PMC free article] [PubMed] [Google Scholar]
- Kamitani Y, Tong F. Decoding seen and attended motion directions from activity in the human visual cortex. Current Biology. 2006;16:1096–1102. doi: 10.1016/j.cub.2006.04.003. [DOI] [PMC free article] [PubMed] [Google Scholar]
- Kanwisher N, Driver J. Objects, attributes and visual attention: which, what and where. Current Directions in Psychological Science. 1992;1:26–31. [Google Scholar]
- Khayat PS, Spekreijse H, Roelfsema PR. Attention lights up new object representations before the old ones fade away. The Journal of neuroscience. 2006;26(1):138. doi: 10.1523/JNEUROSCI.2784-05.2006. [DOI] [PMC free article] [PubMed] [Google Scholar]
- Koch C, Ullman S. Shifts in selective visual attention: towards the underlying neural circuitry. Human Neurobiology. 1985;4:219–227. [PubMed] [Google Scholar]
- Konen CS, Kastner S. Two hierarchically organized neural systems for object information in human visual cortex. Nature Neuroscience. 2008;11:224–231. doi: 10.1038/nn2036. [DOI] [PubMed] [Google Scholar]
- Kramer AF, Weber TA, Watson SE. Object-based attentional selection--grouped arrays or spatially invariant representations?: comment on Vecera and Farah (1994). Journal of Experimental Psychology: General. 1997;126:3–13. doi: 10.1037//0096-3445.126.1.3. [DOI] [PubMed] [Google Scholar]
- Liu T, Hospadaruk L, Zhu DC, Gardner JL. Feature-specific attentional priority signals in human cortex. Journal of Neuroscience. 2011;31:4484–4495. doi: 10.1523/JNEUROSCI.5745-10.2011. [DOI] [PMC free article] [PubMed] [Google Scholar]
- Liu T, Slotnick SD, Serences JT, Yantis S. Cortical mechanisms of feature-based attentional control. Cerebral Cortex. 2003;13:1334–1343. doi: 10.1093/cercor/bhg080. [DOI] [PubMed] [Google Scholar]
- Maunsell JHR, Treue S. Feature-based attention in visual cortex. Trends in Neurosciences. 2006;29:317–322. doi: 10.1016/j.tins.2006.04.001. [DOI] [PubMed] [Google Scholar]
- Murray SO, Wojciulik E. Attention increases neural selectivity in the human lateral occipital complex. Nature Neuroscience. 2004;7(1):70–74. doi: 10.1038/nn1161. [DOI] [PubMed] [Google Scholar]
- Nichols TE, Holmes AP. Nonparametric permutation tests for functional neuroimaging: a primer with examples. Human Brain Mapping. 2002;15:1–25. doi: 10.1002/hbm.1058. [DOI] [PMC free article] [PubMed] [Google Scholar]
- O'Craven KM, Downing PE, Kanwisher N. fMRI evidence for objects as the units of attentional selection. Nature. 1999;401:584–587. doi: 10.1038/44134. [DOI] [PubMed] [Google Scholar]
- Oristaglio J, Schneider DM, Balan PF, Gottlieb J. Integration of visuospatial and effector information during symbolically cued limb movements in monkey lateral intraparietal area. Journal of Neuroscience. 2006;26:8310–8319. doi: 10.1523/JNEUROSCI.1779-06.2006. [DOI] [PMC free article] [PubMed] [Google Scholar]
- Pasupathy A, Connor CE. Shape representation in area V4: position-specific tuning for boundary conformation. Journal of Neurophysiology. 2001;86:2505–2519. doi: 10.1152/jn.2001.86.5.2505. [DOI] [PubMed] [Google Scholar]
- Peelen MV, Fei-Fei L, Kastner S. Neural mechanisms of rapid natural scene categorization in human visual cortex. Nature. 2009;460:94–97. doi: 10.1038/nature08103. [DOI] [PMC free article] [PubMed] [Google Scholar]
- Peelen MV, Kastner S. A neural basis for real-world visual search in human occipitotemporal cortex. Proceedings of the National Academy of Sciences U S A. 2011;108:12125–12130. doi: 10.1073/pnas.1101042108. [DOI] [PMC free article] [PubMed] [Google Scholar]
- Posner MI. Orienting of attention. Quarterly Journal of Experimental Psychology. 1980;32:3–25. doi: 10.1080/00335558008248231. [DOI] [PubMed] [Google Scholar]
- Paus T. Location and function of the human frontal eye-field: a selective review. Neuropsychologia. 1996;34:475–483. doi: 10.1016/0028-3932(95)00134-4. [DOI] [PubMed] [Google Scholar]
- Roelfsema PR, Lamme VAF, Spekreijse H. Object-based attention in the primary visual cortex of the macaque monkey. Nature. 1998;395:376–381. doi: 10.1038/26475. [DOI] [PubMed] [Google Scholar]
- Saenz M, Buracas GT, Boynton GM. Global effects of feature-based attention in human visual cortex. Nature Neuroscience. 2002;5(7):631–632. doi: 10.1038/nn876. [DOI] [PubMed] [Google Scholar]
- Schmidt KE, Goebel R, Löwel S, Singer W. The perceptual grouping criterion of colinearity is reflected by anisotropies of connections in the primary visual cortex. European Journal of Neuroscience. 1997;9:1083–1089. doi: 10.1111/j.1460-9568.1997.tb01459.x. [DOI] [PubMed] [Google Scholar]
- Serences JT, Boynton GM. Feature-based attentional modulations in the absence of direct visual stimulation. Neuron. 2007;55:301–312. doi: 10.1016/j.neuron.2007.06.015. [DOI] [PubMed] [Google Scholar]
- Serences JT, Schwarzbach J, Courtney SM, Golay X, Yantis S. Control of object-based attention in human cortex. Cerebral Cortex. 2004;14:1346–1357. doi: 10.1093/cercor/bhh095. [DOI] [PubMed] [Google Scholar]
- Sereno MI, Dale AM, Reppas JB, Kwong KK, Belliveau JW, Brady TJ, et al. Borders of multiple visual areas in humans revealed by functional magnetic resonance imaging. Science. 1995;268:889–893. doi: 10.1126/science.7754376. [DOI] [PubMed] [Google Scholar]
- Silver MA, Kastner S. Topographic maps in human frontal and parietal cortex. Trends in Cognitive Sciences. 2009;13:488–495. doi: 10.1016/j.tics.2009.08.005. [DOI] [PMC free article] [PubMed] [Google Scholar]
- Silver MA, Ress D, Heeger DJ. Topographic maps of visual spatial attention in human parietal cortex. Journal of Neurophysiology. 2005;94:1358–1371. doi: 10.1152/jn.01316.2004. [DOI] [PMC free article] [PubMed] [Google Scholar]
- Swisher JD, Halko MA, Merabet LB, McMains SA, Somers DC. Visual topography of human intraparietal sulcus. Journal of Neuroscience. 2007;27:5326–5337. doi: 10.1523/JNEUROSCI.0991-07.2007. [DOI] [PMC free article] [PubMed] [Google Scholar]
- Szczepanski SM, Konen CS, Kastner S. Mechanisms of spatial attention control in frontal and parietal cortex. Journal of Neuroscience. 2010;30:148–160. doi: 10.1523/JNEUROSCI.3862-09.2010. [DOI] [PMC free article] [PubMed] [Google Scholar]
- Stokes M, Thompson R, Nobre AC, Duncan J. Shape-specific preparatory activity mediates attention to targets in human visual cortex. Proceedings of the National Academy of Sciences of the United States of America. 2009;106:19569–19574. doi: 10.1073/pnas.0905306106. [DOI] [PMC free article] [PubMed] [Google Scholar]
- Thompson KG, Bichot NP. A visual salience map in the primate frontal eye field. Progress in Brain Research. 2005;147:251–262. doi: 10.1016/S0079-6123(04)47019-8. [DOI] [PubMed] [Google Scholar]
- Treisman AM, Gelade G. A feature-integration theory of attention. Cognitive Psychology. 1980;12:97–136. doi: 10.1016/0010-0285(80)90005-5. [DOI] [PubMed] [Google Scholar]
- van Essen DC. A Population-Average, Landmark- and Surface-based (PALS) atlas of human cerebral cortex. Neuroimage. 2005;28(3):635–662. doi: 10.1016/j.neuroimage.2005.06.058. [DOI] [PubMed] [Google Scholar]
- Watson JD, Myers R, Frackowiak RS, Hajnal JV, Woods RP, Mazziotta JC, et al. Area V5 of the human brain: evidence from a combined study using positron emission tomography and magnetic resonance imaging. Cerebral Cortex. 1993;3:79–94. doi: 10.1093/cercor/3.2.79. [DOI] [PubMed] [Google Scholar]
- Wojciulik E, Kanwisher N. The generality of parietal involvement in visual attention. Neuron. 1999;23:747–764. doi: 10.1016/s0896-6273(01)80033-7. [DOI] [PubMed] [Google Scholar]
- Wolfe JM. Guided Search 2.0: a revised model of visual search. Psychonomic Bulletin & Review. 1994;1:202–238. doi: 10.3758/BF03200774. [DOI] [PubMed] [Google Scholar]
- Yamashita O, Sato M, Yoshioka T, Tong F, Kamitani Y. Sparse estimation automatically selects voxels relevant for the decoding of fMRI activity patterns. Neuroimage. 2008;42(4):1414–1429. doi: 10.1016/j.neuroimage.2008.05.050. [DOI] [PMC free article] [PubMed] [Google Scholar]
- Yantis S, Schwarzbach J, Serences JT, Carlson RL, Steinmetz MA, Pekar JJ, et al. Transient neural activity in human parietal cortex during spatial attention shifts. Nature Neuroscience. 2002;5:995–1002. doi: 10.1038/nn921. [DOI] [PubMed] [Google Scholar]
- Zhang Y, Meyers EM, Bichot NP, Serre T, Poggio TA, Desimone R. Object decoding with attention in inferior temporal cortex. Proceedings of the National Academy of Sciences U S A. 2011;108:8850–8855. doi: 10.1073/pnas.1100999108. [DOI] [PMC free article] [PubMed] [Google Scholar]