
Figure 4.
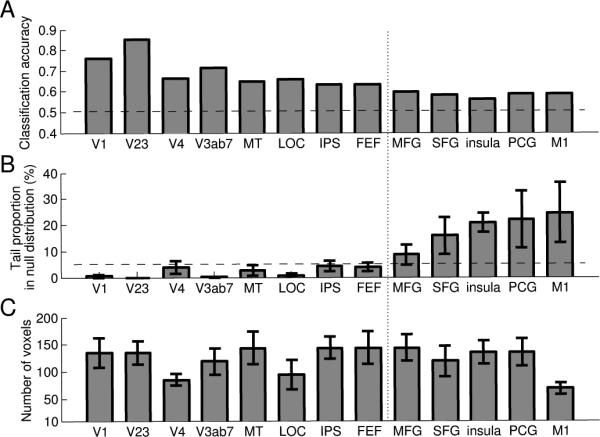
Multi-voxel pattern classification results. (A). Mean classification accuracy across participants (N=6) for each brain area. Horizontal line indicates 50% accuracy, the theoretical chance level. (B). Average percentile ranks that the observed classification accuracy fell in the null distribution of chance performance, obtained by permutation test. Horizontal dashed line indicates 5% tail in the null distribution. The vertical dotted line separates areas with significant vs. non-significant classification accuracies as assessed by the permutation test. (C). Average size of the classifier (number of voxels) for each brain area corresponding to the maximum classification accuracy (plotted in A). Error bars are ±1 s.e.m. across participants.