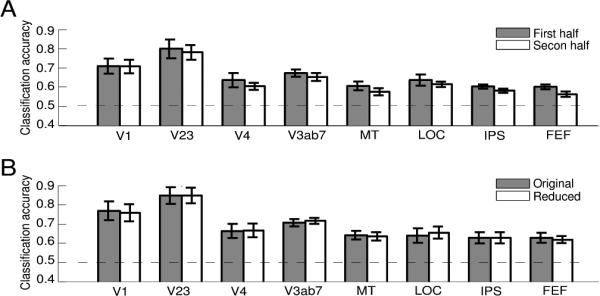
Figure 5.

Results of the control analyses. (A). Mean classification accuracy using the first and second half data within a trial. (B). Mean classification accuracies of analysis with original ROIs (Original) and with reduced ROIs excluding voxels corresponding to the cues (Reduced). Error bars are ±1 s.e.m. across participants. Results are shown only for areas that showed significant classification performance; results for other areas were similar.
