Abstract
The main contribution of this paper is to use homogenization techniques to compute diffusion coefficients from experimental images of microbial biofilms. Our approach requires the analysis of several experimental spatial structures of biofilms in order to derive from them a Representative Volume Element (RVE). Then, we apply a suitable numerical procedure to the RVE to derive the diffusion coefficients. We show that diffusion coefficients significantly vary with the biofilm structure. These results suggest that microbial biofilm structures can favour nutrient access in some cases.
Keywords: Homogenization technique, Diffusion process, Nutrient access, Bacterial biofilms
Introduction
In natural, industrial and clinical settings, bacteria predominantly live in surface-associated communities called biofilms [1]. These biofilms, like other bacterial communities, play a major role in many industrial processes such as wastewater treatment [2], biocorrosion [3], biotechnology [4, 5] or medical science [6, 7]. In many of these processes, solute transport in the biofilm is a key issue, because it drives the biofilm development. Solutes are transported in bacterial biofilms by a combination of advection, convection and diffusion, in which molecular diffusion dominates [8, 9]. Mathematically, a diffusion process can be completely defined by the assessment of the effective diffusion tensor  that characterizes the diffusion process in all directions, and the objective of this paper is to assess such a diffusion tensor in bacterial biofilms, from the treatment of images.
Several experimental studies have shown that different factors, for example the bacteria strain, the reactivity of the solutes or the density of bacteria, directly influence the nutrient diffusion. These studies use different bacteria strains such as Escherichiacoli [10] or Zoogloearamigera [11]. The cell density varies from one bacteria strain to another and this drastically affects the calculation of the effective diffusion. For instance, the cell density for E. coli is lower than the cell density for Z. ramigera [12, 13] and leads to a lower value of the effective diffusion. The reactivity of solutes has also been studied in order to evaluate its influence on the diffusion process. Matson and Characklis [14] have studied the diffusion of glucose through microbial aggregates under various experimental conditions. Methanol solutes [15] or lactate solutes [16] have also been used to determine the effective diffusion of biofilms. The main conclusion is that the reactivity of the solute has a significant influence on the diffusion process because some solutes can cross cell membranes and be diffused within the cells while others are excluded by the cell membrane (see [17] for a review of the different experimental measurements of the effective diffusion coefficient).
Lamotta [18] has developed a theoretical model describing the diffusion of substrate within the film matrix. He computed the effective diffusivity of glucose in biological films and showed that the fraction of substrate consumed is directly proportional to the film thickness, when the thickness is less than a critical value. These studies determine the effective diffusion in biofilms and the influence of microscopic structures on biofilm macroscopic properties [19–22]. The effective diffusion coefficient is generally assumed to be a function of both the microscopic diffusions of the extra polysaccharide matrix and the cell aggregates [23]. Therefore, effective diffusion within a biofilm is assumed to be a function of both microscopic diffusion and microstructure [23, 24].
Bacterial biofilms show very complex heterogeneous structures [25, 26], which are certainly related to their performances in different industrial processes. During the last few decades, the use of confocal microscopes has given access to the 2D and 3D observations of biofilm structures such as regular aggregates [27, 28], mushroom shapes [29, 30], holes or labyrinths [31]. Moreover, new techniques have been coupled with the microscope such as fluorescence microscopy [31] showing the location and evolution of bacteria strains in the whole biofilm. The freeze substitution technique [32] also provides images of the biofilm in its original state and with more precise structural details than a standard confocal microscope. These techniques give new means for observing bacterial local behaviors, the detachment process and bacteria competition.
In this paper, we show that the diffusion properties of bacterial biofilms can be derived from the treatment of images taken from a confocal microscope, by using appropriate homogenization techniques. The first part of the paper is dedicated to the description of the experimental set-up from a previous study [31], providing the biofilm images. The second part of the paper is devoted to the application of homogenization techniques to these images and the derivation of the effective diffusion tensor, through the derivation of a representative volume element and the use of finite element software. Finally, the paper discusses the impact of the spatial structure on the effective diffusion.
Materials and methods
Experimental set-up
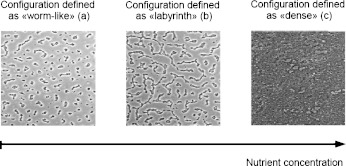
We use the biofilm images from Xavier et al. [31], devoted to the development of Pseudomonas aeruginosa. Experimental details are available in [31]. The typical spatial structures of biofilms obtained are represented in Fig. 1. Three types of structures can be distinguished: “worm-like” (Fig. 1a), “labyrinth” (Fig. 1b) and “dense” (Fig. 1c).
Fig. 1.
Example of spatial patterns in biofilms of Pseudomonas aeruginosa. Biofilms are cultivated on glass coverslips. The spatial structures are obtained from the same biofilm at different times by a variation of the nutrient concentration
These images represent the same biofilm at different times, when varying the nutrient concentration. The “worm-like” configuration is obtained when the substrate concentration is low, which leads to an intense competition for the nutrient. When the substrate concentration increases, this competition decreases, and the circular colonies are deformed due to fingering [31, 33] leading to the “labyrinth” configuration. If the nutrient concentration is saturated, all bacteria have nutrient access, the nutrient competition becomes negligible and the biofilm growth rapidly reaches the “dense” configuration.
We consider these spatial structures as typical examples of the diversity observed in biofilms, and for testing our approach.
Homogenization techniques
Principle
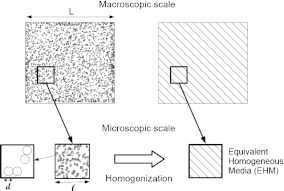
The main purpose of homogenization techniques is to derive macroscopic properties from data at microscopic scale. These techniques have been successfully used in several applications, especially in mechanics of continuous materials [34–37]. The first step of the homogenization approach is computing a representative volume element (RVE) which must be an infinitesimal part of the considered system but still large enough for capturing the geometric and physical properties of the system. More precisely, if we denote d, the characteristic length scale of the local heterogeneities, typically the cell size in a bacterial biofilm, the size l of the RVE should fulfill the condition d << l to ensure that the elementary volume is representative. In summary, the two conditions on the size of the RVE are (L being the size of the considered system, see Fig. 2):
 |
1 |
Relation (1) is often referred to as the scale separation condition, which is a necessary condition for the RVE to be valid. In order to compute appropriate values of l, we perform a convergence study by calculating the homogenized quantities according to several RVE sizes.
Fig. 2.
Schematic description of the homogenization process. This upscaling method allows us to pass from the microscopic scale to the macroscopic scale thanks to the study of a representative volume element
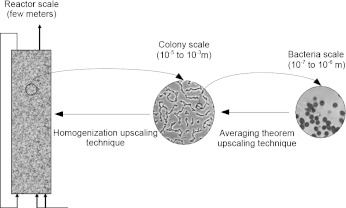
The Wood and Whitaker approach, which requires the resolution of the closure problem to solve the upscaling problem, is commonly used in order to investigate the effective diffusion of substrate into a bacterial biofilm [38, 39]. Wood and Whitaker need to solve this closure problem because they work at the bacteria scale. We work at the colony scale and applying suitable boundary conditions allows us to solve the upscaling problem. Figure 3 illustrates this difference of scale between Wood and Whitaker’s approach and ours.
Fig. 3.
The hierarchy of scales associated with a bacterial biofilm
Theoretical background
In this study, the biofilm images are in two dimensions. We therefore model the stationary diffusion process with Fick’s first law in two dimensions:
 |
2 |
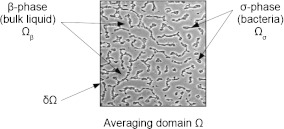
where F corresponds to the diffusive flux vector expressed in mol.μm−2.s−1, D to the diffusion tensor expressed in μm2.s−1 and  to the concentration gradient vector expressed in mol.μm−4. In this study, we have considered a two-phase system consisting of the bacteria colony (the σ-phase) in domain Ωσ and the bulk liquid (the β-phase) in domain Ωβ (see Fig. 4). At the microscopic scale, the first Fick’s law writes:
 |
3 |
 |
4 |
The idea is to calculate the effective diffusion  on the domain Ω defined as follows:
 |
5 |
We define the volume average theorem considering that  is independent of the location:
 |
6 |
where <F> and  are the spatial average flux and concentration gradients, which are the sum of the superficial average flux and concentration gradients of the two phases, respectively:
 |
7 |
 |
8 |
Then, we consider concentration gradients  at the boundary δΩ (see Fig. 4). Using the gradient theorem
  , we obtain the following relation:
 |
9 |
 |
10 |
where δij is the Kronecker delta.
Fig. 4.
Definition of the two phases associated with the average domain
We finally obtain:
 |
11 |
It yields the following relationship between the microscopic concentration gradient  and the macroscopic concentration gradient
  with the average operator:
 |
12 |
Finally,  is identified:
 |
13 |
In the current approach, we consider a two-dimensional problem depending on the x- and y-directions. In this case, the effective tensor  is:
is:
 |
14 |
Note that in the case of an isotropic behavior, this tensor is diagonal, with  . However, in general, some couplings between the x- and y-directions may occur and it is necessary to calculate the complete effective diffusion matrix. Some analytical solutions have been developed in the literature in some simple cases (see Section 2.3). These analytical solutions will be used as reference solutions in the following but, in general, it is not possible to apply them and we use a numerical procedure instead.
Numerical procedure
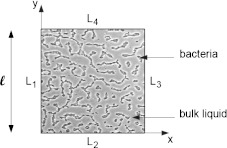
The size of the biofilm images is 360 × 360 μm2. Biofilm images have been imported into Inkscape. The resolution of the images is 750 × 750 pixels and they have been converted into .dxf format. We have adopted the thresholding process by brightness cutoff with a single path from biofilm images. It has been used to create binary images in order to export them to the Finite Element software Comsol 3.3. The Inkscape software uses the vectorization engine Potrace (potrace.sourceforge.net). The geometry is then discretized with 2D triangular elements (see Fig. 5). In order to determine  (see Eq. 13), it is necessary to perform two tests for the assessment of the effective diffusion coefficients (see Fig. 6). For this purpose, we consider a square RVE (with the length of the side equal to l). For the first test, we impose:
  , leading to:
 |
15 |
For the second test, we impose:  . It leads to:
 |
16 |
From these tests and using Eq. 13, the components of the effective diffusion matrix are calculated as follows:
 |
17 |
 corresponds to the numerical integration of the component i of the vector F for the kth test. These numerical tests enable us to assess the effective diffusion matrix. In order to validate the current procedure and to highlight the influence of the spatial structure, analytical solutions are now presented.
Fig. 5.
Description of the numerical method. The experimental images are thresholded in order to export them to the finite element software. Then, the geometry is meshed in order to apply the homogenization method
Fig. 6.
Boundary conditions are imposed on different edges L1, L2, L3 and L4 of the considered RVE
Analytical solutions
As explained in the Introduction, different models have been developed in order to calculate the effective properties through heterogeneous media. These models are essentially based on the assumption of a uniform distribution of bacteria or charged spheres for example. The influence of the spatial structure is neglected in this type of model which uses a mean field approximation of the effective properties. For example, Maxwell’s solutions have been already used in order to calculate the effective conductivity of a two-material conductor or the effective diffusion coefficient for multiphase systems. Indeed, in the following, we used Maxwell’s solution [40] which takes the form:
 |
18 |
with
 |
19 |
Sσ is the surface of the σ-phase and Stot is the total surface of the domain. We can also refer to the solution obtained by Chang [41] for calculating effective diffusion and conduction in two-phase media. Chang has solved the effective diffusion and conduction in a two-dimensional square unit cell with a circular particle. The effective diffusion takes the form:
 |
20 |
Both analytical solutions can be used in order to calculate effective properties in two-phase media. They have been already used as reference solutions for effective diffusion in the case of bacterial biofilms [22, 38, 39].
Results
RVE convergence
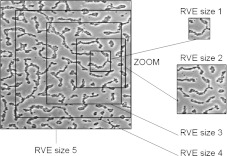
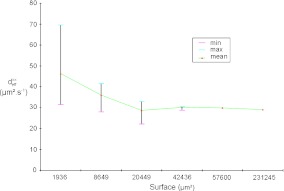
We perform a convergence study to determine the suitable size of the RVE. Moreover, we investigate the variation of the homogenized parameter, here, the effective diffusion, according to different RVE sizes. In Fig. 7, we can see different sizes of RVE that we tested. The different RVE sizes are: RVE 1: 44 μm × 44 μm, RVE 2: 93 μm × 93 μm, RVE 3: 143 μm × 143 μm, RVE 4: 206 μm × 206 μm, RVE 5: 240 μm × 240 μm. The results obtained in the case of the labyrinth configuration are presented in Fig. 8 as an example. It shows the evolution of  following the surface of the RVE. The “min/max” bar enables us to characterize the scattering of the results which is directly linked to the representativeness of the RVE. Indeed, if the minimum value is close to the maximum value computed by the current procedure, all RVEs lead to the same result. In this case, we can conclude that the RVE leads to a good representation of the volume. This phenomenon is clearly shown in Fig. 8. The “min/max” bar is significant for small surfaces of RVE, and decreases with respect to the RVE surface. For small surfaces, it means that all RVEs with this area have homogeneous properties. Moreover, the mean value converges for an RVE area greater than 40000 μm2. In this configuration, i.e., the labyrinth configuration, we can conclude that a domain with a size of 200 μm by 200 μm is representative. In the following, we therefore perform calculations with an RVE area of 48400 μm2 in order to completely minimize the scattering of the results. We have also carried out the same study on the two other configurations (dense and worm-like configurations) and we have concluded that the RVE with an area of 48400 μm2 for both configurations is also representative.
Fig. 7.
A convergence study has been performed on different RVE sizes. It allows us to define a suitable RVE size in order to apply the homogenization technique
Fig. 8.
This graph represents the calculation of the homogenized parameter  according to the RVE size. There is a high degree of scattering (high gap between the minimum and the maximum values of homogenized rigidity) for small surfaces of RVE. This study allows us to conclude that an RVE with a size of 200 μm by 200 μm is representative of the full domain
Calculation of the effective diffusion
Homogenization techniques are now applied to the three biofilm spatial structures that can be observed in Fig. 1. For the tests described in Section 2, we have used a = 10 and l = 220 μm. The value of a has no influence on the results because of the linearity of the Fick equation (see Eq. 2). The length l is directly deduced from the convergence study of the RVE, described in the preceding section.
Then, we have to choose the diffusion coefficient of the colony and of the bulk liquid. Experimental studies have shown that, in all cases, the biofilm diffusion coefficients were lower than the diffusion in the bulk liquid solution, denoting a degree of hindered diffusion in the biofilm [42–44]. We have decided to impose a value Dσ of the diffusion within the colony equal to 1 μm2.s−1 and a value Dβ of the diffusion in the bulk liquid equal to 100 μm2.s−1. These values are on the same order of magnitude as the different experimental values presented in the literature [42–44]. The ratio between these two coefficients plays a major role and is analyzed in Section 3.3.
The idea is to perform the calculation in the case of a negligible diffusion within colonies. In the following, the calculations depend on the ratio ε between the area occupied by the colonies and the total area:
 |
21 |
In this study, this ratio varies according to the spatial configuration. Indeed, it is equal to 0.97, 0.33, 0.17 for dense, labyrinth and worm-like configurations, respectively.
We have obtained the following diffusion tensor for the dense configuration:
 |
22 |
For the labyrinth configuration, calculations lead to:
 |
23 |
Finally, for the worm-like configuration, we have:
 |
24 |
In the “dense” configuration case, the nutrient concentration is high. Since there is no nutrient competition between cells, the biofilm growth is therefore significant and leads to a dense biofilm. Indeed, bacteria fill the whole domain, and the ratio ε (equal to 0.97) is almost maximal. Consequently, the effective diffusion is low and the diffusion process has a minor role. Note that the value of effective diffusion is close to the parameter of diffusion in the colony (Dσ = 1 μm2.s−1).
In the case of “worm-like” configuration, the nutrient concentration is limited. The nutrient competition between cells is very high and the growth condition is therefore unfavorable; thus, small colonies form the biofilm. The colony density is low and leads to the highest value of the effective diffusion.
The “labyrinth” configuration is an intermediate case between both previous cases. The nutrient concentration is higher than in the “worm-like” case, there is a competition for nutrient, but the growth is heterogeneous in space. The value of effective diffusion is between the previous values. This configuration may be due to the phenomena of fingering and mechanical pushing. The substrate diffusion is facilitated along the direction created by both phenomena. However, the substrate diffusion remains lower than in the case of the worm-like configuration because of the spatial structure and the higher ratio ε.
It is interesting to note that for the three spatial structures, non-diagonal terms ( and
and  can be neglected in comparison with the diagonal terms. In the case of the “dense” configuration, diagonal terms are equal
  . We can consider that the biofilm presents an isotropic behavior in this case. In the case of “labyrinth” (respectively “worm-like”) configuration, the biofilm presents an orthotropic behavior with an orthotropic coefficient equal to
  (respectively 1.08). This orthotropic behavior can also be explained by mechanical pushing in the flow direction. Note that the diffusion in the x-direction is higher than the diffusion in the y-direction, expressing a higher diffusion in the direction of the flow. However, these off-diagonal terms may also be due to an artifact caused by the image analysis procedure.
Sensitivity analysis of the ratio of the microscopic diffusions
In the preceding calculations, we have chosen Dσ = 1 μm2.s−1 and Dβ = 100 μm2.s−1. As explained above, it is very difficult to know these values exactly. Since the gap between the different diffusion values is high, we have therefore decided to perform a sensitivity analysis. In order to analyze the influence of these values, we perform these analyses on the ratio of the subcellular parameters (Dσ/Dβ). We have computed the effective diffusion  for four values of Dσ (0.1; 1; 5; 10) leading to four values of the ratio
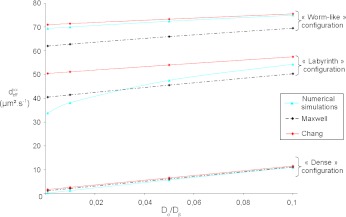
  (0.001; 0.01; 0.05; 0.1). The results are presented in Fig. 9. This analysis confirms the results previously obtained, i.e., the effective diffusion of the “dense” configuration is lower than the effective diffusion of the “labyrinth” configuration, which is lower than the “worm-like” configuration. Indeed, the ratio ε of the “dense” configuration is higher than the ratio ε of the “labyrinth” configuration, which is higher than the ratio ε of the “worm-like” configuration.
Fig. 9.
Influence of the ratio  on the homogenized parameter
  with different spatial configurations. The numerical results have been compared with the analytical solutions of Maxwell and Chang
In the “dense” configuration case, the numerical results are very close to the Maxwell’s model and to the Chang unit cell because the spatial structure is very close to a uniform distribution, which is the main hypothesis of these analytical solutions (see Section 2.3). Moreover, the effective diffusion is very close to the colony diffusion Dσ because of a high value of the ratio ε.
The numerical results for the “worm-like” configuration are close to the results of the Chang model, which are higher than the ones of the Maxwell model. The three curves are linear with the same slope. This can also be explained by the fact that, in this case, the distribution of the colonies is almost uniform.
When computed numerically, the effective diffusion  of the “labyrinth” configuration is nonlinear with respect to the ratio
  . Indeed, this configuration presents privileged directions due to fingering and mechanical pushing which facilitate the substrate diffusion and create orthotropic behavior. These directions drastically affect the calculation of the effective diffusion coefficients. This phenomenon is accentuated for low ratios corresponding to a high diffusion process. On the contrary, when the ratio
  increases, the curve becomes linear because the effect of privileged directions decreases. Indeed, a ratio close to 1 leads to a homogeneous diffusion in the domain.
Note also that when the ratio  , tends to 1, all curves reach a value of
  equal to 100 μm2.s−1 because the diffusion tends to be homogeneous, which decreases the effect of the spatial structure.
These results show that the spatial structure influences the nutrient diffusion. However, the reaction has to be considered to analyze the competition between growth and nutrient access. Indeed, the nutrient concentration widely influences the spatial structures [31]. The next section focuses on substrate consumption using the Monod equation.
Calculation of the substrate consumption ratio
As explained above, experimental spatial structures have been obtained by varying the nutrient concentration [31]. In this section, we investigate the influence of the solute concentration c0 on the Damköhler number which is associated with the reaction. For this purpose, we consider that diffusion-reaction phenomena are present in the bacterial clusters. There is no reaction term elsewhere. Considering the reaction term R leads to:
 |
25 |
and
 |
26 |
The reaction term R (mol.μm−3.s−1) is expressed following a Monod equation [45–47]:
 |
27 |
where μ = 1 s−1 and ks = 0.5 mol.μm−3. The coefficient μ represents the maximum growth rate coefficient expressed in s−1, ρσ the biomass density expressed in mol.μm−3 and ks is the Monod coefficient expressed in mol.μm−3. This is also called the half-saturation coefficient because it corresponds to the concentration which is one-half of its maximum.
Furthermore, the Damköhler number Da is the ratio between the reactive and the diffusive effects. The dimensionless Damköhler number is defined as follows:
 |
28 |
where R is the reaction term, F the diffusive flux and V the volume of the full domain. It has been extensively used to characterize the mass transport (with a reaction term) within bacterial biofilms [48, 49].
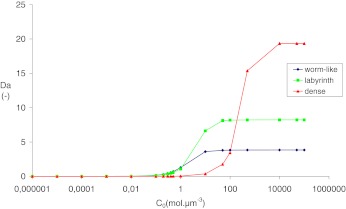
The diffusion parameters are the same as the parameters used in Section 3.2. Boundary conditions are:  . Figure 10 presents the evolution of the Damköhler number with respect to the solute concentration c0 for the three configurations.
Fig. 10.
Evolution of the Damköhler number as a function of nutrient concentration
For c0<1 mol.μm−3, Da is less than 1, the reaction is the limiting factor because the nutrient concentration is low and the competition between bacteria is therefore very intense. The transport is the major factor and the “worm-like” configuration presents the higher value of diffusion, and is therefore the most appropriate configuration. Moreover, the “dense” configuration has the lowest Damköhler number. It also corresponds to the results observed in experimental studies where the growth is limited by the nutrient access.
For 1 <c0<100 mol.μm−3, Da is higher than in the previous case; this is an intermediate stage where the nutrient concentration is too low to generate a dense biofilm but high enough to heterogeneously feed bacteria. In this range of values of c0, the “labyrinth” configuration is the most appropriate. It is the optimal organization when the competition between growth and nutrient access is high.
For c0>100 mol.μm−3, Da is high. In this case, the transport is the limiting factor. The substrate concentration is high, and there is no competition between cells. The concentration c0 is sufficient to feed all bacteria. The Damköhler number is therefore the highest with the “dense” configuration. We can conclude that, with a saturated substrate concentration, the biofilm growth is maximal with a “dense” configuration.
These results are in full agreement with the experiments of Xavier et al. [31] and explain the evolution of spatial structures obtained by increasing the substrate concentration (see Fig. 1).
Conclusion
The competition for nutrient access plays a major role in the emergence of various spatial structures which influence the physical properties of the biofilm. In order to explore more deeply this phenomenon, we propose a numerical procedure investigating the impact of spatial structures on the effective diffusion and on the substrate consumption ratio. We have applied this procedure to three kinds of spatial structure. The results show that the effective diffusion depends on the spatial structure, the subcellular-scale parameters (Dσ and Dβ) and also the ratio ε between the area occupied by the colonies and the total area of the RVE.
In the “dense” configuration case, the nutrient concentration is significant, there is no competition between growth and nutrient access, and the diffusion process has therefore a minor role. In this case, results are very close to the analytical solutions.
The calculation of effective diffusion coefficients shows an orthotropic behavior of the structures in the “worm-like” and “labyrinth” configurations. In these cases, mechanical pushing and fingering lead to a configuration with privileged directions and to higher values of effective diffusion in the direction of the flow. This orthotropic behavior explains the nonlinear evolution of the effective diffusion following the microscopic diffusion coefficients.
It is interesting to note that the conclusions of Xavier et al. [31] about competition for nutrient and biofilm growth clearly correspond to these results of effective diffusion and substrate consumption ratio. We provide a link between nutrient competition, biofilm growth and effective diffusion within bacterial biofilms. Moreover, this study shows the importance of the ratio ε on the calculation of effective diffusion coefficients and the substrate consumption ratio.
In the future, it will be particularly interesting to compare the value of effective diffusion of spatial structures with the same ratio ε in order to clearly distinguish the effect of the spatial structure from the one of the density.
Acknowledgements
This work was supported in part by the project ANR DISCO (ANR DISCO 09-SYSC-003, SYSCOMM call). The first author’s work is carried out at the French Regional Council of Auvergne. This publication only reflects the authors’ view.
Contributor Information
Thomas Guélon, Phone: +33-473-440683, Email: thomas.guelon@irstea.fr, Email: thomas.guelon@cemagref.fr.
Jean-Denis Mathias, Email: jean-denis.mathias@irstea.fr.
References
- 1.Costerton J, Lewandowski Z, Caldwell D, Korber D, Lappin-Scott H. Microbial biofilms. Annu. Rev. Microbiol. 1995;49:711–745. doi: 10.1146/annurev.mi.49.100195.003431. [DOI] [PubMed] [Google Scholar]
- 2.Daims H, Nielsen P, Nielsen J, Juretschko S, Wagner M. Novel Nitrospira-like bacteria as dominant nitrite-oxidizers in biofilms from wastewater treatment plants: diversity and in situ physiology. Water Sci. Technol. 2000;41(4–5):85–90. [Google Scholar]
- 3.Beech I, Sunner J. Biocorrosion: towards understanding interactions between biofilms and metals. Curr. Opin. Biotechnol. 2004;15(3):181–186. doi: 10.1016/j.copbio.2004.05.001. [DOI] [PubMed] [Google Scholar]
- 4.Tijhuis L, Loosdrecht M, Heijnen J. Formation and growth of heterotrophic aerobic biofilms on small suspended particles in airlift reactors. Biotechnol. Bioeng. 1994;44(5):595–608. doi: 10.1002/bit.260440506. [DOI] [PubMed] [Google Scholar]
- 5.Wanner O, Reichert P. Mathematical modeling of mixed-culture biofilms. Biotechnol. Bioeng. 1996;49(2):172–184. doi: 10.1002/(SICI)1097-0290(19960120)49:2<172::AID-BIT6>3.0.CO;2-N. [DOI] [PubMed] [Google Scholar]
- 6.Donlan R, Costerton J. Biofilms: survival mechanisms of clinically relevant microorganisms. Clin. Microbiol. Rev. 2002;15(2):167–193. doi: 10.1128/CMR.15.2.167-193.2002. [DOI] [PMC free article] [PubMed] [Google Scholar]
- 7.Stewart P, Costerton J. Antibiotic resistance of bacteria in biofilms. Lancet. 2001;358(9276):135–138. doi: 10.1016/S0140-6736(01)05321-1. [DOI] [PubMed] [Google Scholar]
- 8.Beer D, Stoodley P, Roe F, Lewandowski Z. Effects of biofilm structures on oxygen distribution and mass transport. Biotechnol. Bioeng. 1994;43(11):1131–1138. doi: 10.1002/bit.260431118. [DOI] [PubMed] [Google Scholar]
- 9.Beer D, Stoodley P, Lewandowski Z. Measurement of local diffusion coefficients in biofilms by microinjection and confocal microscopy. Biotechnol. Bioeng. 1997;53(2):151–158. doi: 10.1002/(SICI)1097-0290(19970120)53:2<151::AID-BIT4>3.0.CO;2-N. [DOI] [PubMed] [Google Scholar]
- 10.Libicki SB, Salmon PM, Robertson CR. Effective diffusive permeability of a nonreacting solute in microbial cell aggregates. Biotechnol. Bioeng. 1988;32(1):68–85. doi: 10.1002/bit.260320111. [DOI] [PubMed] [Google Scholar]
- 11.Beyenal H, Tanyolac A. The calculation of simultaneous effective diffusion coefficients of the substrates in a fluidized bed biofilm reactor. Water Sci. Technol. 1994;29(10–11):463–470. [Google Scholar]
- 12.Bakken L, Olsen R. Buoyant densities and dry-matter contents of microorganisms: conversion of a measured biovolume into biomass. Appl. Environ. Microbiol. 1983;45(4):1188–1195. doi: 10.1128/aem.45.4.1188-1195.1983. [DOI] [PMC free article] [PubMed] [Google Scholar]
- 13.Bratbak G, Dundas I. Bacterial dry matter content and biomass estimations. Appl. Environ. Microbiol. 1984;48(4):755–757. doi: 10.1128/aem.48.4.755-757.1984. [DOI] [PMC free article] [PubMed] [Google Scholar]
- 14.Matson J, Characklis W. Diffusion into microbial aggregates. Water Res. 1976;10(10):877–885. doi: 10.1016/0043-1354(76)90022-1. [DOI] [Google Scholar]
- 15.Cour Jansen J, Harremoes P. Removal of soluble substrates in fixed films. Water Sci. Technol. 1985;17(2–3):1–14. [Google Scholar]
- 16.Dibdin G. Diffusion of sugars and carboxylic acids through human dental plaque in vitro. Arch. Oral Biol. 1981;26(6):515–523. doi: 10.1016/0003-9969(81)90010-8. [DOI] [PubMed] [Google Scholar]
- 17.Stewart P. A review of experimental measurements of effective diffusive permeabilities and effective diffusion coefficients in biofilms. Biotechnol. Bioeng. 1998;59(3):261–272. doi: 10.1002/(SICI)1097-0290(19980805)59:3<261::AID-BIT1>3.0.CO;2-9. [DOI] [PubMed] [Google Scholar]
- 18.Lamotta E. Internal diffusion and reaction in biological films. Environ. Sci. Technol. 1976;10(8):765–769. doi: 10.1021/es60119a003. [DOI] [PubMed] [Google Scholar]
- 19.Ochoa J, Stroeve P, Whitaker S. Diffusion and reaction in cellular media. Chem. Eng. Sci. 1986;41(12):2999–3013. doi: 10.1016/0009-2509(86)85036-9. [DOI] [Google Scholar]
- 20.Ochoa-Tapia J, Stroeve P, Whitaker S. Diffusive transport in two-phase media: spatially periodic models and Maxwell’s theory for isotropic and anisotropic systems. Chem. Eng. Sci. 1994;49(5):709–726. doi: 10.1016/0009-2509(94)85017-8. [DOI] [Google Scholar]
- 21.Wood B, Quintard M, Whitaker S. Methods for predicting diffusion coefficients in biofilms and cellular systems. Methods Enzymol. 2001;337:319–338. [PubMed] [Google Scholar]
- 22.Wood B, Quintard M, Whitaker S. Calculation of effective diffusivities for biofilms and tissues. Biotechnol. Bioeng. 2002;77(5):495–516. doi: 10.1002/bit.10075. [DOI] [PubMed] [Google Scholar]
- 23.Gujer W, Wanner O. Modeling mixed population biofilms. In: Characklis WG, Marshall KC, editors. Biofilms. New York: Wiley; 1990. [Google Scholar]
- 24.Fan L-S, Leyva-Ramos R, Wisecarver K, Zehner B. Diffusion of phenol through a biofilm grown on activated carbon particles in draft-tube three-phase fluidized-bed bioreactor. Biotechnol. Bioeng. 1990;35(3):279–286. doi: 10.1002/bit.260350309. [DOI] [PubMed] [Google Scholar]
- 25.Jefferson K. What drives bacteria to produce a biofilm? FEMS Microbiol. Lett. 2004;236(2):163–173. doi: 10.1016/j.femsle.2004.06.005. [DOI] [PubMed] [Google Scholar]
- 26.Roszak D, Colwell R. Survival strategies of bacteria in the natural environment. Microbiol. Rev. 1987;51(3):365–379. doi: 10.1128/mr.51.3.365-379.1987. [DOI] [PMC free article] [PubMed] [Google Scholar]
- 27.Pamp S, Tolker-Nielsen T. Multiple roles of biosurfactants in structural biofilm development by Pseudomonas aeruginosa. J. Bacteriol. 2007;189(6):2531–2539. doi: 10.1128/JB.01515-06. [DOI] [PMC free article] [PubMed] [Google Scholar]
- 28.Thar R, Kuhl M. Complex pattern formation of marine gradient bacteria explained by a simple computer model. FEMS Microbiol. Lett. 2005;246(1):75–79. doi: 10.1016/j.femsle.2005.03.036. [DOI] [PubMed] [Google Scholar]
- 29.Allesen-Holm M, Barken K, Yang L, Klausen M, Webb J, Kjelleberg S, Molin S, Givskov M, Tolker-Nielsen T. A characterization of DNA release in Pseudomonas aeruginosa cultures and biofilms. Mol. Microbiol. 2006;59(4):1114–1128. doi: 10.1111/j.1365-2958.2005.05008.x. [DOI] [PubMed] [Google Scholar]
- 30.Rieu A, Briandet R, Habimana O, Garmyn D, Guzzo J, Piveteau P. Listeria monocytogenes EGD-e biofilms: no mushrooms but a network of knitted chains. Appl. Environ. Microbiol. 2008;74(14):4491–4497. doi: 10.1128/AEM.00255-08. [DOI] [PMC free article] [PubMed] [Google Scholar]
- 31.Xavier J, Martinez-Garcia E, Foster K. Social evolution of spatial patterns in bacterial biofilms: when conflict drives disorder. Am. Nat. 2009;174(1):1–12. doi: 10.1086/599297. [DOI] [PubMed] [Google Scholar]
- 32.Hunter R, Beveridge T. High-resolution visualization of Pseudomonas aeruginosa pao1 biofilms by freeze-substitution transmission electron microscopy. J. Bacteriol. 2005;187(22):7619–7630. doi: 10.1128/JB.187.22.7619-7630.2005. [DOI] [PMC free article] [PubMed] [Google Scholar]
- 33.Dockery J, Klapper I.Finger formation in biofilm layers SIAM J. Appl. Math. 2002623853–869.1897725 10.1137/S0036139900371709 [DOI] [Google Scholar]
- 34.Aboudi J. Mechanics of composite materials - A Unified Micromechanical Approach. Amsterdam: Elsevier; 1991. [Google Scholar]
- 35.Dormieux L, Molinari A, Kondo D.Micromechanical approach to the behaviour of poroelastic materials J. Mech. Phys. Solids. 200250102203–2231.1151.74346 10.1016/S0022-5096(02)00008-X2002JMPSo..50.2203D [DOI] [Google Scholar]
- 36.Fritsch A, Dormieux L, Hellmich C, Sanahuja J. Mechanical behaviour of hydroxyapatite biomaterials: an experimentally validated micromechanical model for elasticity and strength. J. Biomed. Mater. Res. A. 2009;88(1):149–161. doi: 10.1002/jbm.a.31727. [DOI] [PubMed] [Google Scholar]
- 37.Mathias J-D, Tessier-Doyen N. Homogenization of glass/alumina two-phase materials using a cohesive zone model. Comput. Mater. Sci. 2008;43(4):1081–1085. doi: 10.1016/j.commatsci.2008.03.004. [DOI] [Google Scholar]
- 38.Wood B, Whitaker S. Diffusion and reaction in biofilms. Chem. Eng. Sci. 1998;53(3):397–425. doi: 10.1016/S0009-2509(97)00319-9. [DOI] [Google Scholar]
- 39.Wood BD, Golfier F, Quintard M. Dispersive transport in porous media with biofilms: local mass equilibrium in simple unit cells. IJEWM J. 2011;7(1–2):24–48. doi: 10.1504/IJEWM.2011.037364. [DOI] [Google Scholar]
- 40.Maxwell JC. Treatise on Electricity and Magnetism, vol. I. 2. Oxford: Clarendon Press; 1881. p. 400. [Google Scholar]
- 41.Chang H-C. Effective diffusion and conduction in two-phase media: a unified approach. AICHE J. 1983;29(5):846–853. doi: 10.1002/aic.690290521. [DOI] [Google Scholar]
- 42.Beyenal H, Şeker Ş, Tanyolaç A, Salih B. Diffusion coefficients of phenol and oxygen in a biofilm of Pseudomonas putida. AICHE J. 1997;43(1):243–250. doi: 10.1002/aic.690430126. [DOI] [Google Scholar]
- 43.Fu Y-C, Zhang TC, Bishop PL. Determination of effective oxygen diffusivity in biofilms grown in a completely mixed biodrum reactor. Water Sci. Technol. 1994;29(10–11):455–462. [Google Scholar]
- 44.Lawrence JR, Wolfaardt GM, Korber DR. Determination of diffusion coefficients in biofilms by confocal laser microscopy. Appl. Environ. Microbiol. 1994;60(4):1166–1173. doi: 10.1128/aem.60.4.1166-1173.1994. [DOI] [PMC free article] [PubMed] [Google Scholar]
- 45.Kreft J-U, Picioreanu C, Wimpenny J, Loosdrecht M. Individual-based modelling of biofilms. Microbiology. 2001;147(11):2897–2912. doi: 10.1099/00221287-147-11-2897. [DOI] [PubMed] [Google Scholar]
- 46.Monod J. Recherches sur la croissance des cultures bacteriennes. Paris: Hermann & Cie; 1942. p. 211. [Google Scholar]
- 47.Picioreanu C, Kreft J-U, Loosdrecht M. Particle-based multidimensional multispecies biofilm model. Appl. Environ. Microbiol. 2004;70(5):3024–3040. doi: 10.1128/AEM.70.5.3024-3040.2004. [DOI] [PMC free article] [PubMed] [Google Scholar]
- 48.Xavier JB, Picioreanu C, Abdul Rani S, Loosdrecht MCM, Stewart PS. Biofilm-control strategies based on enzymic disruption of the extracellular polymeric substance matrix - a modelling study. Microbiology. 2005;151(12):3817–3832. doi: 10.1099/mic.0.28165-0. [DOI] [PubMed] [Google Scholar]
- 49.Golfier F, Wood BD, Orgogozo L, Quintard M, Bues M.Biofilms in porous media: development of macroscopic transport equations via volume averaging with closure for local mass equilibrium conditions Adv. Water Resour. 2009323463–485. 10.1016/j.advwatres.2008.11.0122009AdWR...32..463G [DOI] [Google Scholar]


