Abstract
Rat liver microsomes attached to nanoparticles were used for LC-MS studies of CYP3A and 2E1 enzymes in metabolism of N-nitroso compounds. Using these biocolloids, turnover rates were measured within 2 min. Inhibitor IC50 values for ketoconazole (KET) and 4-methylpyrazole (4-MEP) were estimated.
Keywords: Microsome-biocolloids, N-nitrosamines, Inhibition, cap-LC/MS, CYP, Ketoconazole
1. INTRODUCTION
Establishment of metabolism, cytotoxicity and enzyme inhibition is key for developing new drugs [1-3]. In vitro metabolism and inhibition assessment often employs microsomes as sources of multiple enzymes [2]. High throughput approaches are desirable for screening [4-6]. While pure metabolic enzymes can be used, many are not commercially available, necessitating laborious purification protocols. Hence, rapid, inexpensive methods employing microsomes that are amenable to high throughput formats would be valuable.
Liver cytochrome P450 (CYP) enzymes play a central role in drug metabolism and detoxification [7]. We recently developed assemblies of pure CYP enzymes with DNA on silica nanoparticles for genotoxicity screening [8-11]. Enzyme reactions on the particles produce metabolites that may react with DNA in the films, and metabolites and nucleobase adducts are detected by LC-MS. In contrast, human and rat liver microsomes are commercially available and are the source of many CYPs [12,13].
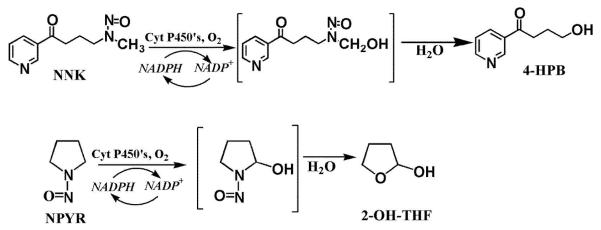
In this communication, we report assemblies of rat liver microsomes (RLM) and polyions in stable films on silica nanoparticles (Scheme 1) and evaluate the metabolism and inhibition of CYP3A and 2E1 enzymes. Attachment of RLMs to nanoparticles creates biocolloids with the microsomes concentrated on their surfaces. CYPs in the microsomes were activated by the natural NADPH-Cytochrome P450 reductase electron donation pathway [7]. N-nitrosopyrrolidine (NPYR) and 4-(methylnitrosamino)-1-(3-pyridyl)-1-butanone (NNK)) (Scheme 2), were used as models because of their well known metabolic pathways along with CYP-inhibitors [14,15] ketoconazole (KET) and 4-methylpyrazole (4-MEP). RLM-biocolloids enabled metabolism and inhibition assays by LC-MS in microliter reaction volumes (250 μL) at incubation times as short as 15 s. This approach provides an accurate method to establish metabolite structures, relative formation rates, and inhibition IC50 values, and is faster than using microsomes alone.
Scheme 1.

Conceptual illustration of RLM film fabrication on silica nanospheres. Layer-by-layer electrostatic assembly was used to first immobilize positively charged poly(ethylenimine) PEI on the negative silica, then rat liver microsomes (RLM).
Scheme 2.
NNK and NPYR metabolism featuring α-hydroxylation catalyzed by CYPs [16].
2. MATERIALS AND METHODS
2.1 Materials
Rat liver microsomes (RLM) were from BD Gentest. 4-(methylnitrosamino)-1-(3-pyridyl)-1-butanone (NNK) and 4-hydroxy-1-(3-pyridyl)-butanone (4-HPB) were from Toronto Research Chemicals. N-nitrosopyrrolidine (NPYR), 2-hydroxy tetrahydrofuran and all other chemicals were from Sigma. Silica nanoparticles were from Polyscience, Inc (500 nm (±10%) dia., approx. 10% solids, d = 1.96 g/cm 3) and used after redispersing by agitation.
2.2 Film assembly
Biocolloids were assembled by the electrostatic layer-by-layer (LbL) method [17]. Stock silica nanoparticles dispersed in water (0.2 mL ~2 × 10¹¹ beads) were added to poly(ethyleneimine) (PEI, 1 mg mL−1, 50 mM NaCl) in a total volume of 1.0 mL for 20 min to obtain steady state adsorption. The microspheres were removed from the dispersion by centrifugation (2 min. at 8000 rpm), followed by resuspension in water and centrifugation for three times. These nanoparticles were then resuspended in 50 μL of RLM dispersion at 4°C for 30 minutes followed by the same rinsing steps. The final film architecture was SiO2/PEI/RLM (Scheme 1), and these nanoparticles are referred to as RLM biocolloids.
2.3 Metabolite Detection and Enzyme Inhibition
NAPDH generating system [13] (10 mM glucose-6-phosphate, 4 units glucose-6-phosphate dehydrogenase, 10 mM MgCl2, 0.8 mM NADP+, 50 mM phosphate buffer, pH 7.0) was pre-incubated at 37°C for 5 min. The RLM biocolloids above were resuspended in 50 mM phosphate buffer (100 μL, pH 7.0) for 5 min at 37°C, then NNK or NPYR (1.0 mM) was added. The reaction was initiated by combining 100 μL RLM biocolloid dispersion with 150 μL NADPH generating system. Total reaction volume was 250 μL. Reactions were run at 37°C and stopped by rapidly centrifuging the RLM biocolloids from the reaction solution. For inhibition studies, ketoconazole (0-2μM) or 4-methylpyrazole (0-0.2μM) were pre-incubated with the RLM biocolloids in pH 7 buffer (100μL) for 5 min before adding NPYR or NNK (0.10, 1.0 mM). Metabolites from NNK and NPYR were identified using capLC-MS analysis of the supernatant collected after centrifugation of the reaction mixture. Safety note: NNK, NPYR and their metabolites are suspected carcinogens.
2.4 LC-MS/MS
The analytical column was Waters capillary Atlantis dC18 (150 mm, 300 μm I.D., 5 μm particle size) with the same brand trapping column (23.5 mm). A similar procedure as reported earlier was used [18]. Three 10 μL injections for each analysis were loaded into the trapping column at flow rate of 4.25 μL min−1. Trapped metabolites were then back-flushed from the trapping column onto the analytical column at 4.25 μL min−1 using elution gradient: 10 mins – 10% B, 10 mins – 10% to 30% B, 10 mins – 30% B, 5 mins – 30% to 10 % B, 5 mins – 10% B. (A:10 mM acetate buffer pH 5.5, B: methanol). Electrospray ionization mass spectrometry (ESIMS) employed a Micromass Quattro II operated in positive ion mode (ESI+). Samples were analyzed by total ion scan (TIC) with cone voltage 15 V. Quantification of metabolites was done using calibration plots obtained by using commercially available standards using concentrations ranging from 10 nM to 10 μM. Limit of quantitation was ~1 nM, reproducibility ±10% for replicate reaction runs, and sensitivity based on LC integration was 95 counts/nM for both NNK and NPYR.
3. RESULTS
3.1. Metabolite Detection
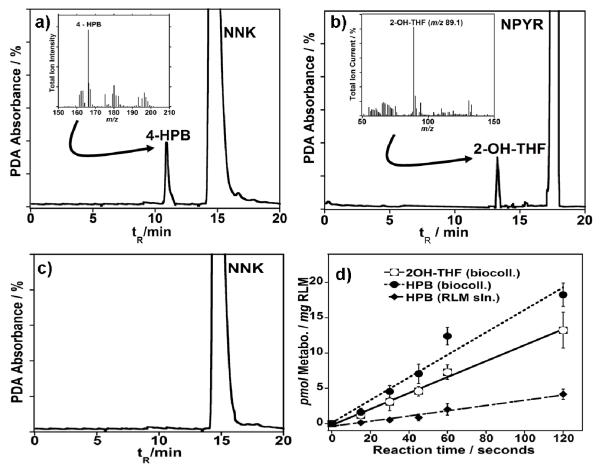
The catalytic activity of CYPs −3A and −2E1 isozymes in the RLM-biocolloids for metabolizing NNK and NPYR was evaluated in the absence and in the presence of inhibitors and enzyme turnover rates were determined. Previous reports showed that CYP 2E1 metabolizes NPYR [19] and to small extent NNK [20]. CYP 3A isozymes are responsible for metabolism of NNK [21]. The response from 2 min. incubation of RLM biocolloids with NNK or NPYR in the presence of NADPH generating system was observed by capLC diode array as shown in Fig. (1a,b).
Figure 1.
capLC-photodiode array (PDA) chromatograms showing the generation of metabolite peaks after 2 min. exposure of RLM biocolloids at pH 7.0 and 37° C to 1 mM (a) NNK or (b) NPYR, and NAPDH generating system c) NNK exposed to RLM biocolloids in absence of NADPH. Insets show MS spectra for metabolites 4-HPB and 2-OH-THF (Scheme 1) from NNK and NPYR respectively; (d) Influence of reaction time on amount of HPB (dashed line, closed circle) or 2-OH-THF (full line, open circle) formed in the presence of RLM-biocolloids and HPB (dashed line, diamonds) formed with RLMs in solution.
In the samples subject to enzyme reactions, new peaks eluting before the respective substrates is consistent with the formation of known hydroxylated metabolites [22]. MS spectra from the TIC chromatograms are shown in the inset. The control chromatogram in Fig. (1c) demonstrates the response when RLM biocolloids were incubated with NNK in the absence of NADPH. The control experiment demonstrates that NADPH is necessary for the activation of microsomal CYP leading to oxidation of the substrate. The molar amount of metabolites generated vs. reaction times obtained via comparison to a standard plot is illustrated in Fig. (1d). The turnover rate for NNK was 0.146 ± 0.015 pmol sec−1 mg RLM−1 and for NPYR was 0.116 ± 0.011 pmol sec−1 mg RLM−1 in the presence of RLM-biocolloids were determined from the slope of the lines in Fig. (1d). For comparison, an experiment with the exact same quantity of RLMs in solution (not fixed to nanoparticles) was done under the same conditions, the turnover rate was calculated to be 0.0451 ± 0.005. Activity toward NNK was approximately 60-70% smaller than with the RLM biocolloids. (Fig. 1d). The RLM biocolloids retained ~80% activity when reused for NNK or NPYR metabolite generation.
3.2. Enzyme Specific Inhibition
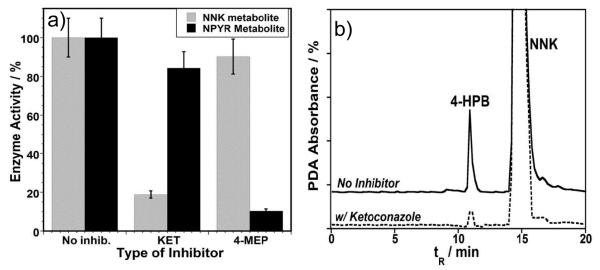
Metabolism of NNK was monitored in the presence of ketoconazole, a specific competitive inhibitor of CYP 3A [14]; that of NPYR was monitored in the presence of 4-methylpyrazole, a specific competitive inhibitor of CYP 2E1 [15]. Enzyme activity with and without the inhibitors after 10 min incubation with RLM-bioreactors is shown in Fig. (2a). In the presence of KET ~85% of enzyme activity toward NNK and 15-20% enzyme activity toward NPYR were inhibited. Alternatively, exposure of RLM-biocolloids to 4MEP inhibited approximately 90% of enzyme activity toward NPYR and 10-15% activity towards NNK. The capLC chromatogram in Fig. (2b) illustrates the amount of metabolite generated in the presence and absence of KET.
Figure 2.
a) The effects of the specific inhibitors (KET and 4-MEP) on the catalytic activity of RLM-biocolloids during the metabolism of NNK and NPYR. Data collected after 10 min. incubation of RLM-biocolloids with respective N-nitrosamines and inhibitors, in the presence of NADPH generating system. b) CapLC chromatograms illustrating the metabolites formed with exposure of NNK to RLM films on silica nanospheres in the presence of NAPDH generating system with and without KET, 10 minute incubation.
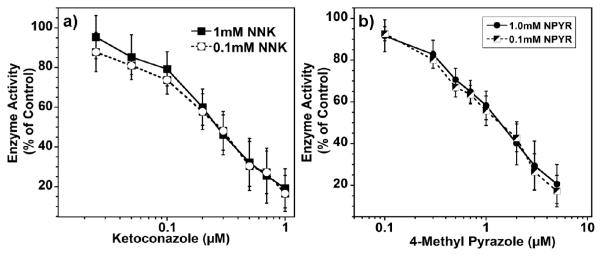
Inhibition reactions were done for different concentrations of inhibitor (KET or 4-MET) while keeping the substrate concentration (NNK or NPYR) and incubation time constant (Fig. 3). Results were used to determine IC50 values (Table 1) and confirm the predominant CYP enzyme responsible for the metabolism. Comparison was made to control incubations (0 mM inhibitor) and activity expressed as the percentage of enzyme activity remaining. IC50 values were determined by linear interpolation (log. scale) [14].
Figure 3.
Enzyme activity remaining with respect to control (no inhibitor) after 10 min incubation of RLM biocolloids, NADPH generating system with: a) different concentrations of KET in the presence of 0.1 mM NNK(open circle, dashed line) and 1.0mM NNK (closed squares, full line) b) different concentrations of 4-MEP in the presence of 0.1 mM NPYR (half closed squares, dashed line) and 1.0mM NPYR(closed circle, full line)
Table 1.
IC50 values of known specific inhibitors determined with RLM biocolloids
| CYP | Substrate/Inhibitor | IC50 (μM) |
|---|---|---|
| 2E1 | NPYR/4-MEP | 1.36 |
| 3A | NNK/KET | 0.25 |
4. DISCUSSION
Results above illustrate the ability of RLM biocolloids to generate metabolites in short reaction times. Capillary LC-MS with on-line preconcentration permits detection of fmol amounts of metabolites as reported previously [8,18].
RLM-biocolloids provided ~60-70% larger rates of metabolism than with microsomes alone. Immobilizing RLMs on nanoparticles concentrates large amounts of cytochrome P450 reductase (CPR) and CYPs in small reaction volumes. The improved rates could be facilitated by cooperativity effects that are currently under further study.
Inhibition of KET and 4-MEP on enzyme activity of RLMs was characterized easily using RLM-biocolloids. A significant decrease in NNK metabolite was observed in the presence of KET compared to its absence (Fig. 2a,b) consistent with selective inhibition of CYP by KET [14]. 4-MEP did not have a major effect on NNK metabolism (Fig. 2a). CYP 2E1 accounts for a small fraction of NNK metabolism in rat liver microsomes [23], and since it’s not inhibited by KET, some 4-HPB (Scheme 2) is still being formed.
KET had a much smaller effect on NPYR metabolism, indicating that CYP 3A does not play a significant role in NPYR metabolism. However, the introduction of 4-MEP decreased the generation of NPYR metabolite (Fig. 2a), suggesting that CYP 2E1 plays a major role in NPYR metabolism, consistent with literature [24]. Some 2-OH-THF (Scheme 2) is still being formed after the introduction of 4-MEP suggesting that other microsomal CYPs are involved in NPYR metabolism.
Evaluating inhibitor potency is a significant factor in elucidating drug-drug interactions and can provide information for the therapeutic dose, as expressed by IC50 values. Generally compounds with IC50 < 1 μM are considered potent inhibitors, those at 1-10 μM are considered mild, and compounds with IC50 > 10 μM are considered weak inhibitors [25]. From Fig. 3, IC50 values using RLM biocolloids were 1.36 ± 0.21 μM for 4-MEP and 0.25 ± 0.03 μM for KET. Based on these results, KET is a more potent inhibitor than 4-MEP, which suggests that KET binds tightly with the CYP 3A enzymes, consistent with previous reports [26].
In summary, rapid, accurate evaluation of metabolism and inhibition by chemical compounds can be achieved using RLM biocolloid nanoreactors. The biocolloids are easily removed by centrifugation for analysis of reaction solutions. If necessary, solvent extraction can also be used to process products for analysis[8]. These novel microsome “nanoreactors” are promising as the basis for eventual development of high throughput in vitro metabolism/inhibition technology, e.g. by using them in microfluidic reactors coupled to appropriate LC-MS configurations.
Acknowledgement
This work was supported financially by US PHS grant No. ES03154 from the National Institute of Environmental Health Sciences (NIEHS), NIH, USA. The authors thank Drs. Dominic Hull and Eli Hvastkovs for help with editing this manuscript.
References
- [1].Liebler CD, Guengerich FP. Nature Rev. Drug Discov. 2005;4:410. doi: 10.1038/nrd1720. [DOI] [PubMed] [Google Scholar]
- [2].Nassar AEF, Kamel AM, Clarimont C. Drug. Devel. Today. 2004;9:1055. doi: 10.1016/S1359-6446(04)03297-0. [DOI] [PubMed] [Google Scholar]
- [3].Turpeinen M, Korhonen EL, Tolonen A, Uusitalo J, Juvonen R, Raunio H, Pelkonen O. Euro.J.Pharm. Sci. 2006;29:130. doi: 10.1016/j.ejps.2006.06.005. [DOI] [PubMed] [Google Scholar]
- [4].Bu H-Z, Magis L, Knuth K, Teitelbaum P. Rapid. Comm. Mass Spec. 2000;14:1619. doi: 10.1002/1097-0231(20000915)14:17<1619::AID-RCM71>3.0.CO;2-2. [DOI] [PubMed] [Google Scholar]
- [5].a) Breimer DD, Schellens JH. Trends Pharmacol. Sci. 1990;11:223. doi: 10.1016/0165-6147(90)90245-4. [DOI] [PubMed] [Google Scholar]; b) Frye RF, Matzke GR, Adedoyin A, Porter JA, Branch RA. Clin. Pharmacol. Ther. 1997;62:365. doi: 10.1016/S0009-9236(97)90114-4. [DOI] [PubMed] [Google Scholar]; c) Scott R, Palmer J, Lewis ASI, Pleasance S. Rapid Comm. Mass Spec. 1999;13:2305. doi: 10.1002/(SICI)1097-0231(19991215)13:23<2305::AID-RCM790>3.0.CO;2-G. [DOI] [PubMed] [Google Scholar]
- [6].a) Zweigenbaum J, Heinig K, Steinborner S, Wachs T, Henion J. Anal. Chem. 1999;71:2294. doi: 10.1021/ac9813540. [DOI] [PubMed] [Google Scholar]; b) Simpson H, Berthemy A, Buhrman D, Burton R, Newton J, Kealy M, Wells D, Wu D. Rapid Commun. Mass Spec. 1998;12:75. doi: 10.1002/(SICI)1097-0231(19980131)12:2<75::AID-RCM112>3.0.CO;2-C. [DOI] [PubMed] [Google Scholar]
- [7].Guengerich FP. AAPS J. 2006;8:E101. doi: 10.1208/aapsj080112. [DOI] [PMC free article] [PubMed] [Google Scholar]
- [8].Bajrami B, Hvastkovs EG, Jensen G, Schenkman JB, Rusling JF. Anal.Chem. 2008;80:922. doi: 10.1021/ac702025f. [DOI] [PubMed] [Google Scholar]
- [9].Rusling JF, Hvastkovs EG, Schenkman JB. Curr. Opin. Drug Discov. Dev. 2007;10:67. [PubMed] [Google Scholar]
- [10].Hvastkovs EG, So M, Krishnan S, Bajrami B, Tarun M, Jansson I, Schenkman JB, Rusling JF. Anal. Chem. 2007;79:1897. doi: 10.1021/ac061975q. [DOI] [PMC free article] [PubMed] [Google Scholar]
- [11].Krishnan S, Hvastkovs EG, Bajrami B, Jansson I, Schenkman JB, Rusling JF. Chem. Commun. 2007;1713 doi: 10.1039/b703012f. [DOI] [PubMed] [Google Scholar]
- [12].Yuan R, Madani S, Wei X-X, Reynolds K, Huang S-M. Drug Metabol. Disp. 2002;30:1311. doi: 10.1124/dmd.30.12.1311. [DOI] [PubMed] [Google Scholar]
- [13].Iwata H, Fujita K, Kushida H, Suzuki A, Konno Y, Nakamura K, Fujino A, Kamataki T. Biochem. Pharmacol. 1998;55:1315. doi: 10.1016/s0006-2952(97)00643-6. [DOI] [PubMed] [Google Scholar]
- [14].Dierks EA, Stams KR, Lim H-K, Cornelius G, Zhang H, Ball S. Drug Metab.Dispos. 2001;29:23. [PubMed] [Google Scholar]
- [15].Ortiz de Montellano PR. Cytochrome P450. 3rd Ed Kluwer/Plenum; New York: 2005. [Google Scholar]
- [16].Hecht SS. Nature Reviews: Cancer. 2003;3:733. doi: 10.1038/nrc1190. [DOI] [PubMed] [Google Scholar]
- [17].Lvov Y, Mohwald H. Protein Architecture: Interfacing Molecular Assemblies and Immobilization Biotechnology. Marcel Dekker; New York: 2000. pp. 125–167. [Google Scholar]
- [18].Tarun M, Bajrami B, Rusling JF. Anal. Chem. 2006;78:624. doi: 10.1021/ac0517996. [DOI] [PubMed] [Google Scholar]
- [19].Wong HL, Murphy SE, Hecht SS. Chem. Res. Toxicol. 2003;16:1298. doi: 10.1021/tx0340495. [DOI] [PubMed] [Google Scholar]
- [20].Walgren JL, Mitchell MD, Thompson DC. Crit. Rev. Toxicol. 2005;35:325. doi: 10.1080/10408440590935620. [DOI] [PubMed] [Google Scholar]
- [21].Patten JC, Smith JT, Friesen JM, Tynes RE, Yang CS, Murphy ES. Carcinogenesis. 1997;18:1623. doi: 10.1093/carcin/18.8.1623. [DOI] [PubMed] [Google Scholar]
- [22].Wang M, Cheng G, Sturla SJ, Shi Y, McIntee EJ, Villalta PW, Upadhyaya P, Hecht SS. Chem. Res. Toxicol. 2003;16:616. doi: 10.1021/tx034003b. [DOI] [PubMed] [Google Scholar]
- [23].Jalas RJ, Ding X, Murphy ES. Drug Metab. Dispos. 2003;31:1199. doi: 10.1124/dmd.31.10.1199. [DOI] [PubMed] [Google Scholar]
- [24].Flammang AM, Gelboin HV, Aoyama TF, Gonzalez J, McCoy GD. Biochem. Arch. 1993;9:197. [Google Scholar]
- [25].Bu Z-H, Magis L, Teitelbaum KKP. Rapid Commun. Mass Spectrum. 2001;15:741. doi: 10.1002/rcm.290. [DOI] [PubMed] [Google Scholar]
- [26].Marechal J-D, Yu J, Brown S, Kapelioukh I, Rankin ME, Wolf CR, Roberts CKG, Paine JIM, Sutcliffe JM. Drug Metab. Dispos. 2006;34:534. doi: 10.1124/dmd.105.007625. [DOI] [PubMed] [Google Scholar]


