Abstract
There is growing information about the heterogeneity of pancreatic β-cells and how it relates to insulin secretion. This study used the approach of flow cytometry to sort and analyze β-cells from transgenic mice expressing green fluorescent protein (GFP) under the control of the mouse insulin I gene promoter. Three populations of β-cells with differing GFP brightness could be identified, which were classified as GFP-low, GFP-medium, and GFP-bright. The GFP-medium population comprised about 70% of the total. The GFP-low population had less insulin secretion as determined by the reverse hemolytic plaque assay and reduced insulin gene expression. Additionally, all three subpopulations of β-cells were found in mice of varying ages (embryonic d 15.5 and postnatal wk 1–9). The three populations from the youngest had larger cells (forward scatter) and less granularity (side scatter) than those from the adults. This approach opens up new ways to advance knowledge about β-cell heterogeneity.
Studies have described the heterogeneity of β-cells on a functional level with differences in insulin secretion and biosynthesis as well as morphology and various biological markers (1–10). Moreover, we and others have found heterogeneity in sorted single β-cells with regard to very low expression of mRNA of the hormone products of other islet cell types (11, 12). Our study used sorted β-cells from transgenic mice expressing green fluorescent protein (GFP) under the control of the mouse insulin I gene promoter (MIP) (13). The introduction of this transgene does not appear to be deleterious, because these mice have normal pancreatic development, glucose tolerance, islet histology, and β-cell secretory function (13). Our previous analysis of single GFP-positive cells from these mice with nested PCR revealed that only 55% of the β-cells expressed the insulin gene alone and 4% of the cells expressed genes of four islet hormones (insulin, glucagon, somatostatin, and pancreatic polypeptide) (11, 12). Another example of heterogeneity in adult β-cells was shown with a dual-reporter construct (Pdx1-monomeric red fluorescent protein/insulin-enhanced GFP dual-reporter lentivirus) (14). Most mouse and human β-cells were clearly positive for both markers, but 10–25% Pdx (+) and insulin (low) cells are presumably true β-cells but show lower insulin expression. Yet another example of heterogeneity was recently demonstrated by the recent finding that 20–25% of islets in rats appear to have reduced functional activity as suggested by low oxygen tension and reduced blood flow (15). However, little is understood about how the β-cells in these islets are related to the heterogeneity found in other studies.
In our previous work with MIP-GFP mice, we noticed variability of GFP expression in β-cells and hypothesized that the GFP intensity regulated by the MIP might be a marker of β-cell heterogeneity that was reflected by differences in insulin promoter activity. Therefore, single β-cells were sorted on the basis of GFP intensity and analyzed for insulin gene expression and insulin secretion using the reverse hemolytic plaque assay (RHPA) that allows the evaluation of individual β-cell function. Those with the lowest GFP intensity had lower insulin secretion and lower insulin mRNA than the other two groups. We also examined β-cells with differing GFP intensity from mice of varying age with flow cytometry and found that the β-cells from the youngest age were larger and less granular than those from the adults.
Materials and Methods
Mice
Mice were maintained and studied under conditions approved by the Institutional Animal Care and Use Committee of the Joslin Diabetes Center. MIP-GFP mice were obtained from M. Hara (The University of Chicago, Chicago, IL) and backcrossed 10 times with C57BL/6J mice, which were purchased from The Jackson Laboratory (Bar Harbor, ME). Embryos were considered to be 0.5 d of gestation [embryonic d 0.5 (E0.5)] at noon of the day plugs were detected; neonates were considered to be postnatal d 0 (P0) on the day of birth. Then, neonates were weaned at P28.
DNA isolation and PCR analysis for genotyping
Genomic DNA of peripheral blood was extracted with Temp/Nucleospin Blood Quick Pure kit (BD, Franklin Lakes, NJ). The presence of MIP-GFP transgene was screened by PCR using primers that recognize the GFP construct as follows: forward 5′-TGGAAACTGCAGCTTCAG-3′ and reverse 5′-GTCCAGCTCGACCAGGATGG-3′ (280 bp).
Islets isolation and dispersion
Pancreases were removed from mice from E15.5 to 4 wk of age just after decapitation and minced with a razor blade in media. The tissue was digested with Liberase (Roche, Indianapolis, IN) for approximately 20 min at 37 C and washed three times with calcium- and magnesium-free PBS. The tissue was then dispersed to single cells in the same buffer containing 1 mg/ml bovine pancreas trypsin (Sigma-Aldrich, St. Louis, MO) and 30 μg/ml deoxyribonuclease 1 (Roche, Basel, Switzerland) for 15 min at 37 C, being vortexed for 10 sec every 5 min. After washing once with RPMI 1640 containing 10% (vol/vol) fetal bovine serum, cells were centrifuged at 250 × g and resuspended in less than 1 ml PBS. Cells were then filtered through a 40-μm filter and stained with propidium iodide (Sigma-Aldrich) before cell sorting. For mice 5–9 wk of age, animals were overdosed with anesthesia, the pancreas was distended with Liberase solution, and islets were isolated by digestion followed by separation with a density gradient, as described previously (16). After washing, islets were handpicked, dispersed, and prepared for cell sorting as above.
Flow cytometry
All samples were analyzed on a MoFlo cell sorter with Summit software (Cytomation, Fort Collins, CO) as previously described (11). For analysis of islet cells from MIP-GFP mice, the GFP signal was so strong that a neutral density filter was used to reduce brightness. Propidium iodide was used to exclude dead cells.
Quantitative RT-PCR
Quantitative real-time PCR was performed using the ABI 7300 real-time PCR system (Applied Biosystems, Foster City, CA) according to the manufacturer's instructions. The probe and primer sets of mouse insulin I (Assay ID Mm01259683_g1) and β-actin (Assay ID Mm00607939_s1) were purchased from Applied Biosystems. Total RNA was isolated from total cultured population using the RNeasy Mini kit (QIAGEN, Valencia, CA). To assess the integrity of total RNA, an aliquot of the RNA sample was run on a denaturing 1% agarose gel. Reverse transcription was performed using the High-Capacity cDNA kit (Applied Biosystems). cDNA (10 ng) was applied to each well, and levels of mRNA were determined as the average of three aliquots. Insulin mRNA expression was normalized to the mRNA of the internal control β-actin and then compared using the standard curve method. Serial diluted cDNA of GFP-positive β-cells from MIP-GFP mice was used as standard.
Immunocytochemistry
We dispersed isolated islet cells from adult MIP-GFP mice and sorted GFP-low, -medium, and -bright cells separately using three gates: the first, forward scatter (FSC) and side scatter (SSC); the second, pulse width; and the third, GFP and propidium iodide (PI). These sorted GFP-low, -medium, and -bright cells were cultured overnight on gelatin-coated dishes in DMEM supplemented with 10% (wt/vol) fetal bovine serum, 100 U/ml penicillin, and 100 μg/ml streptomycin at 37 C with 5% CO2, respectively. Then, cells were fixed with 4% (wt/vol) paraformaldehyde for 15 min and permeabilized for 15 min with 0.3% (wt/vol) Triton X-100 in PBS. After blocking with PBS containing 10% (wt/vol) BSA for 30 min, dishes of cells were incubated overnight with primary antibody (guinea pig anti-insulin I:200; Linco-Millipore, Bedford, MA) in PBS containing 3% (wt/vol) BSA, washed with PBS, and incubated with secondary antibody (Texas red-conjugated anti-guinea pig IgG; Jackson ImmunoResearch, Bar Harbor, ME) in PBS containing 3% (wt/vol) BSA for 1 h. This was followed by washing with PBS and mounting in glycerol medium. Lastly, 100 cells were randomly picked from the dish of GFP-low, -medium, and -bright subpopulations, and the number of insulin-positive cells in each subpopulation was counted with fluorescent microscopy (Olympus BH2, Center Valley, PA).
Reverse hemolytic plaque assay
Single β-cells were sorted by flow cytometry as described above, and insulin secretion of individual β-cells was measured using the RHPA as previously described (17). Sorted cells from each group were added to an 18% suspension of protein A-coated sheep red blood cells and introduced onto a poly-l-lysine-coated glass Cunningham chamber. They were challenged for 2 h with 2.6 or 16.8 mm glucose in Krebs-Ringer buffer in the presence of guinea pig anti-insulin antiserum (1:40, generated in our lab) and, after 30 min incubation with guinea pig complement (1:40, Calbiochem), fixed with 2.5% glutaraldehyde. Secreted insulin was revealed as a hemolytic plaque around each secreting cell. A secretion index was calculated by multiplying the average plaque area by the percentage of plaque-forming cells to determine the overall secretory activity of β-cells under a given experimental condition. To identify functional subpopulations of β-cells, a frequency histogram was constructed from data on the number of cell-forming immunoplaques.
Statistics analysis
Experimental results are expressed as the mean ± sem. Student's t test was used, and a P value < 0.05 was considered significant.
Results
Three populations of β-cells were identified from adult MIP-GFP mice by their differing GFP intensity
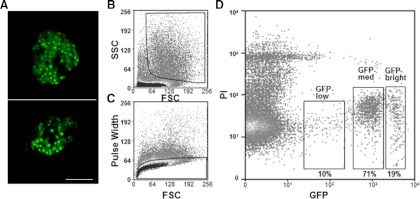
When examined with confocal microscopy, the β-cells in isolated islets from adult MIP-GFP mice showed clear variability in GFP intensity (Fig. 1A). GFP intensity of dispersed islet cells from adult mice (9 wk old) was analyzed with flow cytometry (Fig. 1, B–D), and three populations of β-cells were identified: 19% of cells had bright GFP intensity, 71% had medium, and 10% had low intensity (Fig. 1D).
Fig. 1.
Three populations of pancreatic β-cells were identified from adult MIP-GFP mice. A, Fluorescence images of pancreatic islets isolated from adult MIP-GFP mice, observed with confocal microscopy. Scale bar, 100 μm. B, The first gate for pancreatic β-cells was set to analyze cell size and granule density estimated by FSC and SSC, respectively. C, The second gate employed pulse width and was used to exclude doublets or other cell clusters. D, The third gate was set for GFP and PI to exclude GFP-negative cells and dead cells.
Dispersed islet cells from adult MIP-GFP mice were sorted using three gates. The first was for size and granule density estimated by FSC and SSC, respectively (Fig. 1B). The second gate employed pulse width to exclude doublets or other cell clusters (Fig. 1C). In our earlier study (11), we searched for the possible presence of such doublets or clusters in the sorted cells with microscopy and flow cytometry, and such aggregates could not be found.
The third gate was for GFP and PI to exclude GFP-negative cells and dead cells (Fig. 1D). We determined the percentage of β-cells in these GFP+ populations by immunostaining with anti-insulin antibody and found that 171 of 185 GFP-low cells (92%), 168 of 176 GFP-medium cells (95%), and 139 of 149 GFP-bright cells (93%) stained for insulin, respectively. These data indicate that most of the sorted GFP+ cells were β-cells.
β-Cell size and granularity of GFP-low, -medium, and -bright cells estimated by FSC and SSC
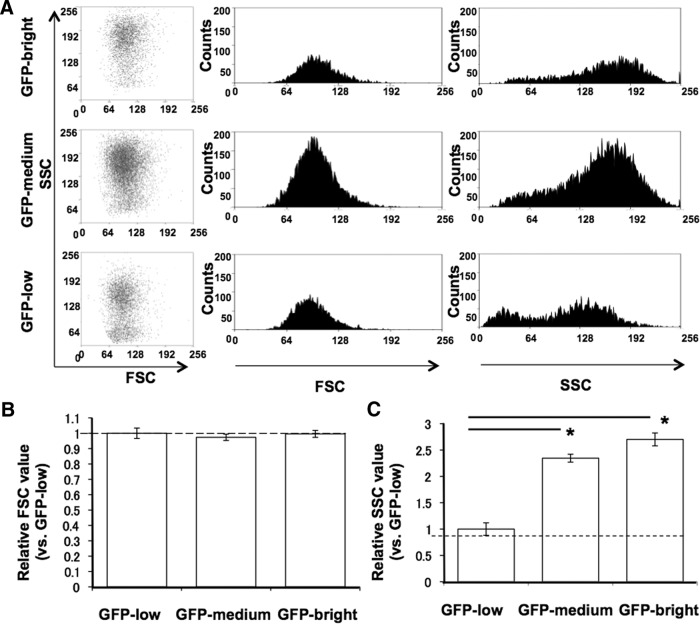
When β-cells from adult MIP-GFP were examined for size represented by FSC, GFP-low, -medium, and -bright populations did not differ (Fig. 2, A and B). However, with analysis of granularity by SSC, the cells in the GFP-low population had less granularity than those in the GFP-bright or GFP-medium populations as shown with normalized values: low, 1.00 ± 0.12; medium, 2.27 ± 0.27; and bright, 2.51 ± 0.12 (Fig. 2C).
Fig. 2.
FSC and SSC of GFP-low, -medium, and -bright cells from adult MIP-GFP mice (n = 4). A, Histogram of FSC and SSC of GFP-low, -medium, and -bright cells. B, Mean FSC value of GFP-low, -medium, and -bright as normalized to that of E15.5 GFP-low (equal to 1). C, Mean SSC value of GFP-low, -medium, and -bright as normalized to that of E15.5 GFP-low. *, P < 0.05.
Insulin gene expression and secretion in GFP-bright, -medium, and -low populations
With quantitative PCR, there was no significant difference in insulin I mRNA expression between the GFP-bright and GFP-medium populations, but that of the GFP-low population was less than half of the others (Fig. 3).
Fig. 3.
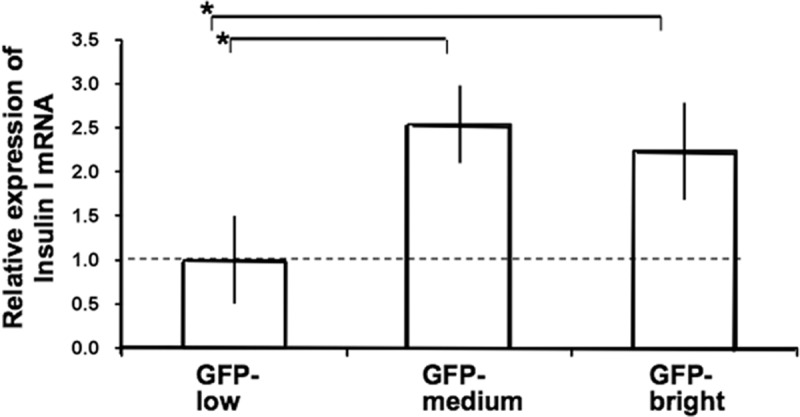
Quantitative RT-PCR analysis for insulin I gene expression in GFP-low, -medium, and -bright cells from adult MIP-GFP mice (n = 3). The mean insulin I expression level GFP-low was defined as the base value of 1.0. *, P < 0.05.
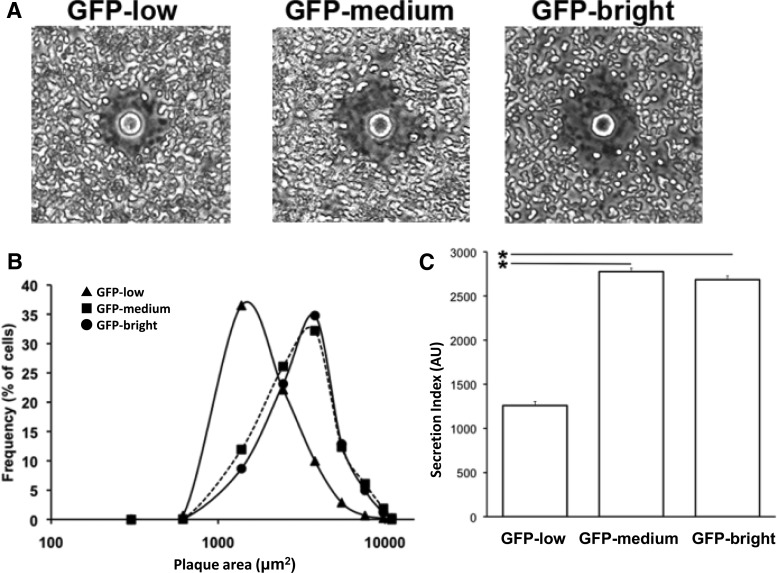
Insulin secretion was analyzed in single β-cells by RHPA analysis in which the hemolytic plaque area is proportional to the amount of insulin secreted per cell (Fig. 4A). The percentages of secreting cells in the three subpopulations were 73% in GFP-low, 91% in GFP-medium, and 86% in GFP-bright. Moreover, the GFP-low subpopulation secreted lower amounts of insulin in response to 16.8 mm glucose as indicated by the smaller plaque areas in the RHPA (Fig. 4B). When both parameters, percentage of secreting cells and plaque area, were combined into an overall indicator of insulin secretion from a given population (secretion index), GFP-medium and GFP-high had similar functional characteristics. The secretion index of GFP-low subpopulation was half that of the other populations (Fig. 4C) and was mainly due to decreased immunoplaque area. These results indicate that cells from the GFP-low subpopulation secrete less insulin in response to 16.8 mm glucose.
Fig. 4.
RHPA analysis for insulin secretion in GFP-low, -medium, and -bright cells from adult MIP-GFP mice. A, Representative hemolytic plaques around GFP-low, -medium, and -bright cells. B, Frequency distribution of hemolytic plaque area around GFP-low, -medium, and -bright cells. Triangles, squares, and circles represent data of GFP-low, -medium, and -bright cells, respectively. C, Secretion index of GFP-low, -medium, and -bright cells. The secretion index was calculated by multiplying the average plaque area by the percentage of plaque-forming cells to determine the overall secretory activity of β-cells under a given experimental condition. In B and C, the number of analyzed cells was 1041 in the GFP-bright population, 1715 in GFP-medium, and 330 in GFP-low, respectively. *, P < 0.05. This experiment is representative of a total of three.
Analysis of GFP+ cell populations from MIP-GFP mice at different ages
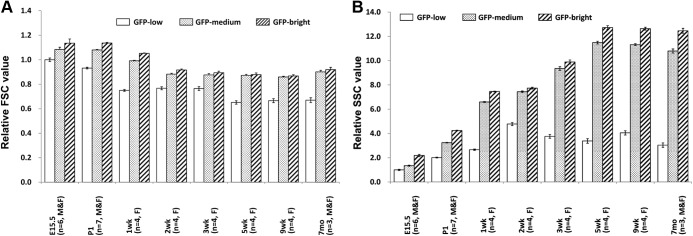
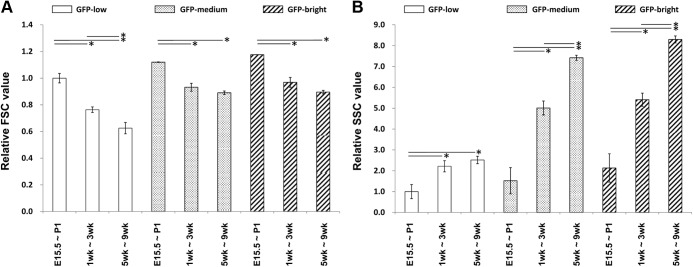
The size and granularity of the three populations were analyzed on cells from different ages from embryonic to adult. Cell size estimated by FSC decreased with age, reaching the adult level at 2 wk. Normalized to the values of E15.5 GFP-low cells, the mean FSC of GFP-low, -medium, and -bright cells were 1.00, 1.08, and 1.13 at E15.5 and 0.77, 0.88, and 0.91 at 2 wk, respectively (Fig. 5A).
Fig. 5.
Flow cytometry analysis for cell size and granularity of GFP-low, -medium, and -bright cells over time. A, Cell size of GFP-low, -medium, and -bright cells estimated by FSC. The FSC value of GFP-low at E15.5 is defined as 1. B, Granularity of GFP-low, -medium, and -bright cells estimated by SSC. SSC value of GFP-low at E15.5 is defined as 1. White, dotted, and striped bars represent GFP-low, -medium, and -bright populations, respectively. F, Female; M, male. Bars represent mean ± se.
In all three populations, granularity estimated by SSC increased with age until reaching the adult level at 5 wk. Normalized to the values of E15.5 GFP-low cells, the mean SSC of GFP-low, -medium, and -bright were 1.00, 1.35, and 2.19 at E15.5 and 3.38, 11.5, and 12.7 at 5 wk, respectively (Fig. 5B). For statistical analysis, the following groups of cells from female mice were combined as embryonic (E15.5 to P1; n = 13), preweaning (1–3 wk; n = 12), and postweaning (5–9 wk; n = 8) (Fig. 6). These data clearly show the greater cell size as assessed with FSC of fetal and preweaning β-cells compared with those from postweaning mice. The increases of granularity with age as determined by SSC were even more impressive. These changes were found in all three groups of differing GFP intensity. No significant difference was observed in the FSC and SSC values between adult (12–16 wk) and postweaning mice (data not shown).
Fig. 6.
Flow cytometry analysis for cell size and granularity of cells during fetal and neonatal preweaning and postweaning time periods. A, Cell size of GFP-low, -medium, and -bright cells estimated by FSC. FSC value of GFP-low at E15.5 to P1 is defined as 1. B, Granularity of GFP-low, -medium, and -bright cells estimated by SSC. The SSC value of GFP-low at E15.5 to P1 is defined as 1. White, dotted, and striped bars represent GFP-low, -medium, and -bright populations, respectively. The error bars represent ±se. For E15.5–P1, n = 13; 1–3 wk, n = 12; 5–9 wk, n = 8. *, P < 0.05.
Discussion
In this study, we showed that the heterogeneity of GFP expression in the islets of MIP-GFP mice can be seen in microscopic sections of islets. Moreover, with flow cytometry, three populations of β-cells with differing GFP brightness could be identified, which were classified as GFP-low, GFP-medium, and GFP-bright. The GFP-medium cells were the majority population comprising about 70% of the total. Of the sorted GFP-positive cells, over 90% could be co-stained for insulin. The few cells that did not stain for insulin remain to be understood, but because of studies indicating variability of insulin biosynthesis in β-cells (18), we suspect they are β-cells that contain very little insulin. This raises interesting questions about the relative contributions of transcription, translation, insulin degradation, and insulin secretion to such an end result (19). When the populations were evaluated for size with FSC, no differences in mean size could be found between the three populations. However, within each group, there was considerable variation in β-cell size as has been previously described in MIP-GFP mice (6). When granularity was assessed with SSC, the GFP-low population was clearly less than that of the other two populations. It has been previously reported that SSC of β-cells after glibenclamide stimulation have a similar reduction of granularity, which was accompanied by a marked reduction of insulin content (7).
Questions can be raised about whether this heterogeneity is dependent upon genetic background. This must await backcrossing MIP-GFP (C57BL/6J) to another genetic background. Another way to study heterogeneity might be to use a marker other than GFP. It has been shown that β-cells are heterogeneous for the cell surface marker polysialated-neural cell adhesion molecule in rat pancreas and that these populations have different secretory characteristics (20).
Our results with granularity are complementary to the insulin gene expression values, which were considerably lower in the GFP-low population than the two brighter populations. They were also consistent with the insulin secretion studies on single cells as determined with RHPA. It was of interest that although the secretion index was lower in the GFP-low group, some cells in the group had active secretion. In fact, considerable heterogeneity of secretion could be seen in all three groups.
GFP-positive cells from MIP-GFP mice of varying ages were also assessed with flow cytometry, and some clear differences emerged. β-Cells from the youngest mice (E15.5 and P1) were larger as determined by FSC than those obtained from mice 2 wk of age and older. This result is consistent with the finding by others that β-cells at 10 d of age in mice were larger than those at 45 d of age (21). The results for granularity assessed by SSC were even more striking, with a gradual increase from the low levels in embryonic β-cells until a plateau was reached after 3.5 wk of age. This has similar timing to the maturation of glucose-stimulated insulin release, which takes more than 4 wk in rodents (22). Similar temporal maturation occurs with β-cell transcription factors (23) and the gene expression of key metabolic pathways including mitochondrial shuttles (24). Given the similarities in granularity, insulin content and insulin secretion between immature β-cells and the GFP-low subpopulation, one can speculate that the latter represent a younger, recently formed, subpopulation within the adult mouse islet. It must be noted, however, that these data differ from those obtained with rat β-cells using microscopy (25, 26). In these latter studies, younger β-cells were smaller and did not have a reduction of insulin content.
These results add another dimension to the expanding knowledge about β-cell heterogeneity. Moreover, our approach using β-cells marked by GFP with flow cytometry provides a new way to study differences in β-cell phenotype, which remain poorly understood. There are many possibilities. At least some of these differences must be due to variation in β-cell maturation. In addition, for β-cells from older mice, there may be natural cycles of β-cell activity from fully active to quiescent. This possibility remains to be defined. The differences could also be related to the recently described phenomenon in rodents of a population of islets that is relatively hypoxic, has less blood flow, and is probably less active with regard to insulin secretion (15). An interesting question is whether these processes can be influenced by glucose. There are data indicating that quiescent cells can develop more active insulin secretion when cultured in media with high glucose (27). Moreover, the finding that neonatal β-cells are more active in offspring of diabetic mothers suggests that high glucose levels can accelerate the maturation of β-cells.
β-Cell replication in rodents is an active process (28), and the progeny could have an altered phenotype after division. Yet another possibility is that some heterogeneity is accounted for by differences in embryonic and neonatal pathways for β-cell differentiation. These are just a few of many possibilities, but additional work and advances in technology should provide answers to these questions that are important for our understanding of β-cell function and turnover in the pathogenesis of diabetes.
Acknowledgments
We thank Dr. Manami Hara for advice and J. LaVecchio and G. Buruzula for excellent technical assistance.
This study was supported by the Juvenile Diabetes Research Foundation, the National Institutes of Health (RO1-DK66056), the Flow Cytometry and Advanced Microscopy Cores of Joslin Diabetes and Endocrinology Research Center (P30 DK36836), and the Diabetes Research and Wellness Foundation.
Disclosure Summary: The authors have nothing to disclose.
Footnotes
- E0.5
- Embryonic d 0.5
- FSC
- forward scatter
- GFP
- green fluorescent protein
- MIP
- mouse insulin I gene promoter
- P0
- postnatal d 0
- PI
- propidium iodide
- RHPA
- reverse hemolytic plaque assay
- SSC
- side scatter.
References
- 1. Salomon D, Meda P. 1986. Heterogeneity and contact regulation of hormones secretion by individual beta-cells. Exp Cell Res 162:507–520 [DOI] [PubMed] [Google Scholar]
- 2. Stefan Y, Meda P, Neufeld M, Orci L. 1987. Stimulation of insulin secretion reveals heterogeneity of pancreatic β-cells in vivo. J Clin Invest 80:175–183 [DOI] [PMC free article] [PubMed] [Google Scholar]
- 3. Schuit FC, In't Veld PA, Pipeleers DG. 1988. Glucose stimulates proinsulin biosynthesis by a dose-dependent recruitment of pancreatic β-cells. Proc Natl Acad Sci USA 85:3865–3869 [DOI] [PMC free article] [PubMed] [Google Scholar]
- 4. Kiekens R, In 't Veld P, Mahler T, Schuit F, Van De Winkel M, Pipeleers D. 1992. Differences in glucose recognition by individual rat pancreatic β-cells are associated with intercellular differences in glucose-induced biosynthetic activity. J Clin Invest 89:117–125 [DOI] [PMC free article] [PubMed] [Google Scholar]
- 5. Heimberg H, De Vos A, Vandercammen A, Van Schaftingen E, Pipeleers D, Schuit F. 1993. Heterogeneity in glucose sensitivity among pancreatic β-cells is correlated to differences in glucose phosphorylatioin rather than glucose transport. EMBO J 12:2873–2879 [DOI] [PMC free article] [PubMed] [Google Scholar]
- 6. Leung YM, Ahmed I, Sheu L, Tsushima RG, Diamant NE, Hara M, Gaisano HY. 2005. Electrophysiological characterization of pancreatic islet cells in the mouse insulin promoter-green fluorescent protein mouse. Endocrinology 146:4766–4775 [DOI] [PubMed] [Google Scholar]
- 7. Ling Z, Wang Q, Stangé G, In't Veld P, Pipeleers D. 2006. Glibenclamide treatment recruits β-cell subpopulation into elevated and sustained basal insulin synthetic activity. Diabetes 55:78–85 [PubMed] [Google Scholar]
- 8. Bosco D, Rouiller DG, Halban PA. 2007. Differential expression of E-cadherin at the surface of rat β-cells as a marker of functional heterogeneity. J Endocrinol 194:21–29 [DOI] [PubMed] [Google Scholar]
- 9. de Vargas LM, Sobolewski J, Siegel R, Moss LG. 1997. Individual β-cells within the intact islet differentially respond to glucose. J Biol Chem 272:26573–26577 [DOI] [PubMed] [Google Scholar]
- 10. Martens GA, Wang Q, Kerckhofs K, Stangé G, Ling Z, Pipeleers D. 2006. Metabolic activation of glucose low-responsive β-cells by glyceraldehyde correlates with their biosynthetic activation in lower glucose concentration range but not at high glucose. Endocrinology 147:5196–5204 [DOI] [PubMed] [Google Scholar]
- 11. Katsuta H, Akashi T, Katsuta R, Nagaya M, Kim D, Arinobu Y, Hara M, Bonner-Weir S, Sharma AJ, Akashi K, Weir GC. 2010. Single pancreatic β-cells co-express multiple islet hormone genes in mice. Diabetologia 53:128–138 [DOI] [PMC free article] [PubMed] [Google Scholar]
- 12. Chiang MK, Melton DA. 2003. Single-cell transcript analysis of pancreas development. Dev Cell 4:383–393 [DOI] [PubMed] [Google Scholar]
- 13. Hara M, Wang X, Kawamura T, Bindokas VP, Dizon RF, Alcoser SY, Magnuson MA, Bell GI. 2003. Transgenic mice with green fluorescent protein-labeled pancreatic β-cells. Am J Physiol Endocrinol Metab 284:E177–E183 [DOI] [PubMed] [Google Scholar]
- 14. Szabat M, Luciani DS, Piret JM, Johnson JD. 2009. Maturation of adult β-cells revealed using a Pdx1/insulin dual-reporter lentivirus. Endocrinology 150:1627–1635 [DOI] [PubMed] [Google Scholar]
- 15. Olsson R, Carlsson PO. 2011. A low-oxygenated subpopulation of pancreatic islets constitutes a functional reserve of endocrine cells. Diabetes 60:2068–2075 [DOI] [PMC free article] [PubMed] [Google Scholar]
- 16. Gotoh M, Maki T, Kiyoizumi T, Satomi S, Monaco AP. 1985. An improved method for isolation of mouse pancreatic islets. Transplantation 40:437–438 [DOI] [PubMed] [Google Scholar]
- 17. Aguayo-Mazzucato C, Sanchez-Soto C, Godinez-Puig V, Gutiérrez-Ospina G, Hiriart M. 2006. Restructuring of pancreatic islets and insulin secretion in a postnatal critical window. PLoS ONE 1:e35. [DOI] [PMC free article] [PubMed] [Google Scholar]
- 18. Bosco D, Meda P. 1991. Actively synthesizing β-cells secrete preferentially after glucose stimulation. Endocrinology 129:3157–3166 [DOI] [PubMed] [Google Scholar]
- 19. Marsh BJ, Soden C, Alarcón C, Wicksteed BL, Yaekura K, Costin AJ, Morgan GP, Rhodes CJ. 2007. Regulated autophagy controls hormone content in secretory-deficient pancreatic endocrine β-cells. Mol Endocrinol 21:2255–2269 [DOI] [PubMed] [Google Scholar]
- 20. Karaca M, Castel J, Tourrel-Cuzin C, Brun M, Géant A, Dubois M, Catesson S, Rodriguez M, Luquet S, Cattan P, Lockhart B, Lang J, Ktorza A, Magnan C, Kargar C. 2009. Exploring functional β-cell heterogeneity in vivo using PSA-NCAM as a specific marker. PLoS ONE 4:e5555. [DOI] [PMC free article] [PubMed] [Google Scholar]
- 21. Herbach N, Bergmayr M, Göke B, Wolf E, Wanke R. 2011. Postnatal development of numbers and mean sizes of pancreatic islets and β-cells in healthy mice and GIPR(dn) transgenic diabetic mice. PLoS ONE 6:e22814. [DOI] [PMC free article] [PubMed] [Google Scholar]
- 22. Bliss CR, Sharp GW. 1992. Glucose-induced insulin release in islets of young rats: time-dependent potentiation and effects of 2-bromostearate. Am J Physiol 263:E890–E896 [DOI] [PubMed] [Google Scholar]
- 23. Aguayo-Mazzucato C, Koh A, El Khattabi I, Li WC, Toschi E, Jermendy A, Juhl K, Mao K, Weir GC, Sharma A, Bonner-Weir S. 2011. Mafa expression enhances glucose-responsive insulin secretion in neonatal rat β-cells. Diabetologia 54:583–593 [DOI] [PMC free article] [PubMed] [Google Scholar]
- 24. Jermendy A, Toschi E, Aye T, Koh A, Aguayo-Mazzucato C, Sharma A, Weir GC, Sgroi D, Bonner-Weir S. 2011. Rat neonatal β-cells lack the specialised metabolic phenotype of mature β-cells. Diabetologia 54:594–604 [DOI] [PMC free article] [PubMed] [Google Scholar]
- 25. Chintinne M, Stangé G, Denys B, In 't Veld P, Hellemans K, Pipeleers-Marichal M, Ling Z, Pipeleers D. 2010. Contribution of postnatally formed small β-cell aggregates to functional β-cell mass in adult rat pancreas. Diabetologia 53:2380–2388 [DOI] [PubMed] [Google Scholar]
- 26. Scaglia L, Cahill CJ, Finegood DT, Bonner-Weir S. 1997. Apoptosis participates in the remodeling of the endocrine pancreas in the neonatal rat. Endocrinology 138:1736–1741 [DOI] [PubMed] [Google Scholar]
- 27. Van Schravendijk CF, Kiekens R, Pipeleers DG. 1992. Pancreatic β-cell heterogeneity in glucose-induced insulin secretion. J Biol Chem 267:21344–21348 [PubMed] [Google Scholar]
- 28. Brelje TC, Parsons JA, Sorenson RL. 1994. Regulation of islet β-cell proliferation by prolactin in rat islets. Diabetes 43:263–273 [DOI] [PubMed] [Google Scholar]


