

Abstract
Obesity is characterised by increased storage of fatty acids in an expanded adipose tissue mass and in peripheral tissues such as the skeletal muscle and liver, where it is associated with the development of insulin resistance. Insulin resistance also develops in the central nervous system with high-fat feeding. The capacity for hypothalamic cells to accumulate/store lipids, and the effects of obesity remain undefined. The aims of this study were (1) to examine hypothalamic lipid content in mice with increased dietary fat intake and in obese ob/ob mice fed a low-fat diet, and (2) to determine whether endurance exercise training could reduce hypothalamic lipid accumulation in high-fat fed mice. Male C57BL/6 mice were fed a low- (LFD) or high-fat diet (HFD) for 12 weeks; ob/ob mice were maintained on a chow diet. HFD-exercise (HFD-ex) mice underwent 12 weeks of high-fat feeding with 6 weeks of treadmill exercise training (increasing from 30 to 70 min day−1). Hypothalamic lipids were assessed by unbiased mass spectrometry. The HFD increased body mass and hepatic lipid accumulation, and induced glucose intolerance, while the HFD-ex mice had reduced body weight and improved glucose tolerance. A total of 335 lipid molecular species were identified and quantified. Lipids known to induce insulin resistance, including ceramide (22%↑), diacylglycerol (25%↑), lysophosphatidylcholine (17%↑), cholesterol esters (60%↑) and dihexosylceramide (33%↑), were increased in the hypothalamus of HFD vs. LFD mice. Hypothalamic lipids were unaltered with exercise training and in the ob/ob mice, suggesting that obesity per se does not alter hypothalamic lipids. Overall, hypothalamic lipid accumulation is regulated by dietary lipid content and is refractory to change with endurance exercise training.
Key points
‘Lipotoxicity’ refers to the excessive accumulation of lipids in non-adipose tissues that causes cellular dysfunction and, in severe cases, cell death. Lipotoxicity is often present in obesity.
It is unknown whether lipotoxicity occurs in the hypothalamus of the brain, an area involved in the regulation of feeding behaviour and energy balance.
We show that high-fat feeding results in increased lipid content in the hypothalamus, including triacylglycerol, diacylglycerol and ceramide, which was not reduced with 6 weeks of exercise training.
The obese leptin-deficient ob/ob mouse fed a chow diet had normal hypothalamic lipid content.
These data show that dietary lipids regulate hypothalamic lipid accumulation, which is not readily reversed by exercise training.
Introduction
The term ‘lipotoxicity’ was coined by Unger and colleagues almost two decades ago and refers to the excessive accumulation of lipids in non-adipose tissues that causes cellular dysfunction and, in severe cases, apoptotic cell death (Lee et al. 1994; Unger, 2003). For example, the sphingolipid ceramide induces pancreatic β-cell failure and apoptosis (Shimabukuro et al. 1998), several lipid species cause insulin resistance in skeletal muscle and liver (Watt & Steinberg, 2008) and lipid accumulation is related to cardiomyopathy and heart failure (Khan et al. 2010). In light of the widely accepted association between excessive lipid accumulation and dysregulated cell function in obesity, it is surprising that few studies have examined whether lipotoxicity extends to the central nervous system (CNS).
Discrete regions of the CNS detect neural, endocrine and metabolic signals from the periphery to monitor whole-body nutrient availability. While not discounting the input of neuronal types located elsewhere in the brain, specialised neurons localised within the arcuate nucleus of the hypothalamus are critical regulators of feeding behaviour and body weight. This is largely attributable to the compromised blood–brain barrier in this region (Peruzzo et al. 2000). Plasma fatty acids cross the blood–brain barrier and gain access into the cerebrospinal fluid (CSF) (Miller et al. 1987; Freed et al. 1994) where CSF fatty acids generally reflect plasma fatty acid levels (Miller et al. 1987; Rapoport, 1996). Hypothalamic fatty acid uptake is increased in patients with the metabolic syndrome (Karmi et al. 2010); however, the rate of fatty acid β-oxidation is very low in the hypothalamus (Lennox, 1931), indicating that fatty acids do not serve as an important metabolic substrate for ATP production. This apparent mismatch between fatty acid availability/uptake and oxidation suggests that fatty acids are stored in the hypothalamus; however, the capacity for hypothalamic cells to accumulate/store lipids, the resulting type of stored lipid and the effect of these lipids on energy homeostasis remain undefined. In light of the apparent inability of the hypothalamus to modulate fatty acid oxidation when fatty acid delivery is increased, we postulate that the various cell types located in the hypothalamus would also be susceptible to lipotoxic outcomes. Indeed, diets enriched with the fatty acid palmitate (C16:0) promote diacylglycerol accumulation (Benoit et al. 2009) and apoptosis (Moraes et al. 2009) in the brain. Therefore, the first aim of the present study was to examine the effects of high-fat feeding on hypothalamic lipid species accumulation. Understanding the fate of fatty acids bears relevance for understanding the bases of cellular processes, including energy metabolism, and the pathogenesis of lipid related disease.
Physical activity (exercise) reduces body weight and adiposity, increases daily energy expenditure and is prescribed to enhance fatty acid oxidation, reduce tissue lipid content and enhance insulin action in peripheral tissues (Ross et al. 2000; He et al. 2004; Hu et al. 2004; Goodpaster et al. 2010). While these effects are well described in cardiac and skeletal muscle, liver and adipose tissue, the effects of exercise on hypothalamic lipid content remains unresolved. Thus, the second aim of this study was to examine the effect of regular endurance exercise training on lipid accumulation in the hypothalamus. We hypothesised that a high-fat diet and obesity in ob/ob mice would cause lipid accumulation in the hypothalamus and that regular exercise would reduce hypothalamic lipid levels in the setting of rodent obesity. We addressed these questions by performing unbiased mass spectrometry analysis on hypothalamic lysates obtained from mice fed a low-fat or high-fat diet that were sedentary or subjected to regular endurance exercise training.
Methods
Ethical approval
All experimental procedures were approved by the School of Biomedical Sciences Animal Ethics Committee (Monash University) and conformed to National Health and Medical Research Council (Australia) guidelines regarding the care and use of experimental animals. In addition, the authors have ensured that the experiments comply with the policies of The Journal of Physiology outlined by Drummond (2009) and the UK regulations on animal experimentation.
Animal care and husbandry
Male mice (C57BL/6) were purchased from Monash Animal Services. Mice were randomly assigned to their respective diets at 8 weeks of age, which consisted of a low-fat diet (n = 14) (5% energy from fat, LFD) or a high-fat micronutrient matched diet (n = 23) (59% energy from fat, HFD) ad libitum for 12 weeks (Specialty Feeds, Glen Forrest, WA, Australia). The LFD was composed of 15.6% saturated, 45.2% monounsaturated and 39.2% polyunsaturated fatty acids, while the HFD was composed of 60.3% saturated, 32.9% monounsaturated and 6.7% polyunsaturated fatty acids. The fatty acid compositions of the diets are provided in Supplementary Table 1. Body mass was monitored weekly throughout the course of the study. ob/ob mice were purchased from Monash Animal Services at 8 weeks of age and were maintained on a standard rodent chow (9% energy from fat) until 12–14 weeks of age (n = 6).
Treadmill exercise
After 6 weeks of feeding, mice within the HFD group were randomised to either a sedentary (n = 13) or endurance exercise trained group (n = 10). The exercise programme consisted of treadmill running once daily, five times a week for 6 weeks. The exercise intensity and duration were progressively increased (Supplementary Table 2).
Endurance capacity test
An endurance test was performed on all mice before and after the exercise training period to assess endurance capacity. Mice commenced running on the treadmill at 10 m min−1 and the speed was gradually increased to 17 m min−1 over 3 min, at a 5% slope until exhaustion, which was defined as sitting at the base of the treadmill and not attempting to re-engage the treadmill with manual prompting from the experimenter.
Glucose tolerance test (GTT)
Glucose tolerance testing was conducted in the last week of training, allowing two exercise free days before the test. Mice were fasted for 4 h and blood glucose was measured at 11.00 h before and after a bolus of glucose (2 g (kg body weight)−1, 50%d-glucose in water) was injected intraperitonealy. Blood glucose was measured from the tip of the tail at 0, 15, 30, 45, 60, 90 and 120 min, using a glucometer (Accu-Chek, Roche). As an index of glucose tolerance, the incremental area under the curve was calculated from the blood glucose profiles using the 0 min time point as the baseline.
Analytical methods
Mice were killed 3 days after the last exercise bout to preclude acute effects on the measured variables. Mice were fasted for 4 h (11.00 h), anaesthetized via isoflurane inhalation and killed by decapitation; trunk blood was collected in tubes containing ethylenediaminetetraacetic acid (EDTA). Whole blood was centrifuged for 2 min at 8,000 × g and plasma collected for analysis. Free fatty acids (FAs; Wako Pure Chemical Industries, Osaka, Japan) and triacylglycerol (TAG) were measured by enzymatic colorimetric assays (GPO-PAP reagent, Roche Diagnostics). Alanine transaminase (ALT) and aspartate transferase (AST) were measured using as commercial kits (Thermo Electron, Melbourne, Australia). TAGs were extracted from peripheral tissues using the method of Folch et al. (1957) and quantified using an enzymatic colorimetric method (GPO-PAP reagent, Roche Diagnostics).
Immunoblotting
Hypothalamic lysates normalised for protein concentration (BCA method, Pierce Kit, Progen Industries, Darra, QLD, Australia) were solubilised in Laemmeli sample buffer and boiled for 5 min. They were then resolved by SDS-PAGE on 10% polyacrylamide gels, transferred to a polyvinylidenefluoride membrane, blocked with 5% milk for 1 h and probed with the appropriate primary antibody overnight at 4°C. After washing and incubation with a rabbit horseradish peroxidase-conjugated secondary antibody (Amersham Biosciences, Castle Hill, NSW, Australia), the immunoreactive proteins were detected with enhanced chemiluminescence and quantified by densitometry (ImageJ, NIH). The following primary antibodies from Cell Signaling Technology, Inc. (Danvers, MA, USA) were used: rabbit anti-phospho-JNK 1:1000 (Thr183/Tyr185) (no. 4671), rabbit anti-IκBα 1:500 (no. 4812), and from Sigma-Aldrich Pty, Ltd (Sydney, Australia), rabbit anti-α-actin 1:4000 (no. A5060). Phospho JNK was corrected for total protein loaded using a Ponceau S stain (Sigma-Aldrich Pty, Ltd, Sydney, Australia).
Electrospray ionisation-tandem mass spectrometry of hypothalamic lipids
The hypothalamus was removed (defined caudally by the mamillary bodies, rostrally by the optic chiasm, laterally by the optic tract, and superiorly by the apex of the hypothalamic third ventricle). The whole hypothalamus (approximately 10–15 mg) was homogenised in modified RIPA buffer (Tris-HCl 50 mm, NaCl 150 mm, EDTA 1 mm, NaF 1 mm, 1 × protein inhibitor (Roche), pH 7.4) and 20–50 μg protein (15–25 μl) was extracted with chloroform–methanol (2:1; 20 vol) with the addition of internal standards (Meikle et al. 2011). Samples were spun on a rotary mixer, sonicated, centrifuged and the supernatant dried under N2. They were then reconstituted in water saturated butanol (50 μl) and MeOH (50 μl) each containing 10 mm ammonium formate and centrifuged for 10 min. Analysis was performed on the supernatant by electrospray ionisation-tandem mass spectrometry (ESI/MS) using an AB Sciex 4000 Q/TRAP mass spectrometer with a turbo-ionspray source and Analyst 1.5 data system. Quantification of individual lipid species was performed using scheduled multiple-reaction monitoring in positive ion mode and Multiquant v1.2. Total lipid concentration of each class was calculated by summing the individual lipid species. The intra-assay coefficient of variation was 13.8 ± 0.5% (median ± SEM, across 325 lipids). The inter-day variability is not relevant because all samples were extracted and analysed on the same day.
Statistical analysis
All results are expressed as the mean ± SEM. Statistical analysis was performed by employing Student's t test for unpaired data, with LFD or HFD mice as the control. Body weight and the glucose tolerance test were analysed using a repeated measures two-way ANOVA with Bonferroni post hoc test. Metabolic data was analysed using a one-way ANOVA with a Dunnart's post hoc test, with HFD as the control group. Significance was established at the P < 0.05 level.
Results
Metabolic characterisation of mice in response to high-fat feeding and exercise training
The body mass of HFD mice was increased compared with LFD and exercise training did not affect absolute body mass in the HFD mice (Table 1). When expressed as a percentage of starting body mass, HFD-ex mice weighed less than HFD sedentary mice after 4 weeks of training, and this was maintained until the cessation of experiments (Fig. 1A). The epididymal fat mass was increased in HFD vs. LFD; however, exercise training did not significantly decrease epididymal fat mass (Fig. 1B). Liver triacylglycerol was increased with HFD and unaffected by exercise training (Fig. 1C). Exercise training increased running capacity in HFD mice as demonstrated by a 2.6-fold increase in the time to exhaustion during an endurance running capacity test (Fig. 1D). There was no change in running endurance in the LFD and HFD groups. Fasting blood glucose was increased in HFD vs. LFD and was reduced by exercise training (Table 1). Glucose tolerance was impaired in HFD vs. LFD mice, and was improved with exercise training. (Fig. 1E). Liver TAG is strongly correlated with whole body glucose tolerance (r2 = 0.571, P = 0.007). Surprisingly, fasting plasma FFA and TAG concentrations were decreased in the HFD vs. LFD (Table 1). Thus, exercise training induced marked changes in aerobic capacity and glucose tolerance, but mild alterations in blood lipids and body mass. High-fat feeding is accompanied by obesity in mice (Fig. 1A). Therefore, to differentiate the effects of obesity per se and high-fat feeding we examined lipids in the hypothalamus of ob/ob mice fed a chow diet. The ob/ob mice are obese, possess many characteristics of other murine obesity models including insulin resistance, hyperlipidaemia and hypertension and are routinely used in studies examining obesity (Turpin et al. 2009). It is noteworthy that the ob/ob mouse is leptin deficient and does not faithfully recapitulate the HFD model, which is leptin resistant and hyperleptinaemic.
Table 1.
Body mass, glucose tolerance and plasma metabolites of mice after low-fat or high-fat feeding, and high-fat feeding with regular exercise training
| LFD | HFD | HFD-ex | |
|---|---|---|---|
| Initial body weight (g) | 23.0 ± 0.5 | 22.5 ± 0.6 | 23. 6 ± 0.7 |
| Final body weight (g) | 31.1 ± 0.7* | 36.8 ± 1.2 | 34.2 ± 1.1 |
| Δ body weight (g) | 8.1 ± 0.6* | 14.3 ± 1.0 | 10.8 ± 0.9* |
| Blood glucose (mmol l−1) | 8.0 ± 0.3* | 10.7 ± 0.4 | 9.1 ± 0.3* |
| GTT iAUC | 667 ± 99* | 1676 ± 192 | 887 ± 179* |
| Plasma FFA (mmol l−1) | 0.67 ± 0.06* | 0.43 ± 0.05 | 0.38 ± 0.04 |
| Plasma TAG (mmol l−1) | 3.27 ± 0.38* | 2.31 ± 0.38 | 1.98 ± 0.24 |
| Plasma ALT (activity U l−1) | 10.6 ± 1.3 | 11.5 ± 1.5 | 10.1 ± 0.8 |
| Plasma AST (activity U l−1) | 44.9 ± 7.3 | 45.5 ± 3.3 | 42.5 ± 6.1 |
n = 5–10 per group. GTT iAUC = glucose tolerance test incremental area under the curve, FFA = free fatty acid, TAG = triacylglycerol, ALT = alanine aminotransferase, AST = aspartate aminotransferase.
P < 0.05 vs. HFD.
Figure 1. Metabolic characterisation of mice in response to high-fat feeding and exercise training.
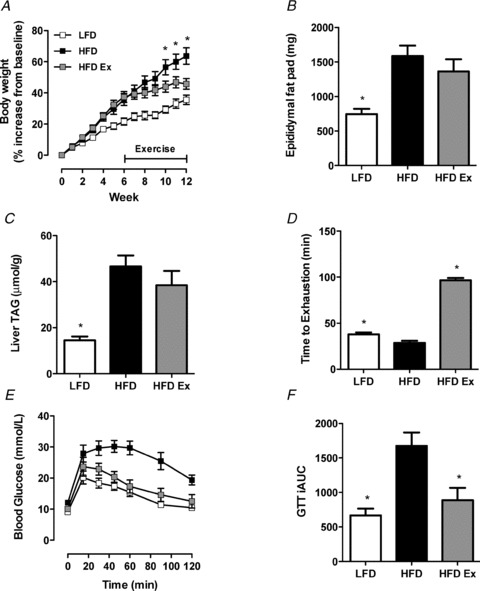
A, changes in body weight presented as a percentage of starting body weight. n = 10 per group, *P < 0.05 HFD vs. HFD-ex at specific time point. B, epididymal fat pads were excised and weighed at time of killing. n = 10, per group *P < 0.05 vs. HFD. C, livers were excised from LFD, HFD and HFD-ex mice and TAG content analysed. n = 8 per group, *P < 0.05 vs. HFD. D, an endurance test was performed on all mice before and after the 6 weeks of exercise training. LFD (n = 10), HFD (n = 10) HFD-ex (n = 5), *P < 0.05 vs. HFD. E, glucose tolerance tests were performed for LFD, HFD and HFD-ex mice at the end of the exercise period. n = 5 per group. F, the incremental area under the curve was calculated from the GTT data. n = 5 per group, *P < 0.05 vs. HFD.
Hypothalamic lipids increase in response to high-fat feeding, but are not changed in ob/ob mice or with exercise training
A total of 335 molecular lipid species were identified in hypothalamic extracts. A summary of the lipid species and the most common molecular species within lipid types is given in Table 2.
Table 2.
Overview of lipid species in hypothalamic analysis
| Species Name | Abbreviation | No. of species identified | Most abundant species | % of total lipid class |
|---|---|---|---|---|
| Free cholesterol | COH | 1 | — | — |
| Phosphatidylcholine | PC | 31 | 34:1 | 17 |
| Diacylglycerol | DAG | 25 | 16:0 18:0 | 39 |
| Phosphatidylserine | PS | 7 | 40:6 | 43 |
| Phosphatidylinositol | PI | 20 | 38:4 | 46 |
| Phosphatidylethanolamine | PE | 31 | 18:0/22:6 | 21 |
| Monohexosylceramide | MHC | 6 | 24:1 | 58 |
| Sphingomyelin | SM | 10 | 18:0 | 71 |
| Alkenylphosphatidylethanolamine | PE(P) | 12 | 18:0/22:5 | 19 |
| Lysophosphatidylcholine | LPC | 21 | 16:0 | 45 |
| Triacylglycerol | TAG | 41 | 16:0 16:0 18:0 | 44 |
| Ceramide | Cer | 6 | 18:0 | 81 |
| Alkylphosphatidylethanolamine | PE(O) | 13 | 40:4 | 25 |
| Alkenylphosphatidylcholine | PC(P) | 14 | 38:6 | 61 |
| Alkylphosphatidylcholine | PC(O) | 23 | 34:1 | 35 |
| Odd chain phosphatidylcholine | Odd PC | 17 | 35:1 | 35 |
| Hydroxysphingomyelin | SM(OH) | 8 | 22:1 | 51 |
| Cholesterol ester | CE | 21 | 16:0 | 24 |
| Phosphatidylglycerol | PG | 4 | 16:0 18:1 | 72 |
| Dihexosylceramide | DHC | 6 | 18:0 | 53 |
| GM3 ganglioside | GM3 | 6 | 18:0 | 84 |
| Bis(monoacylglycero)phosphate | BMP | 1 | 18:1 18:1 | — |
| Dihydroceramide | dhCer | 6 | 18:0 | 74 |
| Trihexosylceramide | THC | 2 | 18:0 | 91 |
Phospholipids
Phospholipids constitute ∼60% of the plasma membrane and >90% of some organelle membranes such as mitochondria (McMurchie, 1988). The most abundant phospholipid indentified was phosphatidylcholine (PC), followed by phosphatidylserine (PS), phosphatidylinositol (PI), phosphatidylethanolamine (PE), alkenylphosphatidylethanolamine (PE(P)), lysophosphatidylcholine (LPC), alkylphosphatidylethanolamine (PE(O)), alkenylphosphatidylcholine (PC(P)), alkylphosphatidylcholine (PC(O)), odd chain phosphatidylcholine (odd PC), phosphatidylglycerol (PG) and bis(monoacylglycero)phosphate (BMP) in descending order. PC(O) (P = 0.03, ↑13%) and BMP (P = 0.04, ↑24.6%) contents were increased in the hypothalamus of HFD vs. LFD mice, and LPC (P = 0.07, ↑12.8%), PC (P = 0.09,↑ 13.2%), PC(P) (P = 0.08, ↑11.7%) and PG (P = 0.09 ↑10.8%) tended to increase (Fig. 2A). Phospholipids were largely unaltered in ob/ob vs. LFD (Fig. S1A) or HFD-ex vs. HFD mice with the exception of PG (P = 0.06, ↓13.1%) (Fig. S2A).
Figure 2. Hypothalamic lipid accumulation in response to high-fat feeding.
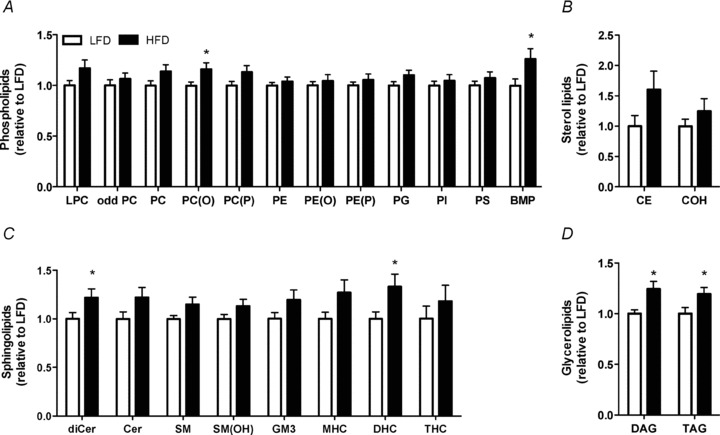
The hypothalamus was excised from LFD and HFD mice and analysed for total lipid content. A, phospholipid content, lysophosphatidylcholine (LPC), odd chain phosphatidylcholine (odd PC), phosphatidylcholine (PC), alkylphosphatidylcholine (PC(O)), alkenylphosphatidylcholine (PC(P)), phosphatidylethanolamine (PE), alkylphosphatidylethanolamine (PE(O)), alkylphosphatidylethanolamine (PE(P)), phosphatidylglycerol (PG), phosphatidylinositol (PI) and phosphatidylserine (PS). bis(monoacylglycero)phosphate (BMP) B, sterol lipid content, cholesterol ester (CE) and cholesterol (COH). C Sphingolipids dihydroceramide (dhCer), ceramide (Cer), sphingomyelin (SM), hydroxyphingomyelin (SM(OH)), GM3 ganglioside (GM3), monohexosylceramide (MHC), dihexosylceramide (DHC) and trihexosylceramide (THC). D Glycerolipid content, diacylglycerol (DAG) and triaclyglycerol (TAG). LFD, white bars, HFD black bars. n = 13–14 per group, *P < 0.05 vs. LFD.
Sterol lipids
Sterol lipids are important components of biological membranes and can act as hormones and signalling molecules. The most abundant sterol lipid quantified was free cholesterol (COH) followed by cholesterol esters (CE). CE tended to be increased in the hypothalamus of HFD vs. LFD mice (P = 0.09, ↑82.4%) (Fig. 2B). CE and COH were unchanged in the hypothalamus of ob/ob vs. LFD (Fig. S1B) and HFD-ex vs. HFD mice (Fig. S2B).
Sphingolipids
Sphingolipids play important roles in signal transmission and cell recognition, while sphingolipid metabolites, such as ceramide, participate in numerous signalling cascades that result in apoptosis, proliferation and inflammation. The most abundant sphingolipid identified was monohexosylceramide (MHC), followed by sphingomyelin (SM), ceramide (Cer), hydroxysphingomyelin (SM(OH)), dihexosylceramide (DHC), GM3 ganglioside (GM3), dihydroceramide (dhCer) and trihexosylceramide (THC) in descending order. dhCer (P = 0.05, ↑25.4%) and DHC (P = 0.03, ↑39.8%) contents were increased in the hypothalamus of HFD vs. LFD mice while Cer (P = 0.08, ↑25.4%), SM (P = 0.07, ↑12.9%) and MHC (P = 0.08, ↑22.7%) tended to increase (Fig. 2C). THC content was the only sphingolipid lipid increased in ob/ob vs. LFD mice (P < 0.0001, ↑132%) (Fig. S1C). Sphingolipids were unchanged in the hypothalamus of HFD-ex vs. HFD mice (Fig. S2C).
Glycerolipids
Diacylglycerol (DAG) (P = 0.006, ↑23.1%) and triacylglycerol (TAG) (P = 0.04, ↑23.9%) contents were increased in the hypothalamus of HFD vs. LFD mice (Fig. 2D). Glycerolipids were unchanged in the hypothalamus of ob/ob vs. LFD (Fig. S1D) and HFD vs. HFD-ex mice (Fig. S2D).
High-fat feeding causes remodelling of hypothalamic lipid species known to cause insulin resistance
The increase in DAG accumulation in the hypothalamus of HFD mice (Fig. 2D) was attributed to an increase in both saturated and mono-unsaturated fatty acids (MUFAs) (Fig. 3A), which was unexpected because the HFD contains a smaller percentage of MUFAs compared with the LFD (32.9%vs. 45.2%, respectively). This suggests post-prandial modification of lipids prior to storage. Similarly, the increased TAG accumulation in the hypothalamus of HFD mice (Fig. 2D) was attributed to an increase in both saturated FAs and MUFAs (Fig. 3D). There were no further changes observed in the fatty acid content of DAGs or TAGs in obese ob/ob or HFD-ex hypothalami (Fig. S3B–D). The composition of intracellular fatty acids in various lipid pools is often reflective of the dietary fatty acid composition (e.g. increasing dietary PUFAs increases intracellular PUFA storage) (Lee et al. 2006). However, the changes in the fatty acid composition of TAG, DAG and phospholipids within the hypothalamus were not reflected by the marked differences in the fatty acid composition between the LFD and HFD (Fig. S4).
Figure 3. Hypothalamic DAG and TAG fatty acid content in response to high-fat feeding.
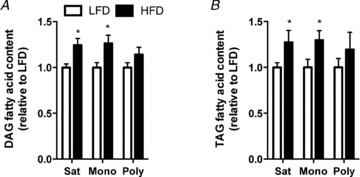
Hypothalamic DAG (A) and TAG (B) content was analysed for the total amount of saturated (Sat), monounsaturated (Mono) and polyunsaturated (Poly) fatty acids. LFD, white bars; HFD, black bars; n = 13–14 in each group, *P < 0.05 vs. LFD.
The accumulation of ceramides and DAGs had been implicated in the development of insulin resistance in peripheral tissues; therefore we looked more closely at individual species changes of these lipids in the hypothalamus. Ceramide species 18:0 (P = 0.05, 24.8%), 22:0 (P = 0.01, 29.1%) and 24:0 (P = 0.02, 28.9%) were increased in the hypothalamus of HFD vs. LFD mice (Fig. 4A), while ceramide species 20:0 (P = 0.06, ↑12.2%) and 24:1 (P = 0.09, ↑38.5%) tended to increase. The 10 most abundant DAG species were analysed. DAG species 14:0 16:0 (P = 0.004, 13.9%), 18:1 18:1 (P = 0.005, 31.4%), 16:0 20:0 (P = 0.003, 22.7%), 18:0 18:1 (P = 0.02, 25.0%), 16:0 18:1 (P = 0.008, 24.8%), 16:0 16:0 (P = 0.0002, 20.2%), 18:0 18:0 (P = 0.004, 25.5%), and 16:0 18:0 (P = 0.0005, 24.5%) were all increased in the hypothalamus of HFD vs. LFD mice (Fig. 4B).
Figure 4. Individual species of hypothalamic bioactive lipids in response to high-fat feeding.
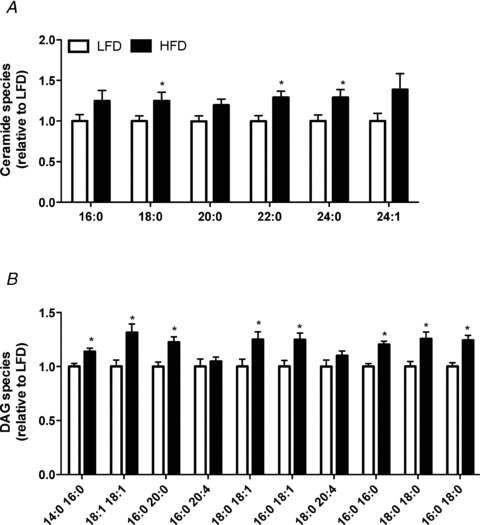
A, individual ceramide species. B, the 10 most abundant diacylglycerol (DAG) species. LFD, white bars; HFD, black bars; n = 13–14 in each group, *P < 0.05 vs. LFD.
Hypothalamic serine/threonine kinase signalling in response to high-fat feeding, obesity and exercise training
High-fat feeding and obesity are associated with low grade inflammation and activation of pro-inflammatory serine/threonine kinases (Wellen & Hotamisligil, 2005). The NF-κB pathway was activated in the hypothalamus of HFD vs. LFD (Fig. 5A) and ob/ob mice (Fig. 5B) as demonstrated by reduced IκBα expression. IκBα expression was increased with exercise training in high-fat fed mice (Fig. 5C), indicating that regular exercise training was able to partially attenuate hypothalamic pro-inflammatory signalling induced by high-fat feeding. In contrast, hypothalamic JNK signalling was not affected by obesity or exercise training (Fig. 5D–F).
Figure 5. Hypothalamic stress signalling in response to high-fat feeding, obesity and exercise training.
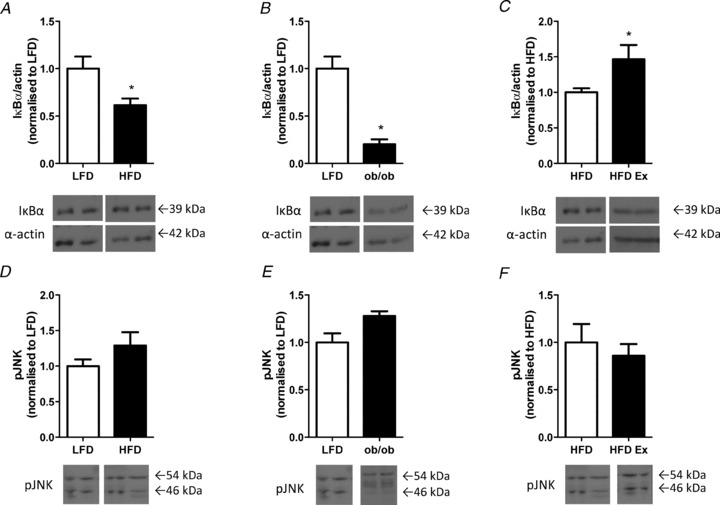
The hypothalamus was excised and analysed for IκBα protein expression in LFD vs. HFD (A), LFD vs. ob/ob (B), and in HFD vs. HFD-ex (C). The hypothalamus was also analysed for pJNK protein expression in LFD vs. HFD (D), LFD vs. ob/ob (E) and HFD vs. HFD-ex (F). n = 3–11 per group, *P < 0.05 vs. control.
Discussion
The excessive storage of lipids in cell types other than adipocytes creates cellular stress leading to cellular dysfunction and sometimes apoptotic cell death (e.g. lipotoxicity), processes that underpin the pathogenesis of disease states such as non-alcoholic steatosis, atherosclerosis and type 2 diabetes. ESI/MS-facilitated lipidomics has provided the opportunity to quantify the lipidome of tissues and thereby enhance the understanding of human disease. Here, we have utilised this technology to demonstrate that increasing dietary fat in mice increases the content of several lipid species in the hypothalamus and that regular exercise training is unable to ameliorate these effects.
Physiological variations of plasma FA concentrations can be detected and integrated by FA sensing hypothalamic neurons to regulate feeding behaviour and substrate metabolism (Lam et al. 2005). In this way, it is proposed that FA fluxes signal the metabolic state of the organism. Short term intracerebroventricular (i.c.v.) infusion of palmitate induces inflammatory stress (Posey et al. 2009), endoplasmic reticulum stress, insulin and leptin resistance (Benoit et al. 2009; Kleinridders et al. 2009; Posey et al. 2009) and apoptosis (Moraes et al. 2009). However, it is uncertain whether the accumulation of intra-hypothalamic lipid(s) mediates these responses because CNS ablation of the toll-like receptor adaptor protein, MyD88 prevents many of these effects (Kleinridders et al. 2009). Moreover, the effects of palmitate are unique for this the type of fatty acid (Coll et al. 2008), and from a physiological perspective, should be interpreted with caution when a mixture of saturated and unsaturated fatty acids naturally perfuse the brain (Watt et al. 2012). Hence, we asked whether prolonged increases in dietary fat would alter hypothalamic lipid composition. Our experiments demonstrate that high fat feeding increases the total contents of several neutral lipid species such as the phospholipid PC(O) and TAG, whilst also increasing signalling lipids, such as the sphingolipids dhCer and DHC, and the glycerolipid DAG.
The accumulation of ceramides and DAGs had been implicated in the development of insulin resistance in peripheral tissues such as the liver and skeletal muscle (Holland et al. 2007). We examined the molecular species of these lipids in the hypothalamus of high-fat fed mice. The majority of ceramide species were increased in the hypothalamus with high-fat feeding (Fig. 4A). High-fat feeding causes central insulin resistance as evidenced by decreased insulin signal transduction and an inability of insulin to suppress food intake when delivered directly into the brain (Ono et al. 2008; Posey et al. 2009). The molecular underpinnings of hypothalamic insulin resistance are unclear, although several mechanisms have been proposed including activation of the IKKβ/NF-κB pathway (Posey et al. 2009), PKCθ (Benoit et al. 2009), JNK (Belgardt et al. 2010), p70 S6 kinase 1 (S6K; the major downstream effector of the mammalian target of rapamycin (mTOR; Ono et al. 2008), and endoplasmic reticulum stress (Ropelle et al. 2010) all of which can directly interfere with components of the insulin signalling cascade. Here, we show that ceramide accumulates in the hypothalamus of high-fat fed mice, and together with previous observations (Gao et al. 2011; Holland et al. 2011) supports a putative role for ceramide in the development of central insulin resistance. DAG is an intermediate of both TAG and phospholipid metabolism, accumulates in the muscle and liver with diet-induced obesity and is postulated to be a key lipid intermediate linking nutrient excess to insulin resistance (Montell et al. 2001; Itani et al. 2002). DAG was elevated in the hypothalamus of high-fat fed mice and increases were detected in eight of the 10 species analysed, many of which contain saturated fatty acids (Fig. 5B). Itani et al. (2002) showed that lipid induced insulin resistance was caused by increase DAG accumulation and membrane-associated PKC-βIII and -δ and a decrease in IκBα. DAG is a potent allosteric activator of both conventional and novel PKC isoforms (Bronfman et al. 1988), suggesting a possible role in the aetiology of CNS insulin resistance.
Having confirmed lipid accumulation in the hypothalamus with high-fat feeding, we examined the hypothalamic lipid profile of the ob/ob mouse, a monogenic obesity model characterised by leptin deficiency, severe peripheral insulin resistance and ectopic lipid accumulation. We anticipated that the ectopic lipid accumulation would extend to the hypothalamus of the ob/ob mice. Unexpectedly, lipids were not increased in the hypothalamus of ob/ob mice, with the exception of a marked increase in THC. The discrepancies between these models of obesity (high-fat feeding and the ob/ob mouse) might reflect the differences in dietary composition, with ob/ob mice consuming a low-fat diet. While the absence of leptin may account for the differences in hypothalamic lipid storage between obesity models, it appears that obesity per se may not drive hypothalamic lipid accumulation; rather diets enriched in fatty acids may mediate this process.
Exercise training has been used as a mode to reduced lipid accumulation in the liver and skeletal muscle of humans (Bruce et al. 2006; Goodpaster et al. 2010) and rodents (Mitchell et al. 2004; Petridou et al. 2005). We investigated its use as a means of reducing lipid content in the hypothalamus of high-fat fed mice. Surprisingly, exercise training did not reduce the total lipid content of the hypothalamus in mice fed a high-fat diet (Fig. S2). Unlike studies showing exercise-mediated plasticity of the phospholipid pool in rodent and human muscle (Andersson et al. 1998; Mitchell et al. 2004), and liver (Petridou et al. 2005) and reductions in ceramide, DAG and TAG (Bruce et al. 2006; Goodpaster et al. 2010), the hypothalamic lipidome was essentially unaltered with exercise training (Fig. S2). Exercise training is associated with increased oxidation of fatty acids in peripheral tissues that are postulated to limit lipid accumulation (Bruce et al. 2006). It is unknown whether the rate of hypothalamic fatty acid oxidation is altered with exercise training. In this regard, 1 week of endurance exercise training does not alter the expression of several proteins associated with fatty acid metabolism including carnitine palmitoyltransferase 1B, carnitine palmitoyltransferase 1C, medium-chain acyl-CoA dehydrogenase, nuclear respiratory factor 1, peroxisome proliferative-activated receptor-γ coactivator-1α, uncoupling protein 2 (all involved with fatty acid oxidation), fatty acid translocase, glycerol-3-phosphate acyltransferase, and diacylglycerol acyltransferase 1 (fatty acid uptake/storage) (data not shown). Indeed, oxidation rates may never be high enough to limit lipid accumulation in the setting of lipid oversupply.
Sustained excessive energy intake adversely influences cognitive function, and a sedentary lifestyle exacerbates these adverse effects of overeating (Mattson et al. 2010). Several neurological disorders are characterised by defective lipid metabolism, and increase in prevalence with obesity. For example, long chain ceramides (C18−24) are increased in the brain in Alzheimer's disease, HIV, arteriosclerosis, stroke and ageing (Han et al. 2002; Cutler et al. 2004; Haughey et al. 2004; Han, 2005; Sawai et al. 2005) and ceramide accumulation is detrimental to neuronal cell function via the induction of apoptosis (Hannun & Obeid, 2002). From a metabolic viewpoint, hypothalamic ceramide accumulation is linked to insulin resistance (Holland et al. 2011). The evidence presented in our studies supports a role for altered lipid metabolism in the development of hypothalamic insulin resistance, but does not support a generalised role of ‘obesity’per se.
There were several considerations/assumptions made in the analysis and interpretation of the lipidomics data: (1) the lipids represent the sum of all hypothalamic cell types that include various hypothalamic nuclei, astrocytes, oligodendrocytes, ependymal cells and radial glia, but it has been suggested that the gross lipid composition of neurons and astrocytes are quite similar (Norton et al. 1975); (2) the lipidomics analysis provides a ‘snapshot’ of cellular lipid levels and does not assess fluxes; (3) the number of internal standards are limited and assume that the one standard for each class of lipids is representative of all species in that class; and (4) there may be some degradation of lipids during the hypothalamic extraction. However, this is unlikely because brains were sectioned on ice and snap-frozen within 1 min of decapitation. Despite these limitations, the relative changes between groups are accurate as all samples were treated the same. It should also be noted that the biological implications of the changes in the lipid compositions are likely to be complex and difficult to predict on the basis of lipidomics data alone. Indeed, the biological effects of lipids depend on their location (membrane vs. cytosolic vs. nuclear) and amount (Schievella et al. 1995; Simopoulos, 2006) and these detailed questions will be examined in future studies.
In conclusion, we have demonstrated that high-fat feeding results in lipid accumulation in the hypothalamus of mice and that hypothalamic lipids remain elevated despite regular endurance exercise training. Furthermore, the hypothalamic lipids remain unchanged in genetically obese mice fed a chow diet. Together, these data suggest that dietary lipids regulate hypothalamic lipid accumulation and this is not readily reversed by an exercise intervention.
Acknowledgments
These studies were supported in part by research grants and a fellowship from the National Health and Medical Research Council (NHMRC) of Australia (M.J.W., P.J.M.), the Diabetes Australia Research Trust and a Monash Fellowship (M.J.W.). M.L.B. was supported by an Australian Postgraduate Award.
Glossary
- ALT
alanine transaminase
- AST
aspartate transferase
- BMP
bis(monoacylglycero)phosphate
- CE
cholesterol esters
- Cer
ceramide
- CNS
central nervous system
- COH
free cholesterol
- CSF
cerebrospinal fluid
- DAG
diacylglycerol
- DHC
dihexosylceramide
- dhCer
dihydroceramide
- FA
free fatty acid
- GM3
GM3 ganglioside
- GTT
glucose tolerance test
- HFD
high-fat diet
- HFD-ex
high-fat diet exercise
- IκBα
nuclear factor of κ light polypeptide gene enhancer in B-cells inhibitor α
- JNK
c-Jun N-terminal kinases
- LFD
low-fat diet
- LPC
lysophosphatidylcholine
- MHC
monohexosylceramide
- mTOR
mammalian target of rapamycin
- MUFA
mono-unsaturated fatty acid
- NF-κB
nuclear factor κ-light-chain-enhancer of activated B cells
- odd PC
odd chain phosphatidylcholine
- PC
phosphatidylcholine
- PC(O)
alkylphosphatidylcholine
- PC(P)
alkenylphosphatidylcholine
- PE
phosphatidylethanolamine
- PE(O)
alkylphosphatidylethanolamine
- PE(P)
alkenylphosphatidylethanolamine
- PG
phosphatidylglycerol
- PI
phosphatidylinositol
- PS
phosphatidylserine
- S6K
p70 S6 kinase 1
- SM
sphingomyelin
- SM(OH)
hydroxysphingomyelin
- TAG
triacylglycerol
- THC
trihexosylceramide
Author contributions
M.L.B. and M.J.W. conceived the conceptual framework of the study and designed the experiments. S.O. performed the exercise training. Tissue collection was performed by M.L.B. and M.J.W. Biochemical and lipidomic analysis was performed by M.L.B., S.O., J.W. and P.J.M. M.L.B. wrote the manuscript with M.J.W. and it was reviewed/edited by P.J.M. All authors approved the final version of the submitted manuscript. All experiments were performed at Monash University; the lipidomics analysis was performed at the Baker IDI.
Supplementary material
Figure S1
Figure S2
Figure S3
Figure S4
Table S1
Table S2
References
- Andersson A, Sjodin A, Olsson R, Vessby B. Effects of physical exercise on phospholipid fatty acid composition in skeletal muscle. Am J Physiol Endocrinol Metab. 1998;274:E432–438. doi: 10.1152/ajpendo.1998.274.3.E432. [DOI] [PubMed] [Google Scholar]
- Belgardt BF, Mauer J, Wunderlich FT, Ernst MB, Pal M, Spohn G, Bronneke HS, Brodesser S, Hampel B, Schauss AC, Bruning JC. Hypothalamic and pituitary c-Jun N-terminal kinase 1 signaling coordinately regulates glucose metabolism. Proc Natl Acad Sci U S A. 2010;107:6028–6033. doi: 10.1073/pnas.1001796107. [DOI] [PMC free article] [PubMed] [Google Scholar]
- Benoit SC, Kemp CJ, Elias CF, Abplanalp W, Herman JP, Migrenne S, Lefevre AL, Cruciani-Guglielmacci C, Magnan C, Yu F, Niswender K, Irani BG, Holland WL, Clegg DJ. Palmitic acid mediates hypothalamic insulin resistance by altering PKC-theta subcellular localization in rodents. J Clin Invest. 2009;119:2577–2589. doi: 10.1172/JCI36714. [DOI] [PMC free article] [PubMed] [Google Scholar]
- Bronfman M, Morales MN, Orellana A. Diacylglycerol activation of protein kinase C is modulated by long-chain acyl-CoA. Biochem Biophys Res Commun. 1988;152:987–992. doi: 10.1016/s0006-291x(88)80381-4. [DOI] [PubMed] [Google Scholar]
- Bruce CR, Thrush AB, Mertz VA, Bezaire V, Chabowski A, Heigenhauser GJ, Dyck DJ. Endurance training in obese humans improves glucose tolerance and mitochondrial fatty acid oxidation and alters muscle lipid content. Am J Physiol Endocrinol Metab. 2006;291:E99–E107. doi: 10.1152/ajpendo.00587.2005. [DOI] [PubMed] [Google Scholar]
- Coll T, Eyre E, Rodriguez-Calvo R, Palomer X, Sanchez RM, Merlos M, Laguna JC, Vazquez-Carrera M. Oleate reverses palmitate-induced insulin resistance and inflammation in skeletal muscle cells. J Biol Chem. 2008;283:11107–11116. doi: 10.1074/jbc.M708700200. [DOI] [PubMed] [Google Scholar]
- Cutler RG, Kelly J, Storie K, Pedersen WA, Tammara A, Hatanpaa K, Troncoso JC, Mattson MP. Involvement of oxidative stress-induced abnormalities in ceramide and cholesterol metabolism in brain aging and Alzheimer's disease. Proc Natl Acad Sci U S A. 2004;101:2070–2075. doi: 10.1073/pnas.0305799101. [DOI] [PMC free article] [PubMed] [Google Scholar]
- Drummond GB. Reporting ethical matters in The Journal of Physiology: standards and advice. J Physiol. 2009;587:713–719. doi: 10.1113/jphysiol.2008.167387. [DOI] [PMC free article] [PubMed] [Google Scholar]
- Folch J, Lees M, Sloane Stanley GH. A simple method for the isolation and purification of total lipides from animal tissues. J Biol Chem. 1957;226:497–509. [PubMed] [Google Scholar]
- Freed LM, Wakabayashi S, Bell JM, Rapoport SI. Effect of inhibition of beta-oxidation on incorporation of [U-14C]palmitate and [1-14C]arachidonate into brain lipids. Brain Res. 1994;645:41–48. doi: 10.1016/0006-8993(94)91636-5. [DOI] [PubMed] [Google Scholar]
- Gao S, Zhu G, Gao X, Wu D, Carrasco P, Casals N, Hegardt FG, Moran TH, Lopaschuk GD. Important roles of brain-specific carnitine palmitoyltransferase and ceramide metabolism in leptin hypothalamic control of feeding. Proc Natl Acad Sci U S A. 2011;108:9691–9696. doi: 10.1073/pnas.1103267108. [DOI] [PMC free article] [PubMed] [Google Scholar]
- Goodpaster BH, Delany JP, Otto AD, Kuller L, Vockley J, South-Paul JE, Thomas SB, Brown J, McTigue K, Hames KC, Lang W, Jakicic JM. Effects of diet and physical activity interventions on weight loss and cardiometabolic risk factors in severely obese adults: a randomized trial. JAMA. 2010;304:1795–1802. doi: 10.1001/jama.2010.1505. [DOI] [PMC free article] [PubMed] [Google Scholar]
- Han X. Lipid alterations in the earliest clinically recognizable stage of Alzheimer's disease: implication of the role of lipids in the pathogenesis of Alzheimer's disease. Curr Alzheimer Res. 2005;2:65–77. doi: 10.2174/1567205052772786. [DOI] [PubMed] [Google Scholar]
- Han X, D MH, McKeel DW, Jr, Kelley J, Morris JC. Substantial sulfatide deficiency and ceramide elevation in very early Alzheimer's disease: potential role in disease pathogenesis. J Neurochem. 2002;82:809–818. doi: 10.1046/j.1471-4159.2002.00997.x. [DOI] [PubMed] [Google Scholar]
- Hannun YA, Obeid LM. The Ceramide-centric universe of lipid-mediated cell regulation: stress encounters of the lipid kind. J Biol Chem. 2002;277:25847–25850. doi: 10.1074/jbc.R200008200. [DOI] [PubMed] [Google Scholar]
- Haughey NJ, Cutler RG, Tamara A, McArthur JC, Vargas DL, Pardo CA, Turchan J, Nath A, Mattson MP. Perturbation of sphingolipid metabolism and ceramide production in HIV-dementia. Ann Neurol. 2004;55:257–267. doi: 10.1002/ana.10828. [DOI] [PubMed] [Google Scholar]
- He J, Goodpaster BH, Kelley DE. Effects of weight loss and physical activity on muscle lipid content and droplet size. Obes Res. 2004;12:761–769. doi: 10.1038/oby.2004.92. [DOI] [PubMed] [Google Scholar]
- Holland WL, Bikman BT, Wang LP, Yuguang G, Sargent KM, Bulchand S, Knotts TA, Shui G, Clegg DJ, Wenk MR, Pagliassotti MJ, Scherer PE, Summers SA. Lipid-induced insulin resistance mediated by the proinflammatory receptor TLR4 requires saturated fatty acid-induced ceramide biosynthesis in mice. J Clin Invest. 2011;121:1858–1870. doi: 10.1172/JCI43378. [DOI] [PMC free article] [PubMed] [Google Scholar]
- Holland WL, Brozinick JT, Wang LP, Hawkins ED, Sargent KM, Liu Y, Narra K, Hoehn KL, Knotts TA, Siesky A, Nelson DH, Karathanasis SK, Fontenot GK, Birnbaum MJ, Summers SA. Inhibition of ceramide synthesis ameliorates glucocorticoid-, saturated-fat-, and obesity-induced insulin resistance. Cell Metab. 2007;5:167–179. doi: 10.1016/j.cmet.2007.01.002. [DOI] [PubMed] [Google Scholar]
- Hu G, Lindstrom J, Valle TT, Eriksson JG, Jousilahti P, Silventoinen K, Qiao Q, Tuomilehto J. Physical activity, body mass index, and risk of type 2 diabetes in patients with normal or impaired glucose regulation. Arch Intern Med. 2004;164:892–896. doi: 10.1001/archinte.164.8.892. [DOI] [PubMed] [Google Scholar]
- Itani SI, Ruderman NB, Schmieder F, Boden G. Lipid-induced insulin resistance in human muscle is associated with changes in diacylglycerol, protein kinase C, and IκB-α. Diabetes. 2002;51:2005–2011. doi: 10.2337/diabetes.51.7.2005. [DOI] [PubMed] [Google Scholar]
- Karmi A, Iozzo P, Viljanen A, Hirvonen J, Fielding BA, Virtanen K, Oikonen V, Kemppainen J, Viljanen T, Guiducci L, Haaparanta-Solin M, Nagren K, Solin O, Nuutila P. Increased brain fatty acid uptake in metabolic syndrome. Diabetes. 2010;59:2171–2177. doi: 10.2337/db09-0138. [DOI] [PMC free article] [PubMed] [Google Scholar]
- Khan RS, Drosatos K, Goldberg IJ. Creating and curing fatty hearts. Curr Opin Clin Nutr Metab Care. 2010;13:145–149. doi: 10.1097/MCO.0b013e3283357272. [DOI] [PMC free article] [PubMed] [Google Scholar]
- Kleinridders A, Schenten D, Konner AC, Belgardt BF, Mauer J, Okamura T, Wunderlich FT, Medzhitov R, Bruning JC. MyD88 signaling in the CNS is required for development of fatty acid-induced leptin resistance and diet-induced obesity. Cell Metab. 2009;10:249–259. doi: 10.1016/j.cmet.2009.08.013. [DOI] [PMC free article] [PubMed] [Google Scholar]
- Lam TK, Pocai A, Gutierrez-Juarez R, Obici S, Bryan J, Aguilar-Bryan L, Schwartz GJ, Rossetti L. Hypothalamic sensing of circulating fatty acids is required for glucose homeostasis. Nat Med. 2005;11:320–327. doi: 10.1038/nm1201. [DOI] [PubMed] [Google Scholar]
- Lee JS, Pinnamaneni SK, Eo SJ, Cho IH, Pyo JH, Kim CK, Sinclair AJ, Febbraio MA, Watt MJ. Saturated, but not n-6 polyunsaturated, fatty acids induce insulin resistance: role of intramuscular accumulation of lipid metabolites. J Appl Physiol. 2006;100:1467–1474. doi: 10.1152/japplphysiol.01438.2005. [DOI] [PubMed] [Google Scholar]
- Lee Y, Hirose H, Ohneda M, Johnson JH, McGarry JD, Unger RH. β-Cell lipotoxicity in the pathogenesis of non-insulin-dependent diabetes mellitus of obese rats: impairment in adipocyte-beta-cell relationships. Proc Natl Acad Sci U S A. 1994;91:10878–10882. doi: 10.1073/pnas.91.23.10878. [DOI] [PMC free article] [PubMed] [Google Scholar]
- Lennox WG. The cerebral circulation XIV. The respiration quotient of the brain and of the experiments in man. Arch Neuro Psychiatr. 1931;26:719–724. [Google Scholar]
- Mattson MP, Kapogiannis D, Greig NH. Tweaking energy metabolism to prevent and treat neurological disorders. Clin Pharmacol Ther. 2010;88:437–439. doi: 10.1038/clpt.2010.135. [DOI] [PMC free article] [PubMed] [Google Scholar]
- McMurchie EJ. Dietary lipids in the regulation of membrane fluidity and function. In: Aloid RC, Curtain CC, Gordon LM, editors. Physiological Regulation of Membrane Fluidity. New York: Publisher: Alan R. Liss; 1988. pp. 189–237. [Google Scholar]
- Meikle PJ, Wong G, Tsorotes D, Barlow CK, Weir JM, Christopher MJ, MacIntosh GL, Goudey B, Stern L, Kowalczyk A, Haviv I, White AJ, Dart AM, Duffy SJ, Jennings GL, Kingwell BA. Plasma lipidomic analysis of stable and unstable coronary artery disease. Arterioscler Thromb Vasc Biol. 2011;31:2723–2732. doi: 10.1161/ATVBAHA.111.234096. [DOI] [PubMed] [Google Scholar]
- Miller JC, Gnaedinger JM, Rapoport SI. Utilization of plasma fatty acid in rat brain: distribution of [14C]palmitate between oxidative and synthetic pathways. J Neurochem. 1987;49:1507–1514. doi: 10.1111/j.1471-4159.1987.tb01021.x. [DOI] [PubMed] [Google Scholar]
- Mitchell TW, Turner N, Hulbert AJ, Else PL, Hawley JA, Lee JS, Bruce CR, Blanksby SJ. Exercise alters the profile of phospholipid molecular species in rat skeletal muscle. J Appl Physiol. 2004;97:1823–1829. doi: 10.1152/japplphysiol.00344.2004. [DOI] [PubMed] [Google Scholar]
- Montell E, Turini M, Marotta M, Roberts M, Noe V, Ciudad CJ, Mace K, Gomez-Foix AM. DAG accumulation from saturated fatty acids desensitizes insulin stimulation of glucose uptake in muscle cells. Am J Physiol Endocrinol Metab. 2001;280:E229–237. doi: 10.1152/ajpendo.2001.280.2.E229. [DOI] [PubMed] [Google Scholar]
- Moraes JC, Coope A, Morari J, Cintra DE, Roman EA, Pauli JR, Romanatto T, Carvalheira JB, Oliveira AL, Saad MJ, Velloso LA. High-fat diet induces apoptosis of hypothalamic neurons. PLoS One. 2009;4:e5045. doi: 10.1371/journal.pone.0005045. [DOI] [PMC free article] [PubMed] [Google Scholar]
- Norton WT, Abe T, Poduslo SE, DeVries GH. The lipid composition of isolated brain cells and axons. J Neurosci Res. 1975;1:57–75. doi: 10.1002/jnr.490010106. [DOI] [PubMed] [Google Scholar]
- Ono H, Pocai A, Wang Y, Sakoda H, Asano T, Backer JM, Schwartz GJ, Rossetti L. Activation of hypothalamic S6 kinase mediates diet-induced hepatic insulin resistance in rats. J Clin Invest. 2008;118:2959–2968. doi: 10.1172/JCI34277. [DOI] [PMC free article] [PubMed] [Google Scholar]
- Peruzzo B, Pastor FE, Blazquez JL, Schobitz K, Pelaez B, Amat P, Rodriguez EM. A second look at the barriers of the medial basal hypothalamus. Exp Brain Res. 2000;132:10–26. doi: 10.1007/s002219900289. [DOI] [PubMed] [Google Scholar]
- Petridou A, Nikolaidis MG, Matsakas A, Schulz T, Michna H, Mougios V. Effect of exercise training on the fatty acid composition of lipid classes in rat liver, skeletal muscle, and adipose tissue. Eur J Appl Physiol. 2005;94:84–92. doi: 10.1007/s00421-004-1294-z. [DOI] [PubMed] [Google Scholar]
- Posey KA, Clegg DJ, Printz RL, Byun J, Morton GJ, Vivekanandan-Giri A, Pennathur S, Baskin DG, Heinecke JW, Woods SC, Schwartz MW, Niswender KD. Hypothalamic proinflammatory lipid accumulation, inflammation, and insulin resistance in rats fed a high-fat diet. Am J Physiol Endocrinol Metab. 2009;296:E1003–1012. doi: 10.1152/ajpendo.90377.2008. [DOI] [PMC free article] [PubMed] [Google Scholar]
- Rapoport SI. In vivo labeling of brain phospholipids by long-chain fatty acids: relation to turnover and function. Lipids. 1996;31(Suppl):S97–101. doi: 10.1007/BF02637059. [DOI] [PubMed] [Google Scholar]
- Ropelle ER, Flores MB, Cintra DE, Rocha GZ, Pauli JR, Morari J, de Souza CT, Moraes JC, Prada PO, Guadagnini D, Marin RM, Oliveira AG, Augusto TM, Carvalho HF, Velloso LA, Saad MJ, Carvalheira JB. IL-6 and IL-10 anti-inflammatory activity links exercise to hypothalamic insulin and leptin sensitivity through IKKβ and ER stress inhibition. PLoS Biol. 2010;8:pii: e1000465. doi: 10.1371/journal.pbio.1000465. [DOI] [PMC free article] [PubMed] [Google Scholar] [Retracted]
- Ross R, Dagnone D, Jones PJ, Smith H, Paddags A, Hudson R, Janssen I. Reduction in obesity and related comorbid conditions after diet-induced weight loss or exercise-induced weight loss in men. A randomized, controlled trial. Ann Intern Med. 2000;133:92–103. doi: 10.7326/0003-4819-133-2-200007180-00008. [DOI] [PubMed] [Google Scholar]
- Sawai H, Domae N, Okazaki T. Current status and perspectives in ceramide-targeting molecular medicine. Curr Pharm Des. 2005;11:2479–2487. doi: 10.2174/1381612054367463. [DOI] [PubMed] [Google Scholar]
- Schievella AR, Regier MK, Smith WL, Lin LL. Calcium-mediated translocation of cytosolic phospholipase A2 to the nuclear envelope and endoplasmic reticulum. J Biol Chem. 1995;270:30749–30754. doi: 10.1074/jbc.270.51.30749. [DOI] [PubMed] [Google Scholar]
- Shimabukuro M, Higa M, Zhou YT, Wang MY, Newgard CB, Unger RH. Lipoapoptosis in beta-cells of obese prediabetic fafa rats. Role of serine palmitoyltransferase overexpression. J Biol Chem. 1998;273:32487–32490. doi: 10.1074/jbc.273.49.32487. [DOI] [PubMed] [Google Scholar]
- Simopoulos AP. Evolutionary aspects of diet, the omega-6/omega-3 ratio and genetic variation: nutritional implications for chronic diseases. Biomed Pharmacother. 2006;60:502–507. doi: 10.1016/j.biopha.2006.07.080. [DOI] [PubMed] [Google Scholar]
- Turpin SM, Ryall JG, Southgate R, Darby I, Hevener AL, Febbraio MA, Kemp BE, Lynch GS, Watt MJ. Examination of ‘lipotoxicity’ in skeletal muscle of high-fat fed and obob mice. J Physiol. 2009;587:1593–1605. doi: 10.1113/jphysiol.2008.166033. [DOI] [PMC free article] [PubMed] [Google Scholar]
- Unger RH. Minireview: weapons of lean body mass destruction: the role of ectopic lipids in the metabolic syndrome. Endocrinology. 2003;144:5159–5165. doi: 10.1210/en.2003-0870. [DOI] [PubMed] [Google Scholar]
- Watt MJ, Hoy AJ, Muoio DM, Coleman RA. Distinct roles of specific fatty acids in cellular processes: implications for interpreting and reporting experiments. Am J Physiol Endocrinol Metab. 2012;302:E1–E3. doi: 10.1152/ajpendo.00418.2011. [DOI] [PMC free article] [PubMed] [Google Scholar]
- Watt MJ, Steinberg GR. Regulation and function of triacylglycerol lipases in cellular metabolism. Biochem J. 2008;414:313–325. doi: 10.1042/BJ20080305. [DOI] [PubMed] [Google Scholar]
- Wellen KE, Hotamisligil GS. Inflammation, stress, and diabetes. J Clin Invest. 2005;115:1111–1119. doi: 10.1172/JCI25102. [DOI] [PMC free article] [PubMed] [Google Scholar]
Associated Data
This section collects any data citations, data availability statements, or supplementary materials included in this article.