Abstract
Aspergillus oryzae has been utilized for over 1000 years in Japan for the production of various traditional foods, and a large number of A. oryzae strains have been isolated and/or selected for the effective fermentation of food ingredients. Characteristics of genetic alterations among the strains used are of particular interest in studies of A. oryzae. Here, we have sequenced the whole genome of an industrial fungal isolate, A. oryzae RIB326, by using a next-generation sequencing system and compared the data with those of A. oryzae RIB40, a wild-type strain sequenced in 2005. The aim of this study was to evaluate the mutation pressure on the non-syntenic blocks (NSBs) of the genome, which were previously identified through comparative genomic analysis of A. oryzae, Aspergillus fumigatus, and Aspergillus nidulans. We found that genes within the NSBs of RIB326 accumulate mutations more frequently than those within the SBs, regardless of their distance from the telomeres or of their expression level. Our findings suggest that the high mutation frequency of NSBs might contribute to maintaining the diversity of the A. oryzae genome.
Keywords: Aspergillus oryzae, genetic alteration, niche adaptation, non-syntenic block
1. Introduction
Aspergillus oryzae has been utilized for over 1000 years in Japan for the production of various traditional foods, including soy sauce, sake (rice wine), soybean paste, and vinegar. Various A. oryzae strains have been isolated and/or selected for the effective degradation of target materials during the fermentation. In relation to a wide range of fermentation products produced by A. oryzae, genetic alteration between A. oryzae species is of particular interest.
As a wild-type strain of A. oryzae, the genome sequence of A. oryzae RIB40 [37 Mb; the National Research Institute of Brewing (NRIB), Japan; NITE Biological Resource Center (NBRC) stock no. 100959; American Type Culture Collection (ATCC) no. 42149] was completed1 and compared with those of Aspergillus nidulans (30 Mb)2 and Aspergillus fumigatus (29 Mb),3 revealing that the A. oryzae genome could be characterized into distinct syntenic blocks (SBs) and non-SBs (NSBs). Because the three species are phylogenetically closely related, SBs occupy ∼70–80% of the three genomes.2 NSBs are considered to be unique genetic elements of individual species, and the A. oryzae genome has the largest total size of NSBs (Fig. 1).
Figure 1.
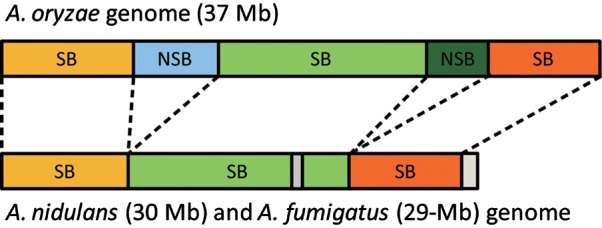
Organizations of SBs and NSBs in the A. oryzae, A. fumigatus, and A. nidulans genomes. SBs, which were identified from syntenic analysis between A. oryzae, A. fumigatus, and A. nidulans,1 are common between the genomes, whereas NSBs in A. oryzae consist of the extra genetic regions from other two smaller genome sequences.
Compared with NSBs found in the genomes of yeast and other filamentous fungi, NSBs of A. oryzae show the significant enrichment of genes involved in metabolism, including secondary metabolism, hydrolase, and transporter genes,1 and contain genes that are less conserved than those of SBs.4 In general, the transcriptional expression of NSB genes is markedly weaker than that of genes located in SBs; however, several NSB genes functioning as secretory hydrolases and transporters are highly induced in solid-state cultivation and reach absolute expression levels comparable with those of SB genes.5 Another characteristic feature of NSB genes is that they are often repressed by heat shock.5 Together, these findings indicate that SBs and NSBs represent distinct genetic segments in the A. oryzae genome in terms of biological function, diversity, and transcriptional regulation, and NSBs can contribute to a wide range of fermentation capability of A. oryzae strains.6 However, a difference of genetic alterations between SBs and NSBs remains unclear.
To reveal mutational characteristics of NSBs, we sequenced the genome of A. oryzae RIB326 and compared it with strain RIB40. RIB326 was isolated from an industrial A. oryzae strain isolated from shoyu koji (inocula for soy sauce fermentation) in a conida supplier (Osaka-Konno), independently from RIB40.7,8 We considered that a genomic comparison of the two strains would help understand the development of mutations during the domestication process, particularly relating to NSBs containing genes responsible for fermentation and secondary metabolism.4
2. Materials and Methods
2.1. Strain and medium
The fungal strain used in this study, A. oryzae RIB326, was obtained from the National Research Institute of Brewing, Japan (http://www.nrib.go.jp/ken/asp/strain.html). For DNA isolation, the fungus was grown in liquid yeast extract peptone dextrose medium (Difco) at 30°C for 2 days.
2.2. DNA preparation
Genomic DNA was isolated from RIB326 by first grinding mycelia to a fine powder in liquid nitrogen, and then mixing ∼40 g of the ground mycelia with 200 ml of 10 mM Tris buffer (pH 7.0) containing 50 mM ethylenediaminetetraacetic acid (EDTA), 200 mM NaCl, 1% Triton X-100, and 10 mg each of cellulase (Yakuruto), yatalase (Takara) and lysing enzyme (Sigma). The mixture was incubated for 1 h at 37°C, followed by the addition of RNase A (Funakoshi) to a final concentration of 20 mg/ml and further incubation for 1 h. After the addition of proteinase K (Takara) to a final concentration of 0.1 mg/ml, the solution was incubated for 2 h at 50°C, followed by centrifugation at 2300 × g for 10 min. The resulting supernatant was subjected to phenol, phenol/chloroform and chloroform extraction, and DNA was then precipitated using ethanol. After dissolving the precipitated DNA in Tris-EDTA buffer, genomic DNA was purified using a Genomic-tip column (Qiagen).
2.3. Sequencing and assembly of the A. oryzae RIB326 genome using a next-generation sequencing system
The whole genome sequencing of RIB326 using both fragment and mate-paired libraries was performed using the SOLiD system (ABI), a next-generation sequencing system, according to the manufacturer's instruction. Fragment sequencing yielded 70 268 590 sequence reads of 50 bp, whose depth on the reference sequence of RIB40 [∼37 Mb, DNA Data Bank of Japan (DDBJ): AP007150–AP007177; GenBank: AP007150–AP007177] was 67 and covered 94.6% of the reference nucleotide sequence after mapping. The mate-paired sequencing yielded 86 209 971 sequence reads of 50 bp, which were subjected to de novo assembly using Velvet (version 1.0.15)9 on a DELL Precision T7500 (CPU: Xeon E5620, memory: 96 GB, hard disk: 2 TB × 5, OS: Ubuntu Linux 10.04). The assembled scaffolds had a total length of 36 395 679 bp; N50 length of 643 359 bp; and mean length of 7286 bp. N50 is defined as the scaffold length such that using equal or longer scaffolds produces half the bases of all scaffolds. The longest scaffold had a length of 2 218 714 bp. The sequences of the longest 200 scaffolds are available in the DDBJ (BAEZ01000001–BAEZ01000200).
2.4. Nucleotide mutation analysis between strains RIB40 and RIB326
Conserved sequences and nucleotide alterations in strain RIB326 were analyzed using Corona-Lite software (Version 4.2) with the RIB40 genome sequence as a reference. Genome sequence rearrangements between strains RIB40 and RIB326 were analyzed using the longest 200 scaffolds of RIB326 determined from de novo assembly. The 200 scaffolds represent 35 425 415 bp (97.3%) of the total length of the entire RIB326 assembly. Homology searches of the 200 RIB326 scaffolds against 22 RIB40 scaffolds using the LAST algorithm10–12 generated 5521 pairs of nucleotide sequences having scores and identities of >500 and >98%, respectively. Deletions, insertions and inversions of longer than 500 bp in the RIB326 scaffolds were counted. For the display of the RIB40 genome, sequences of the 22 scaffolds were concatenated as one continuous sequence with an artificial N sequence of 10 kb between the neighbouring scaffolds. The final length of the RIB40 genome sequence was determined to be 37 268 201 bp.
2.5. Analysis of mutation frequency in coding sequences between RIB40 and RIB326
To identify coding sequences (CDSs) in RIB326, each amino acid sequence of RIB40 genes was subjected to tBlastn searches13,14 against the nucleotide sequence of the RIB326 genome. Each codon of RIB40 CDS was compared with the corresponding RIB326 codons, and codons were classified as either with or without mutation(s), or containing unidentified nucleotide(s). Codons with mutation(s) were further classified as those without (silent) or with (non-silent) amino acid substitutions.
2.6. Expressed sequence tags
Aspergillus oryzae expressed sequence tags (ESTs) generated under eight culture conditions15 were obtained from http://riodb.ibase.aist.go.jp/ffdb/EST-DB.html. The eight culture conditions were: (i) liquid nutrient-rich culture, (ii) liquid nutrient-rich culture at high temperature, (iii) liquid maltose-inductive culture, (iv) liquid carbon-starved culture, (v) liquid germinated conidia and conidia, (vi) alkaline pH culture on agar plates, (vii) solid-state wheat bran culture, and (viii) solid-state soybean culture (for details, see Akao et al.15). Gene numbers and averaged amino acid substitution ratios were evaluated for SBs and NSBs for each EST level. The Wilcoxon signed-rank test was used to evaluate the P-value for differences between the amino acid substitution ratios of SBs and NSBs for each EST level when more than four genes were at the EST level in both SBs and NSBs.
2.7. Eukaryotic orthologous group classification of CDSs
The functional categories of A. oryzae genes were assigned according to the eukaryotic orthologous group (KOG) classification16 by searching for homology against amino acid sequences in the KOG database with a bit score of ≥60. The genes categorized as belonging to more than one KOG category were counted for every relevant category. The 22 KOG categories were classified into three meta-categories: I, information storage and processing; II, cellular process and signalling; and III, metabolism. The three meta-categories include the following categories. Meta-category I: J, translation, ribosomal structure, and biogenesis; A, RNA processing and modification; K, transcription; L, replication, recombination, and repair; and B, chromatin structure and dynamics; meta-category II: D, Cell cycle control, cell division, and chromosome partitioning; V, defense mechanisms; T, signal transduction mechanisms; M, cell wall/membrane/envelope biogenesis; Z, cytoskeleton; U, intracellular trafficking, secretion, and vesicular transport; O, post-translational modification, protein turnover, and chaperones; Y, nuclear structure; and W, extracellular structures; meta-category III: C, energy production and conversion; G, carbohydrate transport and metabolism; E, amino acid transport and metabolism; F, nucleotide transport and metabolism; H, coenzyme transport and metabolism; I, lipid transport and metabolism; P, inorganic ion transport and metabolism; and Q, secondary metabolite biosynthesis, transport, and catabolism.
3. Results and Discussion
3.1. Are mutations localized in NSB or only in sub-telomeric region?
To grasp genetic alterations between the two A. oryzae strains, the localization of nucleotide alterations and amino acid substitutions between RIB326 and RIB40 were mapped on the RIB40 genome (Fig. 2). In regions proximal to centromeres, a decrease in the nucleotide substitution frequency was observed, indicating that these regions are subjected to strong selective pressure. In contrast, the nucleotide substitution ratio was higher in regions proximal to chromosomal termini (sub-telomeric regions). This result is in good agreement with the fact that the sub-telomeric regions of yeast and humans are unstable due to telomere loss and thus, accumulate mutations at a higher rate.17–19 In Caenorhabditis elegans, the single-nucleotide polymorphism density on the chromosomal terminus was ∼4.5-fold more abundant than that found on the central part of the chromosome.20 The location of mutations appears to be correlated with NSBs, which are generally localized proximal to chromosomal termini. Pairwise comparison of the genes between the two genomes showed that only 1.2% of RIB326 genes had more than 20% deletions/substitutions of amino acids from corresponding RIB40 genes. Therefore, almost all SBs and NSBs in RIB326 are located at the same positions of those in RIB40 and the higher mutation frequency in NSBs is consistent using either RIB326 or RIB40 genomes.
Figure 2.
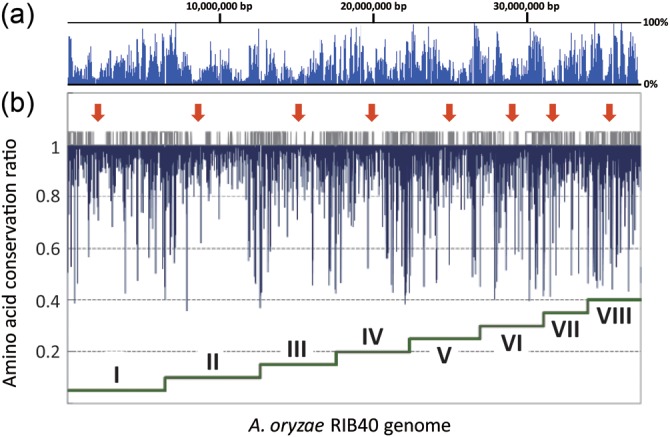
Distribution of mutations in the RIB326 genome. (a) The nucleotide substitution percentage and (b) amino acid conservation ratio in the A. oryzae RIB40 genome against RIB326 were plotted using a 10-kb window with a 5-kb overlap. Each chromosomal region (I–VIII) is indicated by dark green stepwise line located at the bottom of the graph, and the position of the centromere in each chromosome deduced from the terminal of scaffolds is indicated by red arrows. The short vertical gray lines located in at the middle of the figure represent the position of NSBs determined from syntenic analysis between A. oryzae, A. nidulans, and A. fumigatus.1
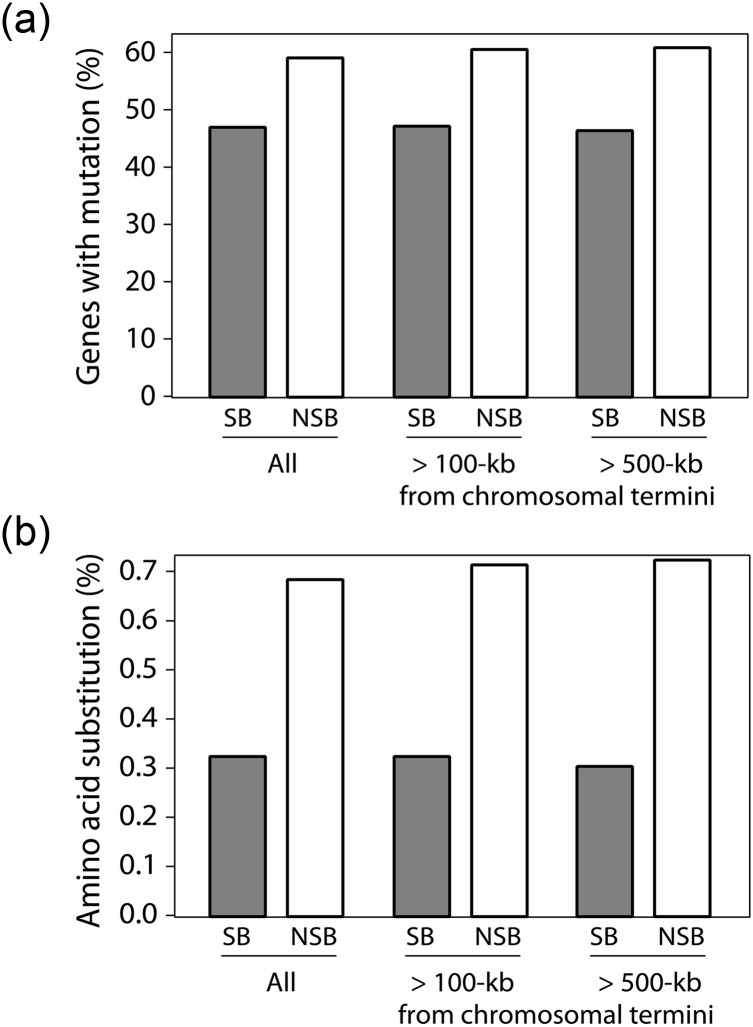
Figure 3 shows the frequency of gene alterations for CDS located within SBs and NSBs according to their location within the RIB326 genome. The analysis revealed that genes containing mutations were ∼10% more frequent within NSBs than those located in SBs and were more prevalent when excluding genes closest (100 or 500 kb) from chromosomal termini (Fig. 3a). Similarly, the amino acid substitution ratio of all NSB genes was higher than that observed in SB genes and further increased on the exclusion of genes located closest to termini (Fig. 3b). These results indicate that NSBs accumulate a greater number of mutations than SBs regardless of the chromosomal location.
Figure 3.
Mutation of SB and NSB genes in relation to the distance from chromosomal termini. The percentages of (a) genes with mutation and (b) averaged amino acid substitutions are shown for all SB and NSB genes located in the genome, and those located greater than 100- or 500-kb distant from the closest chromosomal termini.
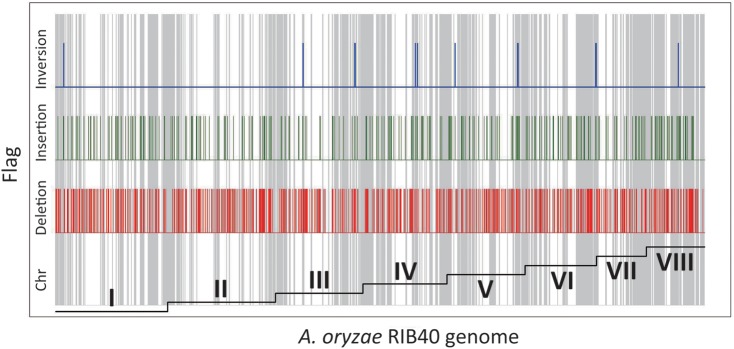
The distribution of deletions, insertions, and inversions within the RIB326 genome, as mapped on the RIB40 genome, was also determined, revealing that genetic rearrangements also accumulated in NSBs of strain RIB326 (Fig. 4). Table 1 summarizes the number and ratio of deletions, insertions, and inversions in the RIB40 genome sequence against that of RIB326, which were determined using the longest 200 scaffolds (>576 bp) obtained by sequencing of the mate-paired library of RIB326. Notably, 24.2 and 19.8% of the deletions and inversions, respectively, were found within NSBs on the RIB40 genome. Considering that the nucleotides defined as NSBs occupy only 12.4% of the entire genome sequence of RIB40, the results indicate that deletions and inversions are highly enriched in NSBs of A. oryzae.
Figure 4.
Distribution of deletions, insertions, and inversions in the RIB40 genome. The regions of deletion (red), insertion (green), and inversion (blue) were evaluated between the RIB40 reference scaffolds and RIB326 scaffolds obtained from de novo assembly. Each RIB40 chromosome is indicated in a step graph at the bottom of the chart. For insertions, the starting points were plotted.
Table 1.
Number and percentage of deletion, insertion, and inversion regions in the A. oryzae RIB40 genome
| Deletion | Insertion | Inversion | |
|---|---|---|---|
| Number | 645 | 107 | 9 |
| Ratio against the RIB40 genome sequence (%) | 3.3 | –a | ∼0 |
| NSB ratio in the region (%) | 24.2 | –a | 19.8 |
aNot determined, as the insertion length was not accurately evaluated.
3.2. Are NSB genes functionally active?
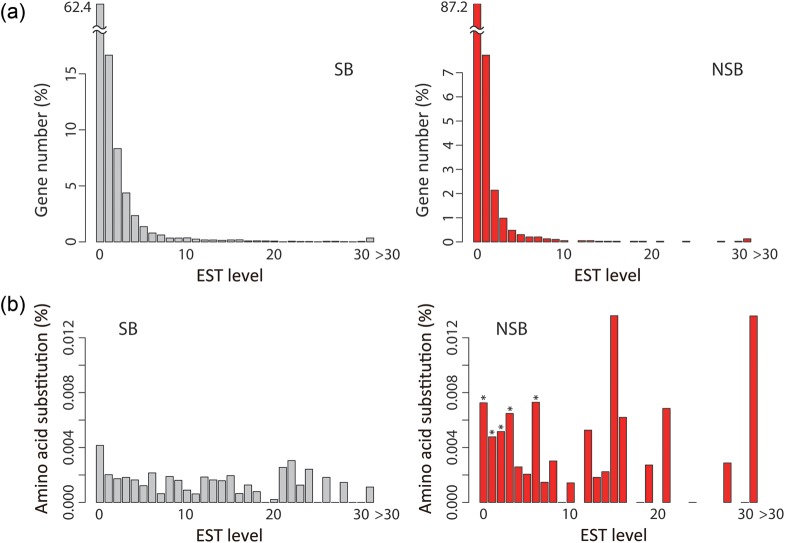
Figure 5 shows the number of genes and frequency of amino acid substitutions for genes located within SBs and NSBs against the redundancy of ESTs, which were previously obtained from eight different cultural conditions.15 Our analysis revealed that the percentage of genes within SBs and NSBs decreased as the EST level increased, with the number of NSB genes decreasing at a higher rate than that of SB genes (Fig. 5a). This result is in good agreement with the finding that NSB genes typically have markedly lower expression levels than those of SB genes.4 Nevertheless, a small percentage of NSB genes was detected at EST levels of >10, indicating that several genes within NSBs are functional. As shown in Figure 5b, the average amino acid substitution ratios were significantly (P< 0.05) higher for NSB genes than those of SB genes at any EST level, when greater than four genes were available for the analysis. This result demonstrates that the genes within NSBs accumulated more mutations than those within SBs, even those that exhibited high-expression levels.
Figure 5.
Gene number and averaged amino acid substitution ratios within SBs and NSBs of strain RIB326 against gene expression levels. (a) Gene numbers and (b) averaged amino acid substitution frequencies within SBs and NSBs are plotted against the level of EST. The P-values for the difference between the amino acid substitution ratios within SBs and NSBs were evaluated using the Wilcoxon signed-rank test for each EST level that included greater than four genes. Asterisks indicate a P-value of <0.05 in the graph of NSBs.
The amino acid substitution frequency within the RIB326 genome was calculated to evaluate the activity of NSB genes. The number of genes with silent or non-silent mutations, and the ratio of mutated genes within SBs and NSBs is summarized in Table 2. Based on the amino acid frequency within A. oryzae genes, the probability of a synonymous mutation would only be 5.4% when a random point mutation mechanism is assumed (see the frequency within A. oryzae genes and probability of silent mutations for each amino acid in the Supplementary data). However, the ratio of genes with silent mutations was much more abundant (55–58%) than that of genes with non-silent mutations in both SBs and NSBs. This finding demonstrates that the NSB genes of strain RIB326 are functionally active, even though they accumulated more mutations than the SB genes.
Table 2.
Number and ratio of silent and non-silent mutations in SBs and NSBs of A. oryzae RIB326
| Gene number |
Total number of mutations |
|||||
|---|---|---|---|---|---|---|
| All | With silent mutation(s) | With non-silent mutation(s) | Silent | Non-silent | Silent/non-silent | |
| SB | 9345 | 4753 | 4431 | 14 229 | 10 180 | 1.4 |
| NSB | 3784 | 2114 | 2253 | 8328 | 7228 | 1.2 |
Comparison of the sequences showed ∼5.4% of RIB40 nucleotides unidentified by the reads from RIB326, among which continuous unidentified nucleotides of >500 bp occupy 3.3%. As a control, we confirmed that SOLiD short reads from RIB40 covered 99.94% of the RIB40 reference nucleotides. Further, long deletions (>30 kb) in RIB326 compared with RIB40 reached ∼3.3%, which was identified by a preliminary comparative genomic hybridization experiment using a DNA microarray having single probes for each RIB40 gene (data not shown). The comparison of the sequences also showed 0.32% of the RIB40 nucleotides being substituted in the RIB326 genome. Notably, these frequencies were markedly reduced within CDS compared with the non-CDS regions. The ratio of deleted nucleotides was only 3.6% in exons, but reached 5.9 and 4.7% in the intergenic and intron regions, respectively. Similarly, the substitution ratio was 0.26% in exons, whereas intergenic and intron regions displayed ratios of 0.38 and 0.37%, respectively. These observations indicate the existence of selective pressure on CDS located within both NSBs and SBs.
3.3. What are the role of NSBs in regard to gene function?
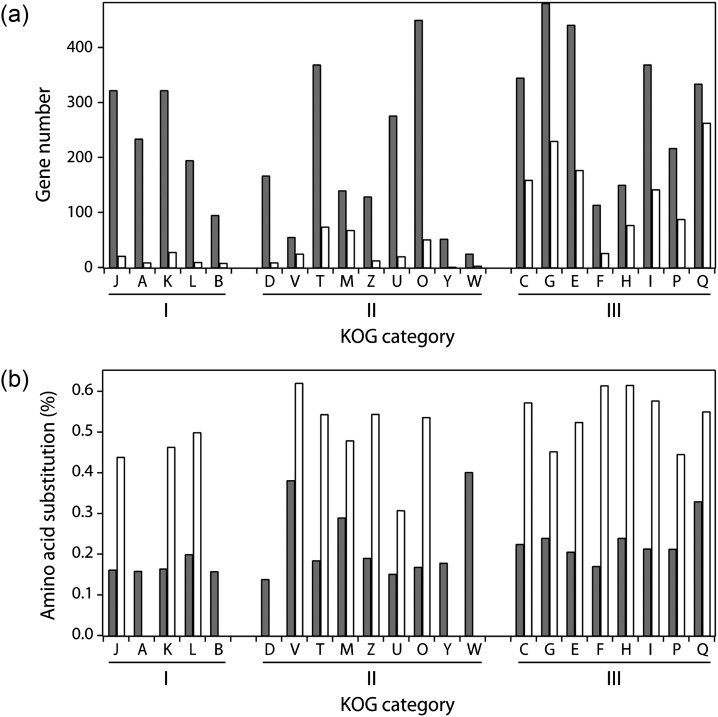
Figure 6 depicts the gene numbers and mean amino acid substitution frequencies of SB and NSB genes for the major functional categories of the KOG of proteins.16 The number of NSB genes belonging to meta-category I, which represents information storage and processing, was significantly smaller than that of SB genes (Fig. 6a). The number of NSB genes belonging to meta-category III, which includes secondary metabolism genes (Q), hydrolases, and transporters, was significantly greater than the other two meta-categories (Fig. 6a). This result is in accordance with our previous finding that NSBs are the regions where secretory hydrolases and secondary metabolic genes unique to A. oryzae.5 In addition, it was determined that the amino acid substitution frequency was higher within NSBs for all examined functional categories (Fig. 6b).
Figure 6.
Mutation of SB and NSB genes based on KOG functional categories. (a) Gene numbers and (b) averaged amino acid substitution frequencies within SBs and NSBs are plotted for each KOG. The gray and white bars indicate the values for SBs and NSBs, respectively. Each KOG category was classified into three meta-categories: I, information storage and processing (J to B); II, cellular process and signalling (D to W); and III, metabolism (C to Q), as described in the Materials and methods section. In (b), the values for categories that did not include ≤10 genes were not drawn to avoid misinterpretation of biological insignificance.
As secondary metabolic pathways are not directly involved in the growth, development, or reproduction of fungi, it is considered that mutations which alter or reduce the activity of these pathways do not markedly affect survival, whereas functional mutations in primary metabolic pathways are often lethal. Such mutations in secondary metabolic genes might increase survival rates through the production of new compounds that prevent the growth of other organisms. NSBs may serve as a diverse gene pool for promoting niche adaptation by accumulating genetic alterations.
It is presently unknown why NSBs are widely distributed over the chromosomes of A. oryzae. The distributed regions might be suitable for secondary metabolic regulation by global regulatory factors such as LaeA and CclA, which function as histone methyltransferases.21,22 Our genomic sequencing revealed that RIB326 possesses the biosynthetic genes for kojic acid (AO090113000136), containing two silent mutations, and those for penicillin (AO090038000544). However, although RIB40 is known to produce both kojic acid23 and penicillin24 RIB326 does not produce either compound. The inability of RIB326 to produce these two secondary metabolites is thought to be due to the lack of expression of the respective biosynthetic genes and/or lack of biosynthetic precursor(s). RIB326, which was selected from an industrial strain for fermentation, generally produces less extrolites than RIB40.7,8 Mutations in RIB326 may have accumulated during the selective breeding of this strain for the reduced production of secondary metabolites during fermentation.
Among extensive comparative studies between A. oryzae strains examining the productivity of hydrolases, amylases, proteases,25–27 and biosynthetic homologues of cyclopiazonic acid28,29 and aflatoxin,7,8,30,31, this represented the first genome-wide comparison between A. oryzae strains. It is possible that the higher mutation frequency of NSBs, which are enriched for secretory hydrolases and secondary metabolic genes, contributes to the introduction of unique characteristics into A. oryzae strains for niche adaptation. From an industrial point of view, the wide diversity of A. oryzae strains, which may have resulted from the high-mutation frequency of NSBs, might allow for effective breeding for specific fermentation applications by introducing unique metabolism for raw material degradation and/or flavour improvement.
Supplementary Data
Supplementary data are available at www.dnaresearch.oxfordjournals.org.
Funding
This work was supported in part by the Okinawa Cutting-Edge Genome Project.
Supplementary Material
Footnotes
Edited by Katsumi Isono
References
- 1.Machida M., Asai K., Sano M., et al. Genome sequencing and analysis of Aspergillus oryzae. Nature. 2005;438:1157–61. doi: 10.1038/nature04300. [DOI] [PubMed] [Google Scholar]
- 2.Galagan J.E., Calvo S.E., Cuomo C., et al. Sequencing of Aspergillus nidulans and comparative analysis with A. fumigatus and A. oryzae. Nature. 2005;438:1105–15. doi: 10.1038/nature04341. [DOI] [PubMed] [Google Scholar]
- 3.Nierman W.C., Pain A., Anderson M.J., et al. Genomic sequence of the pathogenic and allergenic filamentous fungus Aspergillus fumigatus. Nature. 2005;438:1151–6. doi: 10.1038/nature04332. [DOI] [PubMed] [Google Scholar]
- 4.Machida M., Terabayashi Y., Sano M., et al. Genomics of industrial aspergilli and comparison with toxigenic relatives. Food Addit. Contam. 2008;25:1147–51. doi: 10.1080/02652030802273114. [DOI] [PubMed] [Google Scholar]
- 5.Tamano K., Sano M., Yamane N., et al. Transcriptional regulation of genes on the non-syntenic blocks of Aspergillus oryzae and its functional relationship to solid-state cultivation. Fungal Genet. Biol. 2008;45:139–51. doi: 10.1016/j.fgb.2007.09.005. [DOI] [PubMed] [Google Scholar]
- 6.Machida M., Yamada O., Gomi K. Genomics of Aspergillus oryzae: learning from the history of Koji mold and exploration of its future. DNA Res. 2008;15:173–83. doi: 10.1093/dnares/dsn020. [DOI] [PMC free article] [PubMed] [Google Scholar]
- 7.Kiyota T., Hamada R., Sakamoto K., Iwashita K., Yamada O., Mikami S. Aflatoxin non-productivity of Aspergillus oryzae caused by loss of function in the aflJ gene product. J. Biosci. Bioeng. 2011;111:512–7. doi: 10.1016/j.jbiosc.2010.12.022. [DOI] [PubMed] [Google Scholar]
- 8.Tominaga M., Lee Y.H., Hayashi R., et al. Molecular analysis of an inactive aflatoxin biosynthesis gene cluster in Aspergillus oryzae RIB strains. Appl. Environ. Microbiol. 2006;72:484–90. doi: 10.1128/AEM.72.1.484-490.2006. [DOI] [PMC free article] [PubMed] [Google Scholar]
- 9.Zerbino D.R., Birney E. Velvet: algorithms for de novo short read assembly using de Bruijn graphs. Genome Res. 2008;18:821–9. doi: 10.1101/gr.074492.107. [DOI] [PMC free article] [PubMed] [Google Scholar]
- 10.Kielbasa S.M., Wan R., Sato K., Horton P., Frith M.C. Adaptive seeds tame genomic sequence comparison. Genome Res. 2011;21:487–93. doi: 10.1101/gr.113985.110. [DOI] [PMC free article] [PubMed] [Google Scholar]
- 11.Frith M.C., Wan R., Horton P. Incorporating sequence quality data into alignment improves DNA read mapping. Nucleic Acids Res. 2010;38:e100. doi: 10.1093/nar/gkq010. [DOI] [PMC free article] [PubMed] [Google Scholar]
- 12.Frith M.C., Hamada M., Horton P. Parameters for accurate genome alignment. BMC Bioinformatics. 2010;11:80. doi: 10.1186/1471-2105-11-80. [DOI] [PMC free article] [PubMed] [Google Scholar]
- 13.Altschul S.F., Gish W., Miller W., Myers E.W., Lipman D.J. Basic local alignment search tool. J. Mol. Biol. 1990;215:403–10. doi: 10.1016/S0022-2836(05)80360-2. [DOI] [PubMed] [Google Scholar]
- 14.States D.J., Gish W. Combined use of sequence similarity and codon bias for coding region identification. J. Comput. Biol. 1994;1:39–50. doi: 10.1089/cmb.1994.1.39. [DOI] [PubMed] [Google Scholar]
- 15.Akao T., Sano M., Yamada O., et al. Analysis of expressed sequence tags from the fungus Aspergillus oryzae cultured under different conditions. DNA Res. 2007;14:47–57. doi: 10.1093/dnares/dsm008. [DOI] [PMC free article] [PubMed] [Google Scholar]
- 16.Tatusov R.L., Fedorova N.D., Jackson J.D., et al. The COG database: an updated version includes eukaryotes. BMC Bioinformatics. 2003;4:41. doi: 10.1186/1471-2105-4-41. [DOI] [PMC free article] [PubMed] [Google Scholar]
- 17.Murnane J.P. Telomeres and chromosome instability. DNA Repair (Amst.) 2006;5:1082–92. doi: 10.1016/j.dnarep.2006.05.030. [DOI] [PubMed] [Google Scholar]
- 18.Borneman A.R., Forgan A.H., Pretorius I.S., Chambers P.J. Comparative genome analysis of a Saccharomyces cerevisiae wine strain. FEMS Yeast Res. 2008;8:1185–95. doi: 10.1111/j.1567-1364.2008.00434.x. [DOI] [PubMed] [Google Scholar]
- 19.Carreto L., Eiriz M.F., Gomes A.C., Pereira P.M., Schuller D., Santos M.A. Comparative genomics of wild type yeast strains unveils important genome diversity. BMC Genomics. 2008;9:524. doi: 10.1186/1471-2164-9-524. [DOI] [PMC free article] [PubMed] [Google Scholar]
- 20.Koch R., van Luenen H.G., van der Horst M., Thijssen K.L., Plasterk R.H. Single nucleotide polymorphisms in wild isolates of Caenorhabditis elegans. Genome Res. 2000;10:1690–6. doi: 10.1101/gr.gr-1471r. [DOI] [PMC free article] [PubMed] [Google Scholar]
- 21.Bok J.W., Keller N.P. LaeA, a regulator of secondary metabolism in Aspergillus spp. Eukaryot. Cell. 2004;3:527–35. doi: 10.1128/EC.3.2.527-535.2004. [DOI] [PMC free article] [PubMed] [Google Scholar]
- 22.Bok J.W., Chiang Y.M., Szewczyk E., et al. Chromatin-level regulation of biosynthetic gene clusters. Nat. Chem. Biol. 2009;5:462–4. doi: 10.1038/nchembio.177. [DOI] [PMC free article] [PubMed] [Google Scholar]
- 23.Terabayashi Y., Sano M., Yamane N., et al. Identification and characterization of genes responsible for biosynthesis of kojic acid, an industrially important compound from Aspergillus oryzae, fungal. Genet. Biol. 2010;47:953–61. doi: 10.1016/j.fgb.2010.08.014. [DOI] [PubMed] [Google Scholar]
- 24.Marui J., Yamane N., Ohashi-Kunihiro S., et al. Kojic acid biosynthesis in Aspergillus oryzae is regulated by a Zn(II)(2)Cys(6) transcriptional activator and induced by kojic acid at the transcriptional level. J. Biosci. Bioeng. 2011;112:40–3. doi: 10.1016/j.jbiosc.2011.03.010. [DOI] [PubMed] [Google Scholar]
- 25.Zhu L.Y., Nguyen C.H., Sato T., Takeuchi M. Analysis of secreted proteins during conidial germination of Aspergillus oryzae RIB40. Biosci. Biotechnol. Biochem. 2004;68:2607–12. doi: 10.1271/bbb.68.2607. [DOI] [PubMed] [Google Scholar]
- 26.te Biesebeke R., Record E., van Biezen N., et al. Branching mutants of Aspergillus oryzae with improved amylase and protease production on solid substrates. Appl. Microbiol. Biotechnol. 2005;69:44–50. doi: 10.1007/s00253-005-1968-4. [DOI] [PubMed] [Google Scholar]
- 27.Bocking S.P., Wiebe M.G., Robson G.D., Hansen K., Christiansen L.H., Trinci A.P. Effect of branch frequency in Aspergillus oryzae on protein secretion and culture viscosity. Biotechnol. Bioeng. 1999;65:638–48. doi: 10.1002/(sici)1097-0290(19991220)65:6<638::aid-bit4>3.0.co;2-k. [DOI] [PubMed] [Google Scholar]
- 28.Chang P.K., Ehrlich K.C., Fujii I. Cyclopiazonic acid biosynthesis of Aspergillus flavus and Aspergillus oryzae. Toxins (Basel) 2009;1:74–99. doi: 10.3390/toxins1020074. [DOI] [PMC free article] [PubMed] [Google Scholar]
- 29.Kato N., Tokuoka M., Shinohara Y., et al. Genetic safeguard against mycotoxin cyclopiazonic acid production in Aspergillus oryzae. Chembiochem. 2011;12:1376–82. doi: 10.1002/cbic.201000672. [DOI] [PubMed] [Google Scholar]
- 30.Kusumoto K., Nogata Y., Ohta H. Directed deletions in the aflatoxin biosynthesis gene homolog cluster of Aspergillus oryzae. Curr. Genet. 2000;37:104–11. doi: 10.1007/s002940050016. [DOI] [PubMed] [Google Scholar]
- 31.Watson A.J., Fuller L.J., Jeenes D.J., Archer D.B. Homologs of aflatoxin biosynthesis genes and sequence of aflR in Aspergillus oryzae and Aspergillus sojae. Appl. Environ. Microbiol. 1999;65:307–10. doi: 10.1128/aem.65.1.307-310.1999. [DOI] [PMC free article] [PubMed] [Google Scholar]
Associated Data
This section collects any data citations, data availability statements, or supplementary materials included in this article.


