Abstract
Objectives
To improve the integration of MRI with radiotherapy treatment planning, our department fabricated a flat couch top for our MR scanner. Setting up using this couch top meant that the patients were physically higher up in the scanner and, posteriorly, a gap was introduced between the patient and radiofrequency coil.
Methods
Phantom measurements were performed to assess the quantitative impact on image quality. A phantom was set up with and without the flat couch insert in place, and measurements of image uniformity and signal to noise were made. To assess clinical impact, six patients with pelvic cancer were recruited and scanned on both couch types. The image quality of pairs of scans was assessed by two consultant radiologists.
Results
The use of the flat couch insert led to a drop in image signal to noise of approximately 14%. Uniformity in the anteroposterior direction was affected the most, with little change in right-to-left and feet-to-head directions. All six patients were successfully scanned on the flat couch, although one patient had to be positioned with their arms by their sides. The image quality scores showed no statistically significant change between scans with and without the flat couch in place.
Conclusion
Although the quantitative performance of the coil is affected by the integration of a flat couch top, there is no discernible deterioration of diagnostic image quality, as assessed by two consultant radiologists. Although the flat couch insert moved patients higher in the bore of the scanner, all patients in the study were successfully scanned.
The benefits of using MRI in radiotherapy planning are well established [1-4]. However, its application in radiotherapy is also accompanied by concerns over aspects of image quality, such as geometric accuracy of the images [1-3]. MRI can be integrated into radiotherapy in many ways, involving a range of hardware and software approaches, and even used alone without accompanying CT data [5-10]. The most widespread current practice, however, is for MRI data to be registered to planning CT data [11]. The MRI data are used to mark up the target and organs at risk and the CT data are used by the treatment planning system (TPS) for dose calculation and generation of digitally reconstructed radiographs (DRRs), which aid in treatment set-up verification. The CT data will have been acquired with the patient set-up in the radiotherapy treatment position on a flat couch, whereas the MRI data will often not be set up in this way, owing to the use of the standard “curved” diagnostic couch and the placement of radiofrequency (RF) coils. This mismatch in set-up will affect the accuracy of the image registration, and is counter to the aim of reproducible patient set-up throughout the radiotherapy treatment pathway. Some reports suggest that consistency of immobilisation has a larger impact on organ position (and thus accuracy of registration) than couch shape [12], but many immobilisation devices will require attachment to a flat therapy-style couch. To aid with set-up reproducibility, the integration of immobilisation devices, optimising registration accuracy and to be in line with future developments such as MR simulation, the use of a flat couch for MR scanning is recommended.
At the NI Cancer Centre, we are developing the integration of MRI data in radiotherapy treatment planning. Our GE Signa 1.5 T MR scanner (GE Medical Systems, Milwaukee, WI) was supplied with only the standard diagnostic couch, so, using a polymethyl methacrylate (PMMA) sheet (15 mm thick), we have fabricated a Perspex flat couch top in-house for use with radiotherapy patient scanning. On our MR system, standard diagnostic scanning for pelvic sites such as prostate is performed using the cardiac phased-array RF coil to ensure satisfactory image quality, and this requirement for coil positioning was taken into account when designing the flat couch top. The GE cardiac coil comprises an anteroposterior coil pair, which is curved in shape and has a hard plastic outer casing. The posterior section is designed to integrate snugly into the curved couch top. Fitting our in-house fabricated flat couch top will then introduce a significant gap between the posterior surface of the patient and the coil, potentially degrading the quality of acquired images (Figure 1). In addition, once positioned on the flat couch top, the patient will be considerably higher within the magnet bore, and, for some very large patients, the anterior section of the RF coil may not fit into the bore of the magnet.
Figure 1.
(a) The standard curved couch and (b) the flat couch insert. For each set-up, the distance, D, between coil and phantom is (a) 1.0 cm and (b) 5.5 cm. RF, radiofrequency.
The MRI signal from the body is extremely weak and is detected by receiver coils. To obtain the best image quality and signal-to-noise ratio (SNR), it is important that the RF coils are close to the body and the volume of interest fills the RF coil efficiently (the coil has an optimal “filling factor”) [13]. When using the flat couch top, the posterior of the patient is moved a distance of approximately 4.5 cm from the posterior section of the RF coil, and the filling factor of the coil is degraded. These changes may have an impact on the diagnostic quality of the images acquired with this set-up.
We therefore initiated a study to assess the impact of using a flat couch top on (1) the diagnostic image quality and (2) the numbers of patients which may be comfortably scanned on a flat couch top.
Methods and materials
Quantitative image assessment
Standard spin-echo images were acquired for SNR and uniformity measurements using the parameters defined in the Institute of Physics and Engineering in Medicine's Report No. 80 [14]. The parameters of the spin echo acquisitions are given in Table 1.
Table 1. Standard spin-echo parameters used in quantitative image assessment.
| Sequence parameters | Standard spin echo |
| TE (ms) | 30 |
| TR (ms) | 1000 |
| Field of view (mm) | 250 × 250 |
| Matrix | 256 × 256 |
| Slice thickness (mm) | 5 |
| Number of signal averages | 1 |
| Number of slices | 1 |
| Receive bandwidth | ±15.53 kHz or 121.3 Hz/px |
| Partial phase encoding | 100% |
TE, echo time; TR, repetition time.
Signal-to-noise ratio
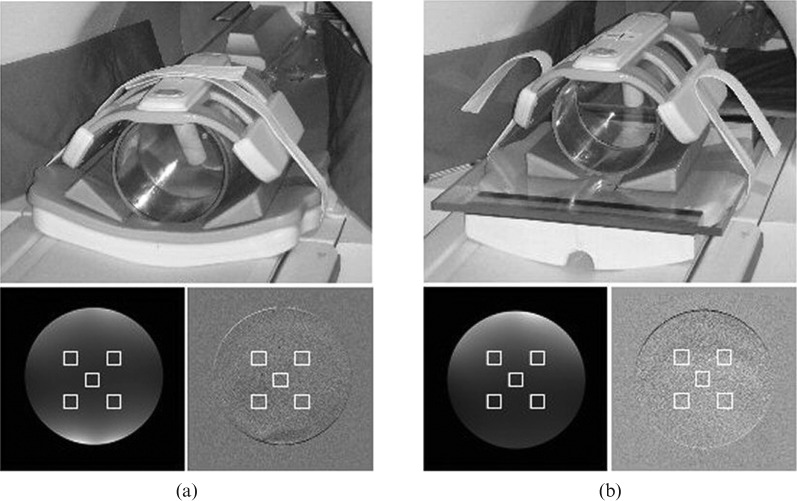
Two identical images of the standardised MagNET (UK organisation for independent testing of MRI systems) SNR phantom were acquired for each of the cardinal planes, axial, sagittal and coronal. The subtraction method of SNR determination was used [14]. The subtraction method is superior to using a single image for finding the SNR, as it accounts for non-uniformity in the image, which is especially true when using surface coils such as the cardiac coil. Five regions of interest (ROIs) were automatically selected on the average of the two images and the resultant subtracted images, using an in-house interactive data language (ITT Visual Information Systems, Boulder, CO) program. This is shown for an axial slice for both the curved and flat couch acquisitions in Figure 2, along with the phantom set-up in each case. The SNR for each region of interest is given by:
 |
Figure 2.
Acquisition set-up (top) and region of interest selection on the average of two images (bottom left) and the resultant subtracted image (bottom right) for (a) the curved table and (b) the flat table.
The  factor is required because the standard deviation is acquired from the subtracted image rather than from the original data. The SNR for each plane is then simply an average of the individual ROI SNRs.
Uniformity
Another important image quality indicator is uniformity. Single images for each plane and each set-up were acquired as described in Table 1 for a similar cylindrical phantom to the MagNET SNR phantom (internal diameter 20 cm), although this phantom was filled with Bayol 85 (supplied by ExxonMobil, Hampshire, UK), a non-conducting paraffinic, technical white mineral oil. This oil is used to eliminate any RF standing-wave effects that may be present if using a conducting solution [14,15].
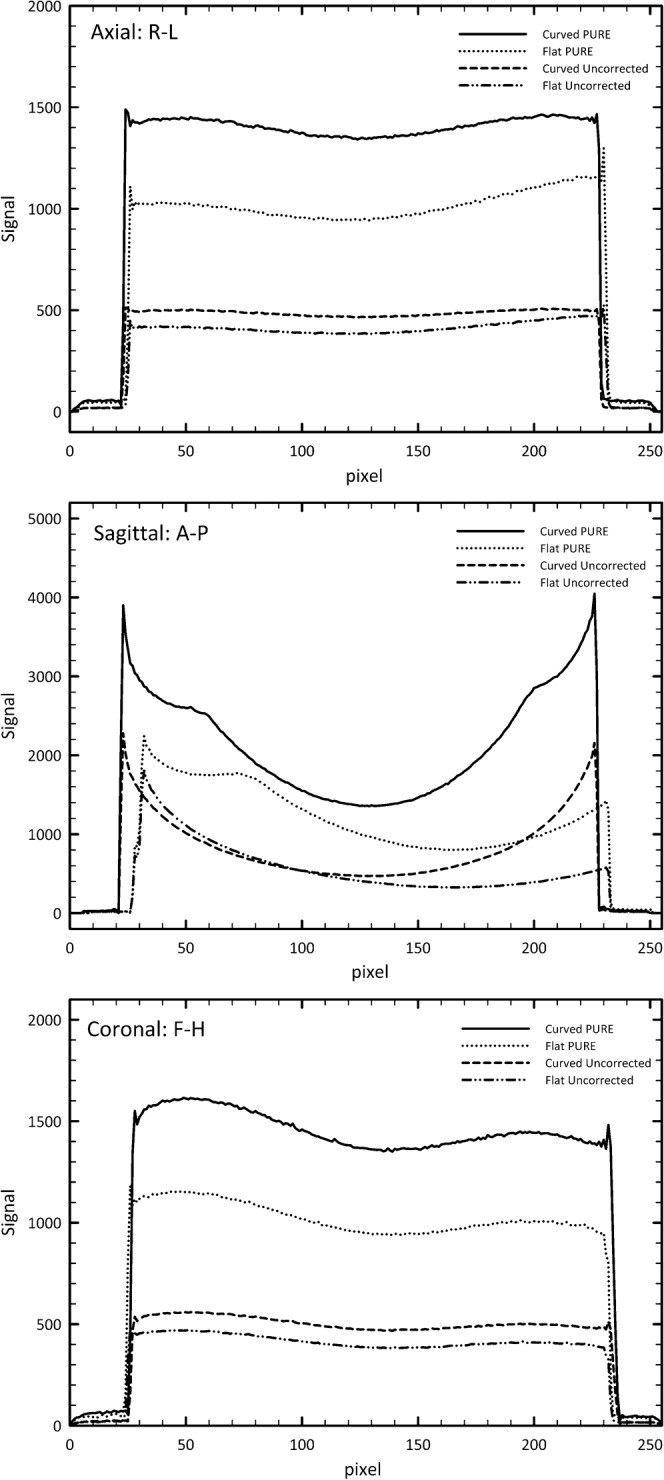
Averaged 10 pixel-wide profiles were taken of each image from right to left and top to bottom, hence analysing uniformity in the anteroposterior, right–left (R–L) and feet–head (F–H) directions. Profiles in the anteroposterior direction will suffer most from non-uniformity, owing to proximity of the coils near the phantom edge. This is appreciated by MRI manufacturers, and they offer various methods of image normalisation to improve the overall image appearance. Our GE scanner offers two options for image normalisation: SCIC (surface coil intensity correction) and PURE (phased-array uniformity enhancement, which requires a calibration scan). Both normalisation methods were investigated, along with the uncorrected images. PURE is used clinically; therefore, only results for PURE and the uncorrected images are presented below.
Clinical assessment
Six patients who were undergoing MRI staging for prostate cancer were recruited to this study. Ethics approval for the study was granted by the Office for Research Ethics Committees Northern Ireland (ORECNI). Inclusion criteria were (1) histological evidence of prostate adenocarcinoma, (2) clinically localised prostate cancer T stage <T4, (3) informed consent and (4) age ≥18 years. Exclusion criteria were (1) MRI contraindication, (2) any psychological, familial, sociological or geographical condition potentially hampering compliance with the study protocol and schedule and (3) extremely large body habitus. The patients' weights ranged from 71 to 81 kg with a mean value of 75 kg. None of the patients were graded as clinically obese. For the purposes of the study, MRI scan appointments were extended by 15 min.
Each patient was positioned as normal on the diagnostic couch and underwent their normal scanning session, with the addition of a large and small field of view (FOV) fast spin echo (FSE) scan. They were then helped off the couch, the flat couch was put in place, and the patient was repositioned with the knee rest and ankle stocks used during prostate radiotherapy planning. The patient was rescanned with only the large and small FOV FSE scans acquired. Each pair of scans acquired on the flat or curved couch had identical parameters (Table 2). In accordance with the usual scanning practice for these patients, no bladder or rectal preparation was performed.
Table 2. MRI parameters for the large and small field of view (FOV) fast spin echo (FSE) scans. All pairs of scans (on either couch top) were performed with identical parameters, on the GE Signa 1.5 T scanner.
| Large FOV | Small FOV | |
| TR (ms) | 3520 | 4900 |
| TE (ms) | 80 | 103 |
| Slice thickness (mm) | 7 | 4 |
| FOV (mm) | 400 | 250 |
| Image matrix (x,y) | 448 × 256 | 384 × 256 |
| No. of averages (NEX) | 2 | 4 |
TR, repetition time; TE, echo time.
Image quality assessment and patient numbers scanned
To assess the diagnostic image quality of the acquired scans, a set of anatomical structures considered necessary to stage prostate cancer were selected. Table 3 shows the list of structures.
Table 3. List of structures to be scored in assessing image quality.
| Structure |
|
| Bony landmark | Solid landmark |
| Asis | Tumour |
| Symphysis pubis | Prostate (zonal anatomy) |
| Sacrum | Rectum |
| Seminal vesicles | |
| Bladder | |
| Facia | |
| Nodes |
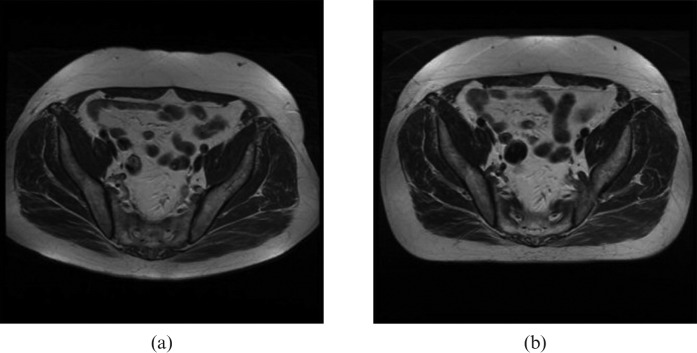
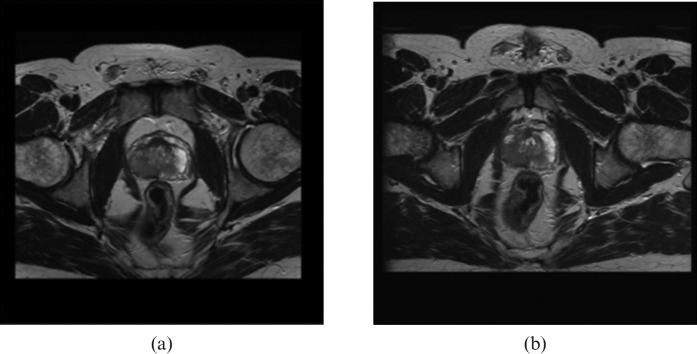
These structures were included in a simple score sheet. Figure 3 shows an example of a pair of images acquired with each couch top in place. The patient shape in the image is obviously a clear indicator of which couch top was used during the scanning. Therefore, to blind the observer, the images were cropped posteriorly and laterally, without affecting the structures of interest. Figure 4 shows an example of the cropping for a similar pair of images.
Figure 3.
Example images of large field of view scans with (a) the standard curved couch top and (b) the flat couch top.
Figure 4.
Example cropped images acquired with (a) the curved couch and (b) the flat couch.
In assessing the images, each radiologist was required to score the ease of visibility of each structure and assign a score of 0 to 3, shown in Table 4. Some structures are more easily visualised than others. In attempting to draw conclusions with such a small patient group, simply comparing the total score for each patient may not be sufficient, as the scores will be dominated by the easily visualised structures and more subtle differences may be hidden. Therefore, scores for a subgroup of more challenging structures (prostate (zonal anatomy), seminal vesicles and nodes) were compiled. This subgroup score is defined as the PSVN score. Scores were averaged from data for each radiologist and compared statistically. With a small group, statistical comparisons are often performed using the non-parametric t-test. However, in this case, with a number of tied scores, usual tests such as the Wilcoxon signed-rank test are not appropriate. A permutation test [16] which is more sensitive for our data (but slightly more computer intensive) was performed to compare the scores. The number of patients successfully imaged was noted.
Table 4. Scoring definitions.
| Score | Definition |
| 0 | Not visualised |
| 1 | Poorly visualised |
| 2 | Satisfactorily visualised |
| 3 | Well/easily visualised |
Results and discussion
Quantitative image assessment
The results in Table 5 show a drop in SNR moving from the curved to flat table, as might be expected owing to decreased proximity of the posterior elements of the cardiac coil. This is also noticeable in the images in Figure 2, in which the flaring due to the posterior coil is evident in the curved couch set-up but not in the flat couch set-up. The reduction in SNR is approximately 14%. This is not a large reduction and should be acceptable in the clinical images.
Table 5. Signal-to-noise ratio (SNR) results for curved and flat table set-ups.
| Axial | Sagittal | Coronal | Mean | |
| Curved table SNR | 214.7 | 224.6 | 228.9 | 222.7 |
| Flat table SNR | 179.1 | 199.2 | 195.1 | 191.1 |
| Reduction in SNR | 16.6% | 11.3% | 14.8% | 14.2% |
Figure 5 shows uniformity profiles along the R-L and F-H directions to be similar. The difference in signal between the two set-ups can also be seen for PURE and uncorrected profiles owing to the increased posterior coil separation from the phantom. The anteroposterior (A–P) profile for data acquired with the flat couch shows significant non-uniformity in the posterior region of the image, as might be expected.
Figure 5.

Uniformity profiles of each of the cardinal directions for both the curved table and flat table set-ups, with and without PURE (phased-array uniformity enhancement) uniformity correction. R-L, right–left; A-P, anteroposterior; F-H, feet–head.
Clinical assessment
Image quality assessment and patient numbers scanned
The scores for each patient are shown in Table 6. The total score for each patient is shown, along with the PSVN score. The permutation test detected no statistical difference (p = 0.2) between the scores (total and PSVN) for the flat couch and the curved couch. There is therefore no statistical evidence for a difference between the image quality of scans acquired on the flat or curved couch. Although the sample number is small, the confidence interval based on total scores (−3.1 to 0.50) shows that score differences as small as 3 can be detected. The data are assumed to be normally distributed.
Table 6. Scores for image quality. The scores are averages of data from both radiologists. The scores for each case are labelled as either a total (summed for all structures) or PSVN (summed for prostate, seminal vesicles and nodes only).
| Patient | Flat couch scores |
Curved couch scores |
||
| Total | PSVN | Total | PSVN | |
| 1 | 24 | 7 | 28 | 8.5 |
| 2 | 28.5 | 7.5 | 28.5 | 7.5 |
| 3 | 28.5 | 7.5 | 28.5 | 7.5 |
| 4 | 27.5 | 7 | 28.5 | 7.5 |
| 5 | 27 | 8.5 | 30 | 9 |
| 6 | 30 | 9 | 30 | 9 |
All patients in the study could be scanned successfully on the flat couch. One patient, however, was not able to be scanned with the arms across the chest, as per the standard radiotherapy set-up; therefore, this patient was scanned with their arms by their sides. Here, we have a 100% success rate in scanning the patients recruited to the study. However, when defining a confidence interval for our group, the success rate when scanning a larger group would cover the range 54–100%.
Having curved and flat couch-acquired MRI data, it is possible to fuse the planning CT data to each set of MRI data, and assess any change in structure position and any impact on registration accuracy relating to the use of the flat couch. However, when we investigated this potential, any differences in organ position were masked by the larger changes in rectal and bladder filling between scan sets.
Conclusion
We have assessed the impact of using an in-house fabricated flat couch top for imaging six pelvic radiotherapy patients on a GE Signa 1.5 T MRI scanner.
Although the couch top raised the patients' vertical set-up position, all were successfully scanned. We could therefore expect the majority of patients to be scanned with the couch top in situ. The image quality of scans acquired with and without the couch top was assessed by two (blinded) consultant radiologists. There was found to be no statistically significant impact to the diagnostic image quality with the use of the couch top for images acquired with the cardiac coil.
We now plan to proceed with a radiotherapy planning study using MR images obtained with the flat couch insert and registered with planning CT scans, with both sets of data acquired under similar patient bladder and rectum preparation conditions.
Acknowledgments
The authors would like to express their thanks to Dr D Irvine for her help with aspects of image processing in this work, and for statistics input and advice from Dr Chris Cardwell, Department of Epidemiology, Queen's University, Belfast.
References
- 1.Khoo V, Dearnley D, Finnigan DJ, Padhani A, Tanner SF, Leach MO. MRI: considerations and applications in radiotherapy treatment planning. Radiother Oncol 1997;42:1–15 [DOI] [PubMed] [Google Scholar]
- 2.Khoo V. Magic radiotherapy imaging for treatment planning. Br J Radiol 2000;73:229–33 [DOI] [PubMed] [Google Scholar]
- 3.Evans P. Anatomical imaging for radiotherapy. Phys Med Biol 2008;53:R151–91 [DOI] [PubMed] [Google Scholar]
- 4.Royal College of Radiologists Imaging for oncology. London, UK: RCR, 2004 [Google Scholar]
- 5.Krempien RC, Schubert K, Zierhut D, Steckner MC, Treiber M, Harms W, et al. Open low-field magnetic resonance imaging in radiation therapy treatment planning. Int J Radiat Oncol Biol Phys 2002;53:1350–60 [DOI] [PubMed] [Google Scholar]
- 6.Parker CC, Damyanovich A, Haycocks T, Haider M, Bayley A, Catton CN. Magnetic resonance imaging in the radiation treatment planning of localised prostate cancer using intra-prostatic fiducial markers for computed tomography co-registration. Radiother Oncol 2003;66:217–24 [DOI] [PubMed] [Google Scholar]
- 7.Karlsson M, Karlsson MG, Nyholm T, Amies C, Zackrisson B. Dedicated magnetic resonance imaging in the radiotherapy clinic. Int J Radiat Oncol Biol Phys 2009;74:644–51 [DOI] [PubMed] [Google Scholar]
- 8.Yin FF, Gao Q, Xie H, Nelson DF, Yu Y, Kwok WE, et al. MR image-guided portal verification for brain treatment field. Int J Radiat Oncol Biol Phys 1998;40:703–11 [DOI] [PubMed] [Google Scholar]
- 9.Raaijmakers BW, Lagendijk JJ, Overweg J, Kok JG, Raaijmakers AJ, Kerkhof EM, et al. Integrating a 1.5 T MRI scanner with a 6 MV accelerator: proof of concept. Phys Med Biol 2009;54:N229–37 [DOI] [PubMed] [Google Scholar]
- 10.Lee YK, Bollet M, Charles-Edwards G, Flower MA, Leach MO, McNair H, et al. Radiotherapy treatment planning of prostate cancer using magnetic resonance imaging alone. Radiother Oncol 2003;66:203–16 [DOI] [PubMed] [Google Scholar]
- 11.Nyholm T, Nyberg M, Karlsson MG, Karlsson M. Systemisation of spatial uncertainties for comparison between a MR and a CT-based radiotherapy workflow for prostate treatments. Radiat Oncol 2009;4:54. [DOI] [PMC free article] [PubMed] [Google Scholar]
- 12.Steenbakkers RJHM, Duppen JC, Betgen A, Lotz HT, Remeijer P, Fitton I, et al. Impact of knee support and shape of tabletop on rectum and prostate position. Int J Radiat Oncol Biol Phys 2004;60:1364–72 [DOI] [PubMed] [Google Scholar]
- 13.McRobbie D, Moore E, Graves M, Prince M. From picture to proton. Cambridge, UK: Cambridge University Press, 2007 [Google Scholar]
- 14.Lerski R, De Wilde J, Boyce D, Ridgway J. Quality control in magnetic resonance imaging. York, UK: Institute of Physics and Engineering, 1998. IPEM Report No. 80. [Google Scholar]
- 15.Tofts PS. Standing waves in uniform water phantoms. J Magn Reson Series B 1994;104:143–7 [Google Scholar]
- 16.Good PI. Permutation, parametric and bootstrap tests of hypotheses. New York, NY: Springer, 2005 [Google Scholar]


