

Abstract
The current study investigates the feasibility of using texture analysis to quantify the heterogeneity of lesion enhancement kinetics in order to discriminate malignant from benign breast lesions. A total of 82 biopsy-proven breast lesions (51 malignant, 31 benign), originating from 74 women subjected to dynamic contrast-enhanced magnetic resonance imaging (DCE-MRI) were analysed. Pixel-wise analysis of DCE-MRI lesion data was performed to generate initial enhancement, post-initial enhancement and signal enhancement ratio (SER) parametric maps; these maps were subsequently subjected to co-occurrence matrix texture analysis. The discriminating ability of texture features extracted from each parametric map was investigated using a least-squares minimum distance classifier and further compared with the discriminating ability of the same texture features extracted from the first post-contrast frame. Selected texture features extracted from the SER map achieved an area under receiver operating characteristic curve of 0.922 ± 0.029, a performance similar to post-initial enhancement map features (0.906 ± 0.032) and statistically significantly higher than for initial enhancement map (0.767 ± 0.053) and first post-contrast frame (0.756 ± 0.060) features. Quantifying the heterogeneity of parametric maps that reflect lesion washout properties could contribute to the computer-aided diagnosis of breast lesions in DCE-MRI.
Dynamic contrast-enhanced magnetic resonance imaging (DCE-MRI) significantly complements mammography and is characterised by its high sensitivity in detecting breast cancer. However, its specificity in distinguishing malignant from benign lesions is highly varied: reported values range from 37 up to 90% [1]. This variation is mainly due to the variety of image acquisition protocols and interpretation schemes adopted in clinical practice [2].
Diagnostic criteria in DCE-MRI of breast masses [3, 4] include assessment of morphological features such as lesion shape, margin and enhancement homogeneity (internal architecture), as well as analysis/assessment of signal intensity–time curves generated from manually selected regions of interest (ROIs) within the lesion area. The analysis of signal intensity–time curves can be performed qualitatively (i.e. visual inspection of the curve shape [5, 6]), by means of empirical parameters (e.g. relative enhancement, time-to-peak enhancement, washout ratio [7]) or quantitatively through pharmacokinetic modelling techniques [8].
The subjective selection of ROI within the lesion accounts for the increased intra- and interobserver variability in the interpretation of lesion enhancement kinetics and for the discrepancy of reported findings [9, 10]. While the selection of an ROI that captures the entire lesion is less subjective [11], it provides average enhancement kinetics estimates and completely ignores the heterogeneity of tumour vascular characteristics, which is diagnostically important [12]. Pixel-wise analysis of enhancement kinetics (based either on pharmacokinetic modelling or on model-free approaches [8]) and subsequent parametric mapping is a viable alternative for removing subjectivity in selecting an ROI within the lesion and for visualising heterogeneity of lesion enhancement kinetics [12].
Quantification of lesion enhancement kinetics heterogeneity is a promising approach towards cancer diagnosis and evaluation of anticancer therapy [13]. However, this approach has not been fully investigated in the differentiation of malignant from benign breast lesions in DCE-MRI. Reported studies have demonstrated that malignant lesions can be differentiated from benign lesions by means of their increased heterogeneity as expressed on exchange rate parameter maps [14], on normalised maximum intensity–time ratio (nMITR) projection data [15], and on lesion data of a single post-contrast time frame [16–19].
Specifically, Issa et al [14] quantified heterogeneity of breast lesions expressed on exchange rate parameter maps provided by pixel-wise three-compartment pharmacokinetic modelling over semi-automatically delineated ROIs. Heterogeneity was quantified by means of the standard deviation of the lesion exchange rate distribution, as well as by the heterogeneity-slope variable reflecting the change of the parameter mean value calculated over 10 different segments of the lesion parameter distribution. A specificity of 88% with sensitivity of 88% was achieved in the classification of 50 breast lesions (25 malignant, 25 benign), suggesting the possible value of lesion heterogeneity quantification metrics in breast lesion differentiation.
Ertaş et al [15] exploited six first-order statistics (maximum, mean, standard deviation, skewness, kurtosis and entropy) of three-dimensional nMITR projection data from automatically segmented breast lesions. The entropy feature demonstrated the highest performance in discriminating 29 malignant from 23 benign breast lesions, achieving an area under receiver operating characteristic (ROC) curve value (Az index) of 0.97 ± 0.03.
Chen et al [20], in addition to morphological (shape and margin) and average enhancement kinetics features of automatically three-dimensional segmented breast lesions, investigated the discriminating ability of enhancement–variance dynamics features describing the time course of the spatial variance of the enhancement within the lesion. A selected feature subset (including three morphological features, one enhancement kinetics feature and two enhancement–variance dynamics features) demonstrated the highest performance in discriminating 77 malignant from 44 benign breast lesions, achieving an Az value of 0.86 ± 0.04.
Sinha et al [16] investigated the ability of grey level co-occurrence matrices (GLCM) texture features in addition to average contrast uptake features and boundary metrics in discriminating 20 malignant from 23 benign lesions employing linear discriminant analysis. The boundary features performed better (70% sensitivity, 86% specificity) than contrast uptake (70% sensitivity, 83% specificity) and texture features (75% sensitivity, 70% specificity), while the highest performance (95% sensitivity, 93% specificity) was achieved by a combination of 10 features across the three feature sets, also including patient age.
Gibbs et al [17] investigated GLCM features extracted from a manually drawn ROI encompassing the lesion on a representative post-contrast slice. Using logistic regression analysis, a subset of three texture features achieved an Az value of 0.80 ± 0.07 in discriminating 45 malignant from 34 benign lesions. When combining texture features with lesion size, patient age and time to maximum enhancement, diagnostic accuracy was increased to 0.92 ± 0.05.
Chen et al [18] proposed a volumetric texture analysis by means of GLCM features extracted from the first post-contrast series of automatically segmented three-dimensional breast lesions. The method was tested on a data set of 121 breast lesions (77 malignant, 44 benign) and further compared to a two-dimensional texture analysis approach. The three-dimensional texture analysis yielded significantly higher classification performance (the best performing feature achieved an Az value of 0.86 ± 0.04) as compared with the two-dimensional texture analysis, suggesting its potential in computer-aided diagnosis of breast lesions in DCE-MRI.
In a paper by Nie et al [19], GLCM texture features were extracted from automatically segmented post-contrast lesion data (1 min after contrast arrival) and were further combined with morphology features for the differentiation of 43 malignant from 28 benign breast lesions. Classification performance based on three selected texture features was Az = 0.78, which was increased to Az = 0.86 when combined with three morphology features. The authors further demonstrated that the selected texture features were associated with visual descriptors (pattern heterogeneity and enhancement intensity) defined in the Breast Imaging Reporting and Data System (BI-RADS) lexicon [21].
Predefined studies employing GLCM features applied to DCE-MRI breast lesion data of a particular time frame [16–19] do not consider signal intensity variation over time, as opposed to studies quantifying heterogeneity of enhancement kinetic parameters employing first-order statistics approaches [14, 15, 20]. Recently, a four-dimensional co-occurrence texture analysis approach (considering signal intensity variation over time) [22] and a multispectral co-occurrence analysis with three random variables (defined by three pharmacokinetic parameters) [23] were proposed for voxel classification-based segmentation of the malignant breast tissue. These approaches yielded promising results.
The current study investigates heterogeneity of lesions with respect to three enhancement kinetic parameters, namely initial enhancement (IE), post-initial enhancement (PIE) and signal enhancement ratio (SER), and its feasibility in discriminating malignant from benign breast lesions. For this purpose, GLCM-based texture features are extracted from three corresponding lesion parametric maps and their ability to distinguish malignant from benign lesions is investigated using a least-squares minimum distance classifier. Classification performance of texture features extracted from each parametric map is evaluated by means of ROC analysis and further compared with the performance of corresponding texture features extracted from the lesion area of first post-contrast frame.
Materials and methods
Case sample
The case sample consists of 82 histologically verified breast lesions, originating from 74 women with mammographically detected or palpable findings. Histology revealed 51 malignant lesions originating from 48 women and 31 benign lesions originating from 26 women (Table 1). Patient age, at the time of acquisition, ranged from 19 to 82 years (mean±standard deviation = 54.7 ± 13.9 years). The mean lesion size was 19.2 mm (standard deviation = 17.1 mm), ranging from 9.5 to 40.3 mm, with a median size of 16.5 mm.
Table 1. Distribution of lesions with respect to histology type.
| Histology type | Number of lesions | Number of patients |
| Invasive ductal carcinoma (NOS) | 45 | 43 |
| Invasive lobular carcinoma | 2 | 2 |
| Mucinous | 2 | 1 |
| Phylloid | 1 | 1 |
| Medullary | 1 | 1 |
| Fibroadenoma | 27 | 22 |
| Blunt duct adenosis | 1 | 1 |
| Fibrocystic changes | 1 | 1 |
| Adenosis and fibrosis | 1 | 1 |
| Lactating adenoma | 1 | 1 |
NOS, not otherwise specified.
Women were subjected to MRI with a 1.5T system (Magnetom Vision; Siemens, Erlangen, Germany) and a bilateral dedicated phased-array breast coil, with the patient in a prone position. A coronal three-dimensional T1-weighted spoiled gradient echo sequence (repetition time (TR) 8.1 ms, echo time (TE) 4 ms, flip angle 20°, matrix 256 × 256, field of view (FOV) 320 mm, in-plane resolution 1.25 × 1.25 mm2, slice thickness 2.5 mm, number of slices 64) was acquired before and five times after intravenous administration of 0.2 mmol kg−1 gadopentetate dimeglumine (Magnevist; Schering, Berlin, Germany) followed by a 10 ml saline solution flush. The five post-contrast series were acquired with a time interval of 60 s.
Lesion enhancement kinetic parametric maps
For each lesion, a single slice containing the largest cross-section of the lesion was selected in consensus by two experienced radiologists [11]. From the corresponding time series, three enhancement kinetic parameters, commonly adopted in clinical practice for analysis of signal intensity–time curves, were calculated in a pixel-wise fashion and used to create three enhancement kinetic parametric maps.
Before calculating enhancement kinetics features, data pre-processing was performed by means of median filtering applied on each pre- and post-contrast slice through a 3 × 3 pixel sliding window [24].
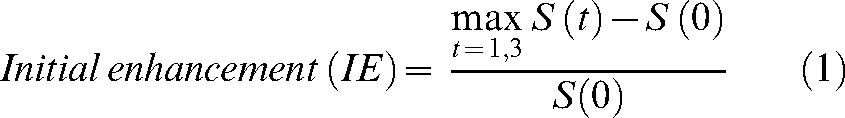
Denoting as S(t), S(t) = {S(0), S(1), …, S(5)}, the signal intensity of each pixel in the pre-processed data, at time point t (t = {0,1,2,…,5}) the following three enhancement kinetic parameters were calculated:
 |
(1) |
where S(0) is the signal intensity at the pre-contrast frame (t = 0).
 |
(2) |
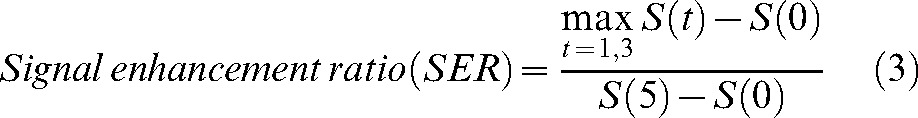 |
(3) |
The IE parameter (Equation 1), calculated as in [25, 26], describes the initial signal increase from the pre-contrast measurement to the maximum value increase within the first 3 min after the administration of contrast medium.
The PIE parameter (Equation 2), calculated as in [25, 26], describes the post-initial behaviour of the signal curve from the maximum peak within the first 3 min to the end of the examination (fifth minute after contrast medium administration).
The SER parameter (Equation 3), calculated as in [27], is also used to characterise the post-initial behaviour of the signal curve (is a measure of washout) [28], incorporating both the signal change in the initial and the post-initial phase relative to the pre-contrast signal measurement.
Three enhancement kinetic parametric maps were generated corresponding to the three enhancement kinetic parameters (Equations 1–3).
The IE map was used to delineate lesion boundary. Specifically, lesion delineation was achieved by applying histogram thresholding on a rectangular ROI containing the lesion, followed by morphological operations (i.e. hole-filling, dilation and erosion). The threshold for each lesion was manually defined by one radiologist experienced in breast MRI without knowledge of clinical information or histological outcome. During lesion delineation both pre- and post-contrast image series as well as subtraction images were available. The delineated lesion boundary was subsequently used to define corresponding lesion areas in each parametric map, providing the basis for texture analysis. The median lesion area of the data set analysed was 180 pixels (interquartile range: 102 to 238 pixels) for the malignant cases and 105 pixels (interquartile range: 99 to 162 pixels) for the benign cases.
Figure 1 depicts an example of parametric map generation for a malignant lesion (invasive lobular carcinoma, patient age 68 years).
Figure 1.

Illustrative example of lesion parametric map generation. (a) 1st post-contrast slice with region of interest (ROI) containing a malignant lesion (invasive lobular carcinoma). (b) Magnified ROI containing the lesion. (c) Initial enhancement map ROI with delineated lesion boundary (boundary pixels assigned to white grey level). (d) Initial enhancement lesion map. (e) Post-initial enhancement lesion map. (f) Signal enhancement ratio lesion map.
Texture analysis of lesion parametric maps
To minimise the influence of contrast and brightness variation on the subsequent texture analysis, normalisation of lesion parametric maps was performed [29]. Specifically, limitation of each lesion parametric map dynamics was performed by excluding pixels outside the range [μ−4σ, μ+4σ] (where μ is the mean of pixel values within the delineated lesion area and σ is the standard deviation).
The obtained range was then quantised to 4, 5 and 6 bits through a linear transformation. Specifically, the pixel parameter value (I) was transformed to a grey level (g) through [18]:
 |
(4) |
where G is the number of grey levels (i.e.
G = 16, 32 and 64 for 4, 5 and 6 bit quantization, respectively), g
 [1, G], while L and H are the lower and upper parameter limits, respectively. Square brackets denote the nearest integer operator. For each parametric map, the values of L and H were specified as the 0.5th and 99.5th percentile of all pixel parameter values of the 82 lesions included in the case sample.
Fourteen GLCM-based texture features were extracted from each lesion parametric map. The GLCM is a well-established robust statistical tool for extracting second-order texture information from images [30]. The GLCM characterises the spatial distribution of grey levels in an image. Fourteen textural features were calculated from four GLCMs (corresponding to a distance = 1 pixel, and four angles: 0°, 45°, 90°,135°): angular second moment, correlation, variance, inverse difference moment, entropy, contrast, sum average, sum variance, sum entropy, difference average, difference variance, difference entropy, information measure of correlation 1 and information measure of correlation 2. The mean value of each feature over the four GLCMs was calculated, giving in total 14 GLCM features.
Lesion classification
A least squares minimum distance (LSMD) classifier [31] was used for the classification of malignant from benign breast lesions based on the extracted texture features of each lesion parametric map. The core of the LSMD classifier is a least-squares mapping from the feature space to the decision space, by means of a transformation generally chosen such that the overall mean-square mapping error is minimised [31]. In the LSMD classification process, an unknown pattern Zij (where Zij denotes the jth pattern belonging to class Ci) is initially mapped into a specified point Vi (i = 1,2,…k; k = number of classes) in the decision space, and subsequently classified to Ci if it is mapped closest to Vi.
The discriminant function for class i is given by:
| (5) |
where,  are coefficients of the transformation matrix,
  are the pattern vector elements and d is the dimension of the feature space. For a two-class classification problem, as in the current study, if g1(Z)>g2(Z) the Z pattern is assigned to class 1 (malignant); otherwise, the Z pattern is assigned to class 2 (benign).
The performance of the classifier for each texture feature was evaluated by means of the area under ROC curve (Az index) [32]. A statistical software package (NCSS Statistical Software 2007, Kaysville, Utah) was used for generation of empirical ROC curves (employing the output values of the discriminant function as malignancy/operating thresholds), calculation of area under the estimated ROC curve (Az index) and corresponding standard error (SE) and asymmetric 95% confidence interval (CI) values.
A stepwise feature selection procedure [33] was used to derive one feature subset from each lesion parametric map. The discriminating ability of the selected feature subsets was investigated using the LSMD classifier and the Az index was employed for evaluating classification performance.
The training and testing of the classifier, both for individual texture features and for the selected feature subsets, was performed using the leave-one-patient-out methodology [34].
The classification performance of texture features extracted from each parametric map was also compared with the performance of corresponding texture features extracted from the first post-contrast frame of the representative lesion slice. For this purpose, the delineated lesion boundary was used to define corresponding lesion area on the first post-contrast frame (with signal intensities relative to the pre-contrast intensities provided by [S(1)−S(0)]/S(0) and processed in an identical manner to lesion parametric maps (i.e. limiting analysis within the range [μ−4σ, μ+4σ] and subsequent range quantisation according to Equation 4 for texture feature extraction and classification.
To test if the difference in classification performance of texture features between lesion parametric maps and between each lesion parametric map and the first post-contrast frame is statistically significant or not, the z-test (available in NCSS Statistical Software) was performed. The Holm-Bonferroni correction method for multiple tests [35] was used to adjust the level of significance. In this procedure, the p-values for n individual hypothesis tests are ordered so that p1≤p2≤…≤pn, and each pi is compared with a significance level a/(n−i+1) to determine whether a statistically significant difference exists. In case of comparing classification performance of individual texture features between lesion parametric maps and between each lesion parametric map and the first post-contrast frame, n equals to 84 (i.e. 14 features ×6 possible comparisons among lesion parametric maps and first post-contrast frame). In case of comparing classification performance of selected feature subsets between lesion parametric maps and between each lesion parametric map and the first post-contrast frame, n equals to 6.
The Shapiro-Wilk test was used to test normality of texture features extracted from lesion parametric maps and first post-contrast frame of the benign and malignant cases. As some of the extracted texture features follow a non-normal distribution, the Wilcoxon rank-sum test was used to test the significance difference of each texture feature between malignant and benign lesions, also using the Holm-Bonferroni correction method for multiple tests (in this case n equals to 14).
The NCCS Statistical Software was used to perform the predefined statistical tests, as well as to derive median and interquartile range values of texture features extracted from lesion parametric maps and first post-contrast frame of benign and malignant cases.
Results
Figure 2 illustrates the IE map, PIE map and SER map, as well as the first post-contrast frame lesion area of a fibroadenoma (patient age: 35 years) and an invasive ductal carcinoma (patient age: 64 years). For visualisation purposes the two lesions are depicted with the same window width, per parametric map, centered at the mean parameter value of the lesion. The benign lesion appears more heterogeneous than the malignant one on both the first post-contrast frame and on the IE map. The malignant lesion appears more heterogeneous than the benign one on the PIE and the SER maps.
Figure 2.

Initial enhancement map, post-initial enhancement map, signal enhancement ratio map and 1st post-contrast frame of a benign (fibroadenoma) and a malignant (invasive ductal carcinoma) lesion.
Fourteen GLCM features were used to quantify texture properties of each lesion parametric map. Three quantisation levels (i.e. G = 16, 32 and 64 grey levels) were investigated in co-occurrence matrices generation, provided by Equation 4. The values of [L, H] were found to be equal to [0.32, 4.56], [−0.35, 0.34] and [0.54, 2.18] for the IE, the PIE and the SER map, respectively. L and H values for texture feature extraction from the lesion area on the first post-contrast frame were found equal to 0.05 and 2.92, respectively. For most of the 14 texture features investigated, classification performance was slightly increased with increasing value of G, at the expense of computational time. In the data set analysed, a G value of 64 grey levels was found to be an optimal choice, by improving discriminating ability of texture features and preserving image detail.
Tables 2 and 3 provide median and interquartile range values for the extracted texture features (with G = 64 grey levels) from each parametric map and from the first post-contrast frame, for benign and malignant lesions of the case sample analysed. The p-values (Wilcoxon rank-sum test for unpaired data) corresponding to the difference between texture feature values of malignant and benign cases are also provided; p-values less than the required level of significance indicate a statistically significant difference.
Table 2. Differentiation of texture features between malignant and benign lesions in IE and PIE mapsa.
| Feature |
Initial enhancement (IE) map |
Post-initial enhancement (PIE) map |
||||||
| Malignant | Benign | p-Value | Required | Malignant | Benign | p-Value | Required | |
| ASM | 0.008 (0.007, 0.012) | 0.012 (0.008, 0.018) | 0.0016 | 0.00385 | 0.007 (0.006, 0.012) | 0.016 (0.010, 0.021) | <0.0001 | 0.00385 |
| COR | 0.594 (0.540, 0.664) | 0.552 (0.469, 0.665) | 0.1838 | 0.00833 | 0.534 (0.439, 0.619) | 0.349 (0.215, 0.456) | <0.0001 | 0.00556 |
| VAR | 33.943 (24.006, 58.155) | 42.561 (27.5299, 73.841) | 0.2174 | 0.01000 | 41.761 (27.657, 65.853) | 22.367 (14.344, 35.769) | <0.0001 | 0.00625 |
| IDM | 0.273 (0.231, 0.313) | 0.251 (0.218, 0.298) | 0.2842 | 0.01250 | 0.241 (0.210, 0.278) | 0.272 (0.234, 0.317) | 0.0147 | 0.01667 |
| ENTR | 2.157 (2.072, 2.267) | 1.996 (1.806, 2.146) | 0.0011 | 0.00357 | 2.247 (1.996, 2.333) | 1.890 (1.760, 2.095) | <0.0001 | 0.00417 |
| CON | 28.469 (18.176, 40.475) | 39.676 (21.42, 71.841) | 0.0818 | 0.00556 | 35.372 (26.896, 56.848) | 24.631 (17.321, 40.502) | 0.0066 | 0.01000 |
| SUM AVER | 35.962 (28.347, 48.438) | 39.715 (27.342, 64.899) | 0.3894 | 0.05000 | 62.112 (55.054, 69.061) | 74.877 (69.104, 89.390) | <0.0001 | 0.00454 |
| SUM VAR | 110.315 (77.376, 195.526) | 136.376 (83.994, 251.852) | 0.2842 | 0.02500 | 131.490 (81.947, 200.747) | 54.659 (36.995, 101.809) | <0.0001 | 0.00500 |
| SUM ENTR | 1.517 (1.438, 1.644) | 1.458 (1.381, 1.544) | 0.0707 | 0.00500 | 1.543 (1.436, 1.632) | 1.369 (1.226, 1.449) | <0.0001 | 0.00357 |
| DIF AVER | 4.690 (4.101, 5.703) | 5.549 (4.213, 7.031) | 0.0961 | 0.00625 | 5.287 (4.828, 6.323) | 4.728 (4.080, 5.522) | 0.0056 | 0.00833 |
| DIF VAR | 13.646 (7.712, 18.488) | 18.000 (9.367, 31.277) | 0.1000 | 0.00714 | 15.506 (12.288, 25.708) | 11.263 (7.796, 18.439) | 0.0132 | 0.01250 |
| DIF ENTR | 1.015 (0.937, 1.079) | 1.031 (0.964, 1.154) | 0.2842 | 0.01667 | 1.070 (1.027, 1.115) | 0.962 (0.929, 1.064) | <0.0001 | 0.00714 |
| IMCA1 | −0.312 (−0.425, −0.261) | −0.398 (−0.478, −0.298) | 0.0417 | 0.00454 | −0.334 (−0.370, −0.236) | −0.332 (−0.443, −0.218) | 0.6889 | 0.05000 |
| IMCA2 | 0.747 (0.688, 0.823) | 0.819 (0.760, 0.858) | 0.0093 | 0.00417 | 0.778 (0.719, 0.801) | 0.764 (0.641, 0.803) | 0.1967 | 0.02500 |
ASM, angular second moment; COR, correlation; VAR, variance; IDM, inverse difference moment; ENTR, entropy; CON, contrast; SUM AVER, sum average; SUM VAR, sum variance; SUM ENTR, sum entropy; DIF AVER, difference average; DIF VAR, difference variance; DIF ENTR, difference entropy; IMCA1, information measure of correlation 1; IMCA2, information measure of correlation 2.
aThe table shows median and interquartile range values together with p-values (Wilcoxon rank-sum test for unpaired data) and the required level of significance a; p-values in bold indicate a statistically significant difference.
Table 3. Differentiation of texture features between malignant and benign lesions in signal enhancement ratio map and first post-contrast framea.
| Feature |
Signal enhancement ratio (SER) map |
First post-contrast frame |
||||||
| Malignant | Benign | p-Value | Required a | Malignant | Benign | p-Value | Required a | |
| ASM | 0.010 (0.007, 0.014) | 0.025 (0.018, 0.036) | <0.0001 | 0.00417 | 0.007 (0.005, 0.010) | 0.014 (0.008, 0.021) | 0.0002 | 0.00385 |
| COR | 0.508 (0.415, 0.628) | 0.374 (0.219, 0.499) | <0.0001 | 0.01250 | 0.666 (0.556, 0.704) | 0.573 (0.510, 0.704) | 0.0622 | 0.00500 |
| VAR | 23.174 (15.962, 39.117) | 9.576 (6.066, 14.739) | <0.0001 | 0.00500 | 69.596 (32.227, 102.167) | 36.039 (11.413, 95.802) | 0.0835 | 0.00625 |
| IDM | 0.282 (0.238, 0.342) | 0.348 (0.288, 0.471) | 0.0001 | 0.01667 | 0.226 (0.197, 0.274) | 0.266 (0.191, 0.360) | 0.2632 | 0.01667 |
| ENTR | 2.119 (1.929, 2.268) | 1.711 (1.602, 1.840) | <0.0001 | 0.00357 | 2.239 (2.049, 2.388) | 1.897 (1.727, 2.153) | <0.0001 | 0.00357 |
| CON | 23.755 (15.991, 38.632) | 12.813 (6.940, 17.654) | <0.0001 | 0.01000 | 42.873 (23.348, 66.946) | 31.054 (9.733, 72.055) | 0.1775 | 0.01000 |
| SUM AVER | 40.885 (36.106, 46.706) | 31.981 (25.186, 35.566) | <0.0001 | 0.00625 | 39.924 (30.437, 57.929) | 32.505 (17.507, 49.863) | 0.1284 | 0.00714 |
| SUM VAR | 78.910 (45.734, 127.202) | 28.293 (14.928, 40.332) | <0.0001 | 0.00454 | 222.740 (106.622, 360.052) | 113.101 (35.187, 302.740) | 0.0753 | 0.00556 |
| SUM ENTR | 1.496 (1.327, 1.540) | 1.161 (1.111, 1.293) | <0.0001 | 0.00385 | 1.614 (1.496, 1.723) | 1.407 (1.222, 1.627) | 0.0008 | 0.00417 |
| DIF AVER | 4.515 (3.941, 5.444) | 3.623 (2.706, 4.305) | <0.0001 | 0.00714 | 5.902 (4.541, 6.953) | 5.060 (3.357, 7.538) | 0.2103 | 0.01250 |
| DIF VAR | 11.005 (7.276, 18.208) | 6.111 (3.749, 9.058) | <0.0001 | 0.00833 | 19.187 (10.346, 29.821) | 12.953 (4.443, 27.557) | 0.1308 | 0.00833 |
| DIF ENTR | 0.978 (0.916, 1.074) | 0.840 (0.707, 0.908) | <0.0001 | 0.00556 | 1.098 (1.002, 1.171) | 0.998 (0.803, 1.181) | 0.0570 | 0.00454 |
| IMCA1 | −0.281 (−0.357, −0.233) | −0.275 (−0.352, −0.197) | 0.6326 | 0.05000 | −0.374 (−0.447, −0.295) | −0.374 (−0.528, −0.286) | 0.6337 | 0.02500 |
| IMCA2 | 0.730 (0.660, 0.768) | 0.654 (0.572, 0.737) | 0.0057 | 0.02500 | 0.818 (0.770, 0.861) | 0.820 (0.696, 0.878) | 0.7378 | 0.05000 |
ASM, angular second moment; COR, correlation; VAR, variance; IDM, inverse difference moment; ENTR, entropy; CON, contrast; SUM AVER, sum average; SUM VAR, sum variance; SUM ENTR, sum entropy; DIF AVER, difference average; DIF VAR, difference variance; DIF ENTR, difference entropy; IMCA1, information measure of correlation 1; IMCA2, information measure of correlation 2.
aThe table shows median and interquartile range values together with p-values (Wilcoxon rank-sum test for unpaired data) and the required level of significance a; p-values in bold indicate a statistically significant difference.
Table 4 provides classification performance of texture features extracted from each lesion parametric map and from the first post-contrast frame lesion area, by means of Az±SE values and (lower, upper) asymmetric 95% CI values. The features angular second moment, entropy and sum entropy were found to be the most discriminating on both SER and PIE maps, as well as on the first post-contrast frame. Among features extracted from the IE map, angular second moment and entropy also demonstrated the highest classification performance. Angular second moment is a measure of image homogeneity (uniformity), while entropy and sum entropy reflect image randomness (heterogeneity). Both on parametric maps and on the first post-contrast frame malignant lesions are presented more heterogeneously (higher values of entropy and sum entropy; lower values of angular second moment) than benign ones (Tables 2 and 3).
Table 4. Classification performance of texture features extracted from lesion parametric maps and the 1st post-contrast framea.
| Feature | Initial enhancement (IE) map | Post-initial enhancement (PIE) map | SER map | First post-contrast frame |
| ASM | 0.691 ± 0.064 (0.545, 0.797) | 0.846 ± 0.041 (0.743, 0.910) | 0.914 ± 0.031 (0.829, 0.958) | 0.740 ± 0.061 (0.597, 0.838) |
| COR | 0.569 ± 0.070 (0.416, 0.691) | 0.787 ± 0.054 (0.656, 0.872) | 0.746 ± 0.057 (0.613, 0.838) | 0.604 ± 0.067 (0.458, 0.720) |
| VAR | 0.554 ± 0.069 (0.405, 0.674) | 0.781 ± 0.052 (0.656, 0.864) | 0.842 ± 0.047 (0.721, 0.913) | 0.572 ± 0.069 (0.422, 0.692) |
| IDM | 0.542 ± 0.067 (0.399, 0.660) | 0.650 ± 0.066 (0.502, 0.761) | 0.748 ± 0.056 (0.618, 0.839) | 0.561 ± 0.073 (0.402, 0.687) |
| ENTR | 0.705 ± 0.064 (0.556, 0.810) | 0.837 ± 0.043 (0.729, 0.904) | 0.922 ± 0.029 (0.839, 0.963) | 0.756 ± 0.060 (0.614, 0.851) |
| CON | 0.598 ± 0.068 (0.447, 0.716) | 0.670 ± 0.065 (0.524, 0.779) | 0.761 ± 0.057 (0.625, 0.852) | 0.504 ± 0.070 (0.354, 0.629) |
| SUM AVER | 0.540 ± 0.071 (0.387, 0.663) | 0.802 ± 0.051 (0.676, 0.883) | 0.805 ± 0.052 (0.678, 0.885) | 0.557 ± 0.069 (0.406, 0.678) |
| SUM VAR | 0.540 ± 0.069 (0.392, 0.661) | 0.802 ± 0.049 (0.683, 0.880) | 0.855 ± 0.044 (0.741, 0.921) | 0.581 ± 0.068 (0.431, 0.699) |
| SUM ENTR | 0.608 ± 0.069 (0.455, 0.726) | 0.860 ± 0.039 (0.760, 0.920) | 0.917 ± 0.029 (0.836, 0.958) | 0.710 ± 0.063 (0.565, 0.813) |
| DIF AVER | 0.593 ± 0.068 (0.444, 0.711) | 0.677 ± 0.064 [0.531, 0.784) | 0.767 ± 0.054 [0.638, 0.854) | 0.558 ± 0.072 [0.401, 0.683) |
| DIF VAR | 0.592 ± 0.069 (0.441, 0.710) | 0.652 ± 0.067 (0.502, 0.764) | 0.763 ± 0.058 (0.624, 0.855) | 0.519 ± 0.070 (0.370, 0.642) |
| DIF ENTR | 0.538 ± 0.067 (0.393, 0.657) | 0.758 ± 0.057 (0.621, 0.850) | 0.846 ± 0.045 (0.732, 0.914) | 0.608 ± 0.071 (0.451, 0.729) |
| IMCA1 | 0.614 ± 0.068 (0.462, 0.730) | 0.485 ± 0.074 (0.327, 0.617) | 0.484 ± 0.068 (0.340, 0.606) | 0.486 ± 0.073 (0.330, 0.616) |
| IMCA2 | 0.656 ± 0.063 (0.515, 0.762) | 0.562 ± 0.068 (0.415, 0.681) | 0.670 ± 0.063 (0.528, 0.776) | 0.487 ± 0.072 (0.334, 0.615) |
SER, signal enhancement ratio; ASM, angular second moment; COR, correlation; VAR, variance; IDM, inverse difference moment; ENTR, entropy; CON, contrast; SUM AVER, sum average; SUM VAR, sum variance; SUM ENTR, sum entropy; DIF AVER, difference average; DIF VAR, difference variance; DIF ENTR, difference entropy; IMCA1, information measure of correlation 1; IMCA2, information measure of correlation 2.
aThe classification performance of texture features is presented by means of Az±SE (standard error) values and (lower, upper) asymmetric 95% confidence interval (CI) values.
Table 5 provides p-values (z-test) for classification performance comparison of texture features between lesion parametric maps; p-values less than the required level of significance indicate a statistically significant difference. Three (out of 14) features extracted from the SER map and two (out of 14) features extracted from the PIE map demonstrated statistically significant higher classification performance as compared with corresponding features extracted from the IE map (Tables 4 and 5). Most of the features extracted from the SER map performed better than the corresponding features extracted from the post-initial enhancement map, but without demonstrating statistically significant differences (Tables 4 and 5).
Table 5. The p-values (z-test) for classification performance comparison of texture features between lesion parametric mapsa.
| Feature |
IE versus PIE map |
IE versus SER map |
PIE versus SER map |
|||
| p-Value | Required a | p-Value | Required a | p-Value | Required a | |
| ASM | 0.0054 | 0.00079 | 0.0008 | 0.00068 | 0.0336 | 0.00109 |
| COR | 0.0004 | 0.00062 | 0.0067 | 0.00083 | 0.0748 | 0.00135 |
| VAR | 0.0145 | 0.00098 | 0.0008 | 0.00068 | 0.2257 | 0.00208 |
| IDM | 0.3066 | 0.00238 | 0.0256 | 0.00104 | 0.0484 | 0.00111 |
| ENTR | 0.0096 | 0.00088 | 0.0008 | 0.00069 | 0.0086 | 0.00086 |
| CON | 0.4745 | 0.00357 | 0.0731 | 0.00128 | 0.1237 | 0.00156 |
| SUM AVER | 0.0047 | 0.00076 | 0.0038 | 0.00074 | 0.7043 | 0.00500 |
| SUM VAR | 0.0039 | 0.00075 | 0.0002 | 0.00062 | 0.2468 | 0.00217 |
| SUM ENTR | 0.0002 | 0.00060 | 0.0001 | 0.00060 | 0.0748 | 0.00139 |
| DIF AVER | 0.4113 | 0.00312 | 0.0561 | 0.00114 | 0.1106 | 0.00147 |
| DIF VAR | 0.5626 | 0.00385 | 0.0584 | 0.00116 | 0.0622 | 0.00119 |
| DIF ENTR | 0.0170 | 0.00102 | 0.0002 | 0.00061 | 0.1209 | 0.00152 |
| IMCA1 | 0.1754 | 0.00185 | 0.2681 | 0.00227 | 0.9295 | 0.02500 |
| IMCA2 | 0.3981 | 0.00278 | 0.8883 | 0.01000 | 0.0127 | 0.00093 |
IE, initial enhancement; PIE, post-initial enhancement; SER, signal enhancement ratio; ASM, angular second moment; COR, correlation; VAR, Variance; IDM, inverse difference moment; ENTR, entropy; CON, contrast; SUM AVER, sum average; SUM VAR, sum variance; SUM ENTR, sum entropy; DIF AVER, difference average; DIF VAR, difference variance; DIF ENTR, difference entropy; IMCA1, information measure of correlation 1; IMCA2, information measure of correlation 2.
aThe required level of significance a is provided; p-values in bold indicate statistically significant differences.
Table 6 provides p-values (z-test) for classification performance comparison of texture features between lesion parametric maps and the first post-contrast frame lesion area; p-values less than the significance level indicate statistically significant differences. Texture features extracted from the SER map outperformed corresponding features extracted from the first post-contrast frame, demonstrating statistically significant difference in two (out of 14) features (Tables 4 and 6). Texture features extracted from the PIE map also outperformed corresponding features extracted from the first post-contrast frame, demonstrating statistically significant differences in two (out of 14) features (Tables 4 and 6). Most of the features extracted from the first post-contrast frame outperformed corresponding features extracted from the IE map, without demonstrating statistically significant differences (Tables 4 and 6).
Table 6. The p-values (z-test) for classification performance comparison of texture features between each lesion parametric map and first post-contrast frame lesion areaa.
| Feature |
First post-contrast frame versus IE map |
First post-contrast frame versus PIE map |
First post-contrast frame versus SER map |
|||
| p-Value | Required a | p-Value | Required a | p-Value | Required a | |
| ASM | 0.1815 | 0.00192 | 0.0656 | 0.00125 | 0.0061 | 0.00081 |
| COR | 0.4101 | 0.00294 | 0.0005 | 0.00066 | 0.0132 | 0.00094 |
| VAR | 0.8876 | 0.00833 | 0.0108 | 0.00089 | 0.0008 | 0.00067 |
| IDM | 0.8803 | 0.00714 | 0.3577 | 0.00263 | 0.0302 | 0.00106 |
| ENTR | 0.0623 | 0.00122 | 0.1252 | 0.00161 | 0.0066 | 0.00082 |
| CON | 0.4659 | 0.00333 | 0.0742 | 0.00132 | 0.0035 | 0.00072 |
| SUM AVER | 0.8960 | 0.01250 | 0.0005 | 0.00065 | 0.0004 | 0.00064 |
| SUM VAR | 0.7549 | 0.00556 | 0.0048 | 0.00077 | 0.0004 | 0.00063 |
| SUM ENTR | 0.0053 | 0.00078 | 0.0151 | 0.00100 | 0.0016 | 0.00070 |
| DIF AVER | 0.7861 | 0.00625 | 0.2085 | 0.00200 | 0.0144 | 0.00096 |
| DIF VAR | 0.5740 | 0.00417 | 0.1557 | 0.00167 | 0.0069 | 0.00085 |
| DIF ENTR | 0.5863 | 0.00454 | 0.1101 | 0.00143 | 0.0034 | 0.00071 |
| IMCA1 | 0.1653 | 0.00172 | 0.9923 | 0.05000 | 0.9199 | 0.01667 |
| IMCA2 | 0.1689 | 0.00179 | 0.3467 | 0.00250 | 0.0124 | 0.00091 |
IE, initial enhancement; PIE, post-initial enhancement; SER, signal enhancement ratio; ASM, angular second moment; COR, correlation; VAR, variance; IDM, inverse difference moment; ENTR, entropy; CON, contrast; SUM AVER, sum average; SUM VAR, sum variance; SUM ENTR, sum entropy; DIF AVER, difference average; DIF VAR, difference variance; DIF ENTR, difference entropy; IMCA1, information measure of correlation 1; IMCA2, information measure of correlation 2.
aThe required level of significance a is provided; p-values in bold indicate statistically significant differences.
A stepwise feature selection procedure [32] was employed to select one feature subset from each lesion parametric map and from the first post-contrast frame lesion area. Table 7 summarises classification performance of selected feature subsets by means of Az±SE values, and corresponding lower and upper asymmetric 95%CI values. The selected subset from the SER map (only entropy was included) outperformed statistically significantly selected subsets from the IE map (p = 0.0004 less than the required level of significance = 0.0083) and the first post-contrast frame (p = 0.0066 less than the required level of significance = 0.0125), and demonstrated a similar performance with the selected subset from PIE map (p = 0.5161). The selected subset from the PIE map performed statistically significantly (p = 0.0038 less than the required level of significance = 0.0100) better than the entropy feature from the first post-contrast frame, and statistically significantly (p = 0.0086 less than the required level of significance = 0.0167) better than the IE map subset. Finally, the selected subset from the IE map demonstrated a similar classification performance (p = 0.8635) to the entropy feature from the first post-contrast frame.
Table 7. Classification performance of selected feature subsets from each lesion parametric map and from the first post-contrast frame lesion areaa.
| Features included in selected subset | Az±SE | (Lower, upper) asymmetric 95% CI | |
| IE map | Entropy, sum average | 0.767 ± 0.053 | (0.641, 0.853) |
| PIE map | Sum entropy, sum average | 0.906 ± 0.032 | (0.818, 0.952) |
| SER map | Entropy | 0.922 ± 0.029 | (0.839, 0.963) |
| First post-contrast frame | Entropy | 0.756 ± 0.060 | (0.614, 0.851) |
IE, initial enhancement; PIE, post-initial enhancement; SER, signal enhancement ratio.
aThe classification performance of texture features is presented by means of Az±SE (standard error) values and (lower, upper) asymmetric 95% confidence interval (CI) values.
Discussion
Quantification of lesion enhancement kinetics heterogeneity for the differentiation of malignant from benign breast lesions has not been fully investigated. Previous studies in this area focused either on quantifying the heterogeneity of lesion enhancement kinetic parameters by means of first-order statistics analysis [14, 15, 20] or on quantifying the heterogeneity of lesions as depicted on a particular post-contrast time frame by means of GLCM-based texture analysis [16–19].
The current study focuses on quantifying lesion heterogeneity expressed on three enhancement kinetics parameters, namely IE, PIE and SER, by means of GLCM feature extraction. For this purpose, the three enhancement kinetics parameters were calculated in a pixel-wise fashion rendering three corresponding parametric maps. Heterogeneity of lesion parametric maps was quantified by means of GLCM features and their capability in discriminating malignant from benign lesions was investigated by means of an LSMD classifier. The discriminating ability of texture features extracted from the three parametric maps was further compared with the performance of corresponding texture features extracted from the first post-contrast frame lesion area.
Results have demonstrated that malignant lesions can be differentiated from benign ones by means of their increased heterogeneity expressed on the investigated enhancement kinetic parameter maps. GLCM-based features were capable of capturing such heterogeneity properties and, thus, can discriminate malignant from benign breast lesions. GLCM-based features extracted from the SER and PIE map demonstrated an increased discriminating ability as compared with corresponding features extracted from the initial enhancement map (Table 4). A similar trend was observed by considering classification based on selected feature subsets per parametric map (Table 7), with the selected subset from the SER map demonstrating similar classification performance to the selected subset from the PIE map (p = 0.5161) and outperforming statistically significantly the selected subset from the initial enhancement map (p = 0.0004).
The selected feature from the first post-contrast frame lesion area achieved a classification performance of 0.756 ± 0.060, ranging within previously reported performance values of GLCM features extracted from two-dimensional post-contrast data at a particular time frame [16–19]. This performance was statistically significantly lower than the performance of the selected feature subset from the SER (0.922 ± 0.029) and the PIE map (0.906 ± 0.032), and similar to the performance of the selected subset from the IE map (0.767 ± 0.053). The improved discriminating ability of SER and PIE map texture features, as compared with the IE map and first post-contrast frame features, is demonstrated in Figure 2. The fibroadenoma appears more heterogeneous on the initial enhancement map and the first post-contrast frame, whereas on the SER and post-initial enhancement maps the malignant lesion appears more heterogeneous.
A direct comparison with previously reported studies focusing on enhancement kinetics heterogeneity is not feasible, mainly because of differences in the data samples analysed (e.g. sample size, image acquisition protocols). However, the current study suggested the improved efficiency of quantifying lesion heterogeneity on the SER or the PIE map, by means of GLCM features, as compared with the quantification of lesion heterogeneity on two-dimensional post-contrast data of a single time frame, an approach previously adopted for the differentiation of breast lesions in DCE-MRI [16–19]. Furthermore, the proposed approach demonstrates a comparable performance with respect to the study quantifying lesion heterogeneity on exchange rate parameter maps using first-order statistics analysis [14].
As pixel-wise analysis of DCE-MRI data is sensitive to motion-induced errors, an image registration algorithm would be beneficial [36]. However, in the current study a median filtering was employed prior to the estimation of enhancement kinetic parameters as a means of reducing motion-induced noise [24]. The median filtering, by performing an edge-preserving smoothing, is not expected to alter significantly image texture, especially considering the small window size used; however, its exact effect on the discriminating power of the employed texture features is subject to future investigation.
Another limitation of the current study is the semi-automated technique adopted for lesion delineation. As the primary scope of the current work was to investigate the heterogeneity properties of lesions expressed on parametric maps, rather than providing a fully automated approach towards the diagnosis of breast lesions [37], automated lesion segmentation was not considered. Future efforts will consider automated three-dimensional lesion segmentation [38], which allows the investigation of three-dimensional texture features previously shown to improve breast tissue discrimination as compared with two-dimensional texture analysis approaches [15, 18].
Finally, in this study, GLCM-based features were used to quantify lesion heterogeneity with respect to three model-free derived enhancement kinetic parameters, indirectly related to tumour physiology. Exploiting GLCM texture analysis for quantifying lesion heterogeneity with respect to model-based enhancement kinetics parameters, which are directly related to tumour physiology, may further contribute to cancer diagnosis and the evaluation of anticancer therapy [13].
Conclusion
The current study demonstrated the capability of GLCM-based texture analysis in quantifying lesion heterogeneity expressed on enhancement kinetic parameter maps for differentiating malignant from benign breast lesions. Results suggested that texture features extracted from parametric maps that reflect lesion washout properties (PIE and SER map) can discriminate malignant from benign lesions more efficiently than texture features extracted from either the first post-contrast frame lesion area or from a parametric map that reflects lesion initial uptake (IE map).
Acknowledgments
This work was supported by the Caratheodory Programme (C.183) of the University of Patras, Greece.
References
- 1.Rankin SC. MRI of the breast. Br J Radiol 2000;73:806–18 [DOI] [PubMed] [Google Scholar]
- 2.Heywang-Kobrunner SH, Viehweg P, Heinig A, Kuchler C. Contrast-enhanced MRI of the breast: accuracy, value, controversies, solutions. Eur J Radiol 1997;24:94–108 [DOI] [PubMed] [Google Scholar]
- 3.Schnall MD, Ikeda DM. Lesion diagnosis working group report. J Magn Reson Imaging 1999;10:982–90 [PubMed] [Google Scholar]
- 4.Mann RM, Kuhl CK, Kinkel K, Boetes C. Breast MRI: guidelines from the European Society of Breast Imaging. Eur Radiol 2008;18:1307–18 [DOI] [PMC free article] [PubMed] [Google Scholar]
- 5.Kuhl CK, Mielcareck P, Klaschik S, Leutner C, Wardelmann E, Gieseke J, et al. Dynamic breast MR imaging: are signal intensity time course data useful for differential diagnosis of enhancing lesions? Radiology 1999;211:101–10 [DOI] [PubMed] [Google Scholar]
- 6.Kinkel K, Helbich TH, Esserman LJ, Barclay J, Schwerin EH, Sickles EA, et al. Dynamic high-spatial-resolution MR imaging of suspicious breast lesions: diagnostic criteria and interobserver variability. AJR Am J Roentgenol 2000;175:35–43 [DOI] [PubMed] [Google Scholar]
- 7.Szabó BK, Aspelin P, Wiberg MK, Boné B. Dynamic MR imaging of the breast. Analysis of kinetic and morphologic diagnostic criteria. Acta Radiol 2003;44:379–86 [DOI] [PubMed] [Google Scholar]
- 8.Eyal E, Degani H. Model-based and model-free parametric analysis of breast dynamic-contrast-enhanced MRI. NMR Biomed 2009;22:40–53 [DOI] [PubMed] [Google Scholar]
- 9.Mussurakis S, Buckley DL, Coady AM, Turnbull LW, Horsman A. Observer variability in the interpretation of contrast-enhanced MRI of the breast. Br J Radiol 1996;69:1009–16 [DOI] [PubMed] [Google Scholar]
- 10.Stoutjesdijk MJ, Fütterer JJ, Boetes C, van Die LE, Jager G, Barentsz JO. Variability in the description of morphologic and contrast enhancement characteristics of breast lesions on magnetic resonance imaging. Invest Radiol 2005;40:355–62 [DOI] [PubMed] [Google Scholar]
- 11.Liney GP, Gibbs P, Hayes C, Leach MO, Turnbull LW. Dynamic contrast-enhanced MRI in the differentiation of breast tumors: user-defined versus semi-automated region-of-interest analysis. J Magn Reson Imaging 1999;10:945–49 [DOI] [PubMed] [Google Scholar]
- 12.Collins DJ, Padhani AR. Dynamic magnetic resonance imaging of tumor perfusion. Approaches and biomedical challenges. IEEE Eng Med Biol Mag 2004;23:65–83 [DOI] [PubMed] [Google Scholar]
- 13.Jackson A, O'Connor JP, Parker GJ, Jayson GC. Imaging tumor vascular heterogeneity and angiogenesis using dynamic contrast-enhanced magnetic resonance imaging. Clin Cancer Res 2007;13:3449–59 [DOI] [PubMed] [Google Scholar]
- 14.Issa B, Buckley DL, Turnbull LW. Heterogeneity analysis of Gd-DTPA uptake: improvement in breast lesion differentiation. J Comput Assist Tomogr 1999;23:615–21 [DOI] [PubMed] [Google Scholar]
- 15.Ertaş G, Gülçür HO, Tunaci M. Improved lesion detection in MR mammography: three-dimensional segmentation, moving voxel sampling, and normalized maximum intensity-time ratio entropy. Acad Radiol 2007;14:151–61 [DOI] [PubMed] [Google Scholar]
- 16.Sinha S, Lucas-Quesada FA, DeBruhl ND, Sayre J, Farria D, Gorczyca DP, et al. Multifeature analysis of GD-enhanced MR images of breast lesions. J Magn Reson Imaging 1997;7:1016–26 [DOI] [PubMed] [Google Scholar]
- 17.Gibbs P, Turnbull LW. Textural analysis of contrast-enhanced MR images of the breast. Magn Reson Med 2003;50:92–8 [DOI] [PubMed] [Google Scholar]
- 18.Chen W, Giger ML, Li H, Bick U, Newstead GM. Volumetric texture analysis of breast lesions on contrast-enhanced magnetic resonance images. Magn Reson Med 2007;58:562–71 [DOI] [PubMed] [Google Scholar]
- 19.Nie K, Chen JH, Yu HJ, Chu Y, Nalcioglu O, Su MY. Quantitative analysis of lesion morphology and texture features for diagnostic prediction in breast MRI. Acad Radiol 2008;15:1513–25 [DOI] [PMC free article] [PubMed] [Google Scholar]
- 20.Chen W, Giger ML, Lan L, Bick U. Computerized interpretation of breast MRI: investigation of enhancement-variance dynamics. Med Phys 2004;31:1076–82 [DOI] [PubMed] [Google Scholar]
- 21.Breast ImagingReportingandDataSystem(BI-RADS)BreastImagingAtlas Reston, VA: American College of Radiology, 2003. [Google Scholar]
- 22.Woods BJ, Clymer BD, Kurc T, Heverhagen JT, Stevens R, Orsdemir A, et al. Malignant-lesion segmentation using 4D co-occurrence texture analysis applied to dynamic contrast-enhanced magnetic resonance breast image data. J Magn Reson Imaging 2007;25:495–501 [DOI] [PubMed] [Google Scholar]
- 23.Kale MC, Clymer BD, Koch RM, Heverhagen JT, Sammet S, Stevens R, et al. Multispectral co-occurrence with three random variables in dynamic contrast enhanced magnetic resonance imaging of breast cancer. IEEE Trans Med Imaging 2008;27:1425–31 [DOI] [PubMed] [Google Scholar]
- 24.Pediconi F, Catalano C, Venditti F, Ercolani M, Carotenuto L, Padula S, et al. Color-coded automated signal intensity curves for detection and characterization of breast lesions: preliminary evaluation of a new software package for integrated magnetic resonance-based breast imaging. Invest Radiol 2005;40:448–57 [DOI] [PubMed] [Google Scholar]
- 25.Baum F, Fischer U, Vosshenrich R, Grabbe E. Classification of hypervascularized lesions in CE MR imaging of the breast. Eur Radiol 2002;12:1087–92 [DOI] [PubMed] [Google Scholar]
- 26.Vassiou K, Kanavou T, Vlychou M, Poultsidi A, Athanasiou E, Arvanitis DL, et al. Characterization of breast lesions with CE-MR multimodal morphological and kinetic analysis: comparison with conventional mammography and high-resolution ultrasound. Eur J Radiol 2008:DOI:10.1016/j.ejrad.2008.01.012 [DOI] [PubMed] [Google Scholar]
- 27.Szabó BK, Aspelin P, Wiberg MK. Neural network approach to the segmentation and classification of dynamic magnetic resonance images of the breast: comparison with empiric and quantitative kinetic parameters. Acad Radiol 2004;11:1344–54 [DOI] [PubMed] [Google Scholar]
- 28.Esserman L, Hylton N, George T, Weidner N. Contrast-enhanced magnetic resonance imaging to assess tumor histopathology and angiogenesis in breast carcinoma. Breast J 1999;5:13–21 [DOI] [PubMed] [Google Scholar]
- 29.Collewet G, Strzelecki M, Mariette F. Influence of MRI acquisition protocols and image intensity normalization methods on texture classification. Magn Reson Imaging 2004;22:81–91 [DOI] [PubMed] [Google Scholar]
- 30.Haralick RM, Shanmugam K, Dinstein I. Textural features for image classification. IEEE Trans Syst Man Cybern 1973;SMC-3:610–21 [Google Scholar]
- 31.Ahmed N, Rao KR. Orthogonal transforms for digital signal processing. Berlin Heidelberg, New York: Springer-Verlag, 1975 [Google Scholar]
- 32.Erkel AR, Pattynama PM. Receiver operating characteristic (ROC) analysis: basic principles and applications in radiology. Eur J Radiol 1998;27:88–94 [DOI] [PubMed] [Google Scholar]
- 33.Draper N, Smith H. Applied regression analysis, 2nd edition, New York: John Wiley and Sons, 1981. [Google Scholar]
- 34.Sahiner B, Petrick N, Chan HP, Hadjiiski LM, Paramagul C, Helvie MA, et al. Computer-aided characterization of mammographic masses: accuracy of mass segmentation and its effects on characterization. IEEE Trans Med Imaging 2001;20:1275–84 [DOI] [PubMed] [Google Scholar]
- 35.Wright SP. Adjusted p-values for simultaneous inference. Biometrics 1992;43:1005–13 [Google Scholar]
- 36.Guo Y, Sivaramakrishna R, Lu CC, Suri JS, Laxminarayan S. Breast image registration techniques: a survey. Med Biol Eng Comput 2006;44:15–26 [DOI] [PubMed] [Google Scholar]
- 37.Behrens S, Laue H, Althaus M, Boehler T, Kuemmerlen B, Hahn HK, et al. Computer assistance for MR based diagnosis of breast cancer: present and future challenges. Comput Med Imaging Graph 2007;31:236–47 [DOI] [PubMed] [Google Scholar]
- 38.Chen W, Giger ML, Bick U. A fuzzy c-means (FCM)-based approach for computerized segmentation of breast lesions in dynamic contrast-enhanced MR images. Acad Radiol 2006;13:63–72 [DOI] [PubMed] [Google Scholar]