Abstract
The purpose of this study is to evaluate the role of diffusion-weighted imaging (DWI) in combination with T1 and T2 weighted MRI for the characterisation of renal carcinoma. The institutional review board approved the study protocols and waived informed consent from all of the patients. 47 patients (32 male and 15 female; age range, 21–85 years; median age, 65 years) who had suspected renal lesions on abdominal CT underwent MRI for further evaluation and characterisation of the lesions from April 2005 to August 2007 in our university hospital. A region of interest was drawn around the tumour area on apparent diffusion coefficient (ADC) maps. Final diagnosis was confirmed by histological examination of surgical specimens from all patients. The ADC value was significantly higher in renal cell carcinoma (RCC) than in transitional cell carcinoma (2.71±2.35 × 10⁻³ mm2 s−1 vs 1.61±0.80 × 10⁻³ mm2 s−1; p = 0.022). While analysing the histological subtypes of RCC, a significant difference in ADC values between clear cell carcinoma and non-clear cell carcinoma was found (1.59±0.55 × 10⁻³ mm2 s−1 vs 6.72±1.85 × 10⁻³ mm2 s−1; p = 0.0004). Similarly, ADC values of RCC revealed a significant difference between positive and negative metastatic lesions (1.06±0.38 × 10⁻³ mm2 s−1 vs 3.02±2.44 × 10⁻³ mm2 s−1; p = 0.0004), whereas intensity on T1 and T2 weighted imaging did not reach statistical significance. In conclusion, DWI has clinical value in the characterisation of renal carcinomas and could be applied in clinical practice for their management.
Renal cell carcinoma (RCC) is the most common primary malignant tumour of the kidney; it accounts for 2–3% of all adult cancers and is the sixth cause of death by tumour throughout the world. More than 80% of renal cancers that arise in the renal parenchyma are RCC, whereas the majority of renal pelvis cancers are transitional cell carcinomas (TCCs) [1–3]. The three most common subtypes of RCC are (i) clear cell carcinoma, one of the most common types, accounting for 70–80% of cases; (ii) papillary renal cell carcinoma, accounting for about 10–15% of cases; and (iii) chromophobe renal carcinoma, which is the least common, accounting for 5% of all RCCs. The annual rate of RCC diagnosis is increasing as a result of incidental detection by cross-sectional abdominal imaging of patients with suspected abdominal disorders. Increased detection rates carry a favourable prognosis; however, mortality from RCC has not decreased [2–4].
Diffusion-weighted imaging (DWI) is frequently used in cranial MRI studies and has shown potential for the characterisation of lesions such as acute cerebral infarctions, intracranial tumours, various infectious diseases and metabolic disorders [5–8]. The role of DWI is limited outside the central nervous system, owing to its inherent extreme sensitivity to motion, such as that related to respiration, peristalsis and artefacts, thus resulting in a high signal to noise ratio. With the development of advanced MR technology and the use of faster robust sequences, better quality has been obtained in abdominal imaging [9]. DWI with high b-values has been reported to have a high sensitivity for depicting malignant disease. Apparent diffusion coefficient (ADC) values of malignant hepatic, ovarian, breast, prostatic, colonic and uterine cervical tumours were lower than those of benign lesions or normal tissue [10–18].
Previous studies have suggested that patients with chromophobe and papillary RCC have a better prognosis than patients with clear cell RCC [19]. Accurate characterisation of patients with renal masses is essential to ensure appropriate clinical management, staging and prognosis. The clinical utility of ADC values in kidney disease has been reported: a higher value of ADC was noted in simple renal cysts and renal pelvis of hydronephrotic kidney, whereas a lower value was noted in solid renal tumours and kidneys with chronic and acute renal failure [9, 20–22]. The role of the ADC value in characterising the histological subtypes of renal carcinoma is limited [3, 9]. Therefore, the present study aimed to evaluate the role of DWI in combination with T1 and T2 weighted MRI for the differential diagnosis and characterisation of renal carcinoma.
Methods and materials
Patients
The institutional review board of Gunma University approved this retrospective study and waived informed consent from all of the patients. 57 consecutive patients who had suspected renal lesions on abdominal CT and underwent MRI for further evaluation and characterisation of these lesions from April 2005 to August 2007 in our university hospital, and who met the inclusion criteria, were selected from our database. The inclusion criteria are as follows: (i) histologically confirmed renal carcinoma; (ii) the availability of follow-up imaging examinations; and (iii) DWI had been obtained. 10 patients were excluded from this study because their lesions were diagnosed as being benign in pathology (n = 7) or they did not undergo histological examination (n = 3). Only 47 patients (32 male and 15 female; age range, 21–85 years; median age, 65 years), confirmed to have RCC (n = 32) or TCC (n = 15) by histological findings of surgical resection performed 1–2 weeks after the MRI study, were included in our study. RCC was further divided into clear cell carcinoma (n = 25), papillary carcinoma (n = 6) and chromophobe carcinoma (n = 1). For statistical analysis, papillary carcinoma and chromophobe carcinoma were considered as non-clear cell carcinoma (n = 7) because of the small number of cases. The tumour stage and disease grade were classified according to the sixth edition of the tumour, lymph node and metastasis (TNM) classification of the International Union Against Cancer [23].
MRI
MRI was performed on a 1.5 T unit (Symphony; Siemens Medical Systems, Erlangen, Germany) equipped with a body total imaging matrix array coil. The axial T1 weighted fast low angle shot (FLASH) gradient-echo images and turbo spin echo (SE) T2 weighted imaging parameters were as follows: repetition time/echo time (TR/TE), 195/7.49 ms and 4360/95 ms; slice thickness, 8 mm; matrix, 384 × 288; and field of view, 350 × 262 mm2. For morphological evaluation of the kidneys, transverse T1 weighted dual echo in-phase and out-of-phase sequences and transverse and coronal T2 weighted single-shot fast SE sequences were performed during the patient's breath-hold. An SE-type echo planner imaging (SE-EPI) sequence with chemical shift-selective (CHESS) pulse was used for DWI. The DWI parameters were as follows: TR/TE, 10000/86 ms; b-factor = 0 s mm–2, 300 s mm–2 and 1000 s mm–2 in three orthogonal directions; slice thickness, 8 mm; matrix, 128 × 75; field of view, 350 × 350 mm2; and pixel size, 2.7 × 4.7 mm. The scanning time of DWI was approximately 5 min and 30 s. The ADC values were calculated for each section automatically by using the imager software installed in our MR unit.
Image analysis
The images were presented in random order for interpretation by two radiologists (Y.T. and B.P., with working experience of more than 20 years and 5 years, respectively, in MRI of the abdomen) who knew that the patient had a renal tumour but were blinded to the results of other imaging. The final diagnosis was based on a consensus of the two observers. The ADC value was calculated manually by placing a region of interest (ROI) in the tumour. The ROI was chosen to include solid components of the tumour and was set as large as possible. However, the necrotic component, which was suggested from T1 and T2 weighted images, was not included in the ROI if possible. The signal intensity of the renal tumour was scored using a 5-point rating scale: 1 = very low signal; 2 = low signal; 3 = iso-intense signal; 4 = high signal; and 5 = very high signal when compared with normal renal cortex. These analyses were performed for DWI, T1 and T2 weighted images.
Statistical analysis
Data were expressed as the mean ± standard deviation. Spearman's rank correlations were computed between ADC values and tumour size. Differences in the variables were evaluated by the Kruskal–Wallis test, Mann–Whitney's non-parametric test or the χ2 test. Probability values of p<0.05 were considered statistically significant. All statistical calculations were performed using the StatView version 5.0 (SAS Institute NC, USA).
Results
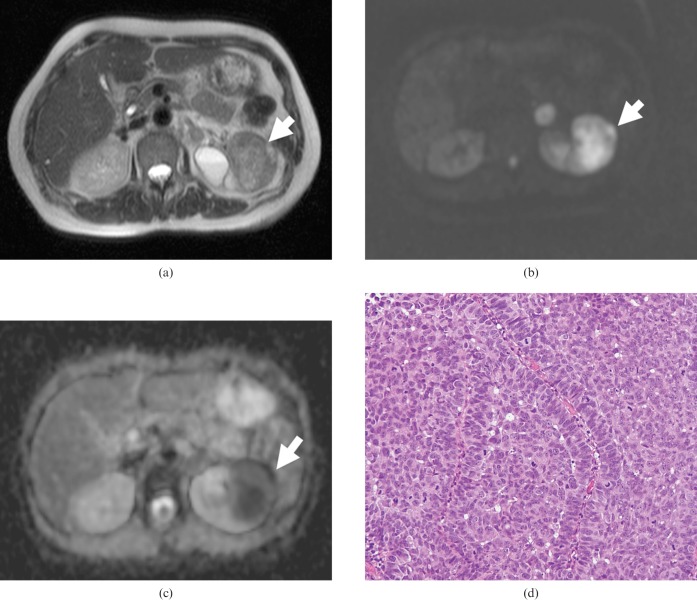
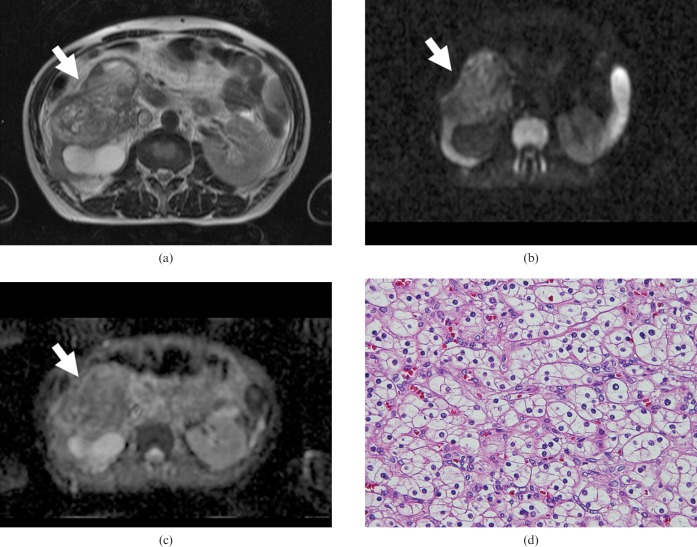
Table 1 shows the signal intensity on T1 and T2 weighted MR images of RCC and TCC, indicating that signal intensity could not be used to differentiate between TCC and RCC (Figures 1 and 2; p = 0.25 and p = 0.07, respectively).
Table 1. Signal intensity of T1 and T2 weighted MRI for RCC and TCC in 47 patients.
| Signal intensity | RCC |
TCC |
||
| T1 weighted images | T2 weighted images | T1 weighted images | T2 weighted images | |
| Low | 18 | 5 | 9 | 7 |
| Iso | 6 | 2 | 5 | 1 |
| High | 8 | 25 | 1 | 7 |
| Total | 32 | 32 | 15 | 15 |
p = 0.25 for T1 weighted images and p = 0.07 for T2 weighted images. Iso, iso-intense; RCC, renal cell carcinoma; TCC, transitional cell carcinoma.
Figure 1.
Transverse MR images of a 65-year-old woman with transitional cell carcinoma of the left kidney. (a) T2 weighted image showing a low-signal-intensity mass of the left kidney (arrow). (b) On DWI, the tumour showed very high signal intensity (arrow). (c) The apparent diffusion coefficient map shows the low ADC value (0.71 × 10⁻³ mm2 s) of the tumour (arrow). (d) Haematoxylin and eosin (H&E) staining confirmed the histological diagnosis of TCC. Densely packed solid tumour cells with hypercellularity were seen (original magnification, ×100).
Figure 2.
Transverse MR images of a 53-year-old man with clear cell carcinoma of the right kidney. (a) T2 weighted image showing a slightly high-signal-intensity mass lesion (arrow). (b) Transverse diffusion-weighted MR image showing slightly high signal intensity (arrow). (c) The apparent diffusion coefficient map shows the low ADC value (2.11 × 10⁻³ mm2 s) of the tumour (arrow). (d) Haematoxylin and eosin (H&E) staining of clear cell carcinoma shows large tumour cells with small round nuclei and plenty of clear cytoplasm. Note the intercellular space is very narrow compared with that in Figure 4d (original magnification, ×200).
The average ADC values were measured for all patients, and ranged from 0.71 to 8.79 × 10⁻³ mm2 s−1 (median, 1.66 × 10⁻³ mm2 s−1; mean, 2.48±2.36 × 10⁻³ mm2 s−1). The ADC value of RCC was higher than for TCC. A significant difference in the ADC value was observed between RCC and TCC (2.71±2.35 × 10⁻³ mm2 s−1 vs 1.61±0.80 × 10⁻³ mm2 s−1; p = 0.022; Figure 3).
Figure 3.
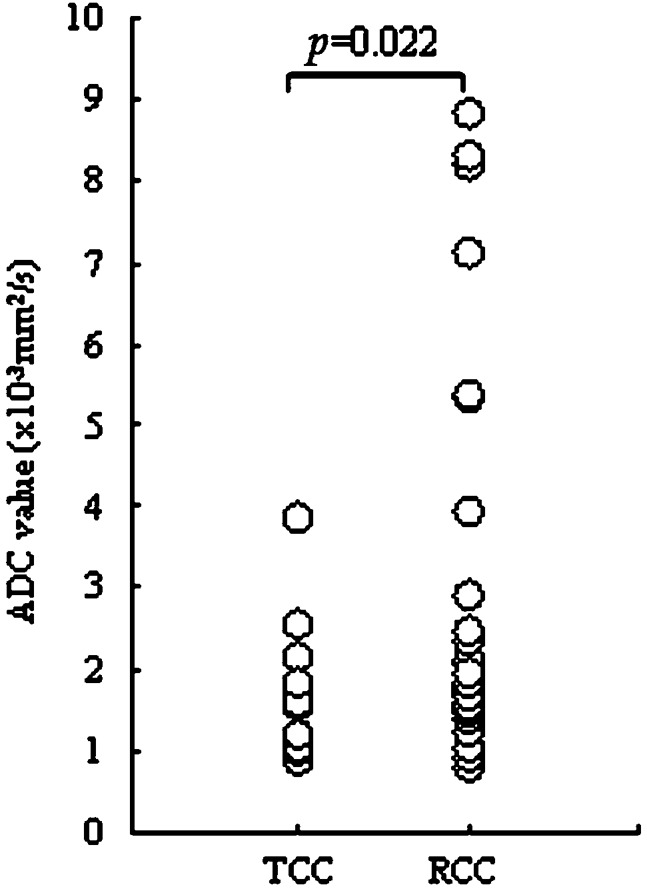
Apparent diffusion coefficient (ADC) values of transitional cell carcinoma (TCC) and renal cell carcinoma (RCC). ADC values were significantly higher in RCC than in TCC (p = 0.022).
We further analysed the histological pattern of RCC, which was divided into clear cell carcinoma and non-clear cell carcinoma (Figure 4). A significant difference in ADC values was observed between clear cell carcinoma and non-clear cell carcinoma (1.59±0.55 × 10⁻³ mm2 s−1 vs 6.72±1.85 × 10⁻³ mm2 s−1; p = 0.0004; Figure 5).
Figure 4.
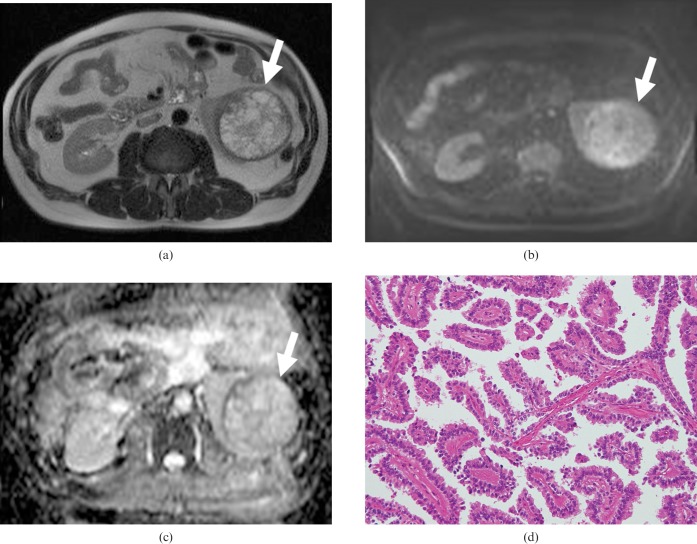
Transverse MR images of a 54-year-old man with papillary renal cell carcinoma of the left kidney. (a) T2 weighted image showing a high-signal-intensity mass lesion (arrow). (b) Transverse diffusion-weighted MR image showing high signal intensity (arrow). (c) The apparent diffusion coefficient map shows the low ADC value (2.51 × 10⁻³ mm2 s) of the tumour. (d) Haematoxylin and eosin (H&E) staining confirmed the histological diagnosis of papillary carcinoma of renal tumour. A distinct papillary structure is formed by single layers of tumour cells arranged around vascular stroma with wide intercellular spaces (original magnification, ×100).
Figure 5.
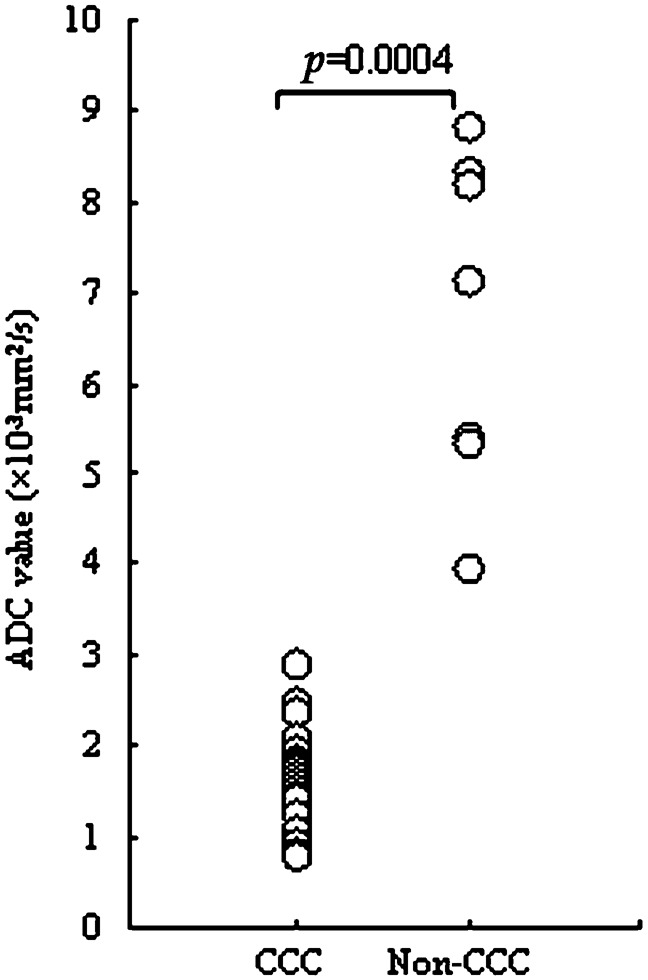
Relationship between the apparent diffusion coefficient (ADC) values for clear cell carcinoma (ccc) and non-clear cell carcinoma. A significant difference was noted in the ADC value between clear cell carcinoma and non-clear cell carcinoma (p = 0.0004).
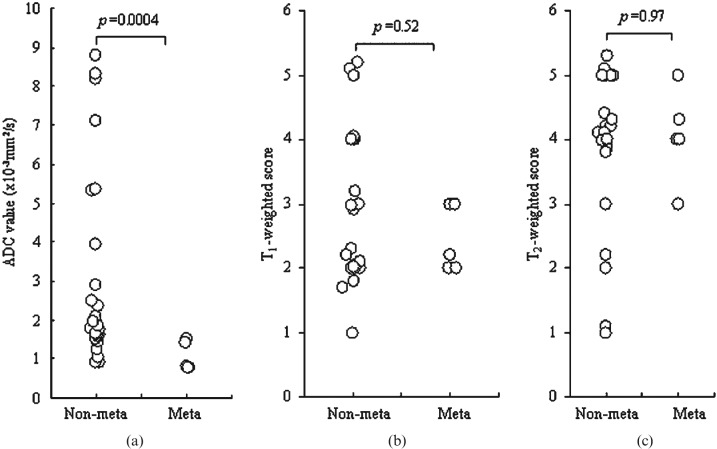
The ADC values, T1 weighted scores and T2 weighted scores were compared with the existence of distant metastasis of RCC in 32 patients. ADC values showed a significant difference between renal carcinoma with and without metastatic lesions (1.06±0.38 × 10⁻³ mm2 s−1 vs 3.02±2.44 × 10⁻³ mm2 s−1; p = 0.0004; Figure 6a), whereas scores of T1 and T2 weighted images were not associated with metastasis (Figure 6b,c).
Figure 6.
Comparison of distant metastasis of renal cell carcinoma in 32 patients with the apparent diffusion coefficient (ADC) value and T1 or T2 weighted scores. (a) The ADC value was significantly associated with the existence of metastasis (p = 0.0004). No association of distant metastasis (meta) was observed with (b) T1 weighted scores or (c) T2 weighted scores.
Table 2 shows the results of univariate analysis of ADC values and clinicopathological variables in all patients. ADC values were significantly correlated with tumour size (p = 0.027), histological differentiation of RCC and TCC (p = 0.022), lymph node metastasis (p = 0.004) and distant metastasis (p = 0.003).
Table 2. Association of ADC values and clinicopathological variables in 47 patients with renal carcinoma.
| Variables | Total | ADC (mean±SD) (×10−3 mm2 s−1) | p-value |
| ADC (median, 1.66×10⁻³ mm2 s−1; range, 0.71–8.79×10⁻³ mm2 s−1 | 47 | 2.48±2.36 | |
| Age (median, 65 years; range, 21–85 years) | 47 | 63.2±14.4a | 0.48 |
| Gender | |||
| Male | 32 | 2.21±1.87 | |
| Female | 15 | 2.68±2.43 | 0.67 |
| Tumour location | |||
| left kidney | 23 | 1.83±0.93 | |
| right kidney | 24 | 2.87±2.65 | 0.79 |
| Tumour size (median, 3.47 cm; range, 0.6–13 cm) | 47 | 39.01±27.74b | 0.027 |
| Histology | |||
| TCC | 15 | 1.61±0.80 | |
| RCC | 32 | 2.71±2.35 | 0.022 |
| CCC | 25 | 1.59±0.55 | |
| Non-CCC | 7 | 6.72±1.85 | 0.0004 |
| T status | |||
| T1 | 29 | 2.88±2.44 | |
| T2 | 4 | 1.96±0.42 | |
| T3 | 10 | 1.27±0.44 | |
| T4 | 4 | 1.67±0.65 | 0.09 |
| Lymph node metastasis | |||
| Absent | 37 | 2.67±2.21 | |
| Present | 10 | 1.23±0.44 | 0.004 |
| Distant metastasis | |||
| Absent | 42 | 2.61±2.15 | |
| Present | 5 | 1.05±0.39 | 0.003 |
| Tumor grade | |||
| I | 21 | 2.45±2.08 | |
| II | 13 | 3.18±2.54 | |
| III | 7 | 1.74±0.98 | |
| IV | 6 | 1.02±0.35 | 0.06 |
ADC, apparent diffusion coefficient; CCC, clear cell carcinoma; RCC, renal cell carcinoma; SD, standard deviation; TCC, transitional cell carcinoma.
aMean age in year.
bMean tumour size (in cm).
Discussion
The present study demonstrated that the ADC value was significantly higher for RCC than for TCC. Histologically, TCC is composed of solid and densely packed tumour with hypercellularity compared with RCC, as shown in Figures 1d and 2d. RCC is usually composed of haemorrhage, necrosis and a cystic area, with only a tiny solid component. These might have contributed to the high ADC value in RCC. The presence of necrosis results in higher ADC values than in non-necrotic tumours, and solid tumours have lower ADC values than do cystic tumours [9, 24]. However, in our study, we excluded the necrotic area from the ROI analysis. T1 weighted images show that, in RCC, central necrosis is common and is typically seen as a homogeneous hypointense area in the centre of the mass, whereas usually moderate to high signal intensity is observed in T2 weighted images. TCC of the kidney originates from the renal pelvis. However, radiological differentiation of TCC and RCC is sometimes difficult because of the spectrum of histological characteristics, such as differentiation, vascularity and cellularity.
The present study further explored how the ADC value was significantly lower in clear cell carcinoma than in non-clear cell carcinoma. Indeed, the differences in cellularity may have resulted in the variation in ADC values between clear cell carcinoma and non-clear cell carcinoma. Histologically, clear cell carcinoma is composed of large tumour cells with abundant clear cytoplasm (Figure 2d) and very narrow intercellular space, which might have restricted the water movement and resulted in low ADC values, whereas non-clear cell carcinoma is composed of tumour cells with lesser cellularity and wider intercellular spaces than those of clear cell carcinoma (Figure 4d). Clear cell carcinoma is characterised by the presence of signal intensity similar to that of the renal parenchyma on T1 weighted images and increased signal intensity on T2 weighted images [4]. A previous study by Beck et al [19] reported that clear cell carcinoma was associated with a poorer prognosis than either papillary or chromophobe RCC. To the best of our knowledge, this is the first report which has explored how a low ADC value is associated with the narrow intercellular space in renal carcinoma.
Previously, Müller et al [21] reported an ADC value for normal renal parenchyma of between 2.88±0.65 ×10⁻³ mm2 s−1 and 3.56±0.32 × 10⁻³ mm2 s−1; other studies have reported similar values [20–22]. Recently, Manenti et al [3] reported that the mean ADC value in normal parenchyma of healthy subjects was 2.35±0.31 × 10⁻³ mm2 s−1, whereas that of healthy parenchyma of patients with focal lesions was 2.27±0.29 × 10⁻³ mm2 s−1. The ADC value in focal renal lesions was 1.72±0.21 × 10⁻³ mm2 s−1, which is lower than that in our findings (2.48±2.36 ×10⁻³ mm2 s−1), whereas the ADC value of clear cell carcinoma and TCC in their study is consistent with our present study. In another study by Lin et al [25], the ADC value in the primary tumour was the same as that in the invaded lymph nodes. However, in our present study, primary renal carcinoma with metastasis had significantly lower ADC values than that without metastasis. The tumours with metastatic lesions may be aggressive with high cellularity, and have restricted movements of water molecules, resulting in low ADC values. The ADC value, therefore, may be used as a differentiating parameter for characterising the metastatic potential of renal tumours. In our study, ADC values were associated with different clinicopathological variables, indicating that the ADC value may have clinical importance as a non-invasive procedure with which to predict malignant potential, such as distant metastasis in renal carcinoma.
An earlier study by Zhang et al [9] reported that T1 hyperintensity was associated with lower ADC values. However, T1 signal intensity did not show any significant association with ADC values in the present study. This discrepancy might be a result of the different patient population, differential criteria of the T1 scoring system and the comparison between benign and malignant tissue ADC values and T1 signal used in the former report.
There are several areas of expansion in the present study. Diffusion sequences are generally sensitive to motion and susceptibility artefacts and yield a limited signal to noise ratio. Our study did not include benign renal lesions, which limited the use of ADC values for differentiating benign from malignant lesions; the study was also retrospective in nature and had relatively fewer cases for histological characterisation. Further studies with larger populations are warranted to elucidate the role of ADC values in renal tumours.
In conclusion, the present study demonstrated the potential utility of DWI in the differential diagnosis of renal tumours and further explored the value of DWI in predicting malignant potential. Therefore, in clinical practice, patients with low ADC values should be examined extensively for the possibility of distant metastatic lesions in renal carcinoma.
Acknowledgments
This work was supported by grants from the Ministry of Education, Culture, Sports, Science and Technology of Japan, and the 21st Century Center of Excellence (COE) program of Gunma University. Dr B Paudyal is a postdoctoral fellow supported by the Japanese Society for the Promotion of Sciences (JSPS).
References
- 1.Ng CS, Wood CG, Silverman PM, Tannir NM, Tamboli P, Sandler CM. Renal cell carcinoma: diagnosis, staging, and surveillance. AJR Am J Roentgenol 2008;191:1220–32 [DOI] [PubMed] [Google Scholar]
- 2.Dyer R, DiSantis DJ, McClennan BL. Simplified imaging approach for evaluation of the solid renal mass in adults. Radiology 2008;247:331–42 [DOI] [PubMed] [Google Scholar]
- 3.Manenti G, Di Roma M, Mancino S, Bartolucci DA, Palmieri G, Mastrangeli R, et al. Malignant renal neoplasms: correlation between ADC values and cellularity in diffusion weighted magnetic resonance imaging at 3T. Radiol Med 2008;113:199–213 [DOI] [PubMed] [Google Scholar]
- 4.Pedrosa I, Sun MR, Spencer M, Genega EM, Olumi AF, Dewolf WC, et al. MR imaging of renal masses: correlation with findings at surgery and pathologic analysis. RadioGraphics 2008;28:985–1003 [DOI] [PubMed] [Google Scholar]
- 5.Takahara T, Imai Y, Yamashita T, Yasuda S, Nasu S, Van Cauteren M. Diffusion-weighted whole body imaging with background body signal suppression (DWIBS): technical improvement using free breathing, STIR and high resolution 3D display. Radiat Med 2004;22:275–82 [PubMed] [Google Scholar]
- 6.Byun WM, Shin SO, Chang Y, Lee SJ, Finsterbusch J, Frahm J. Diffusion-weighted MR imaging of metastatic disease of the spine: assessment of response to therapy. AJNR Am J Neuroradiol 2002;23:906–12 [PMC free article] [PubMed] [Google Scholar]
- 7.Koh DM, Collins DJ. Diffusion-weighted MRI in the body: applications and challenges in oncology. AJR Am J Roentgenol 2007;188:1622–35 [DOI] [PubMed] [Google Scholar]
- 8.Chuah KC, Stuckey SL, Berman IG. Silent embolism in diagnostic cerebral angiography: detection with diffusion—weighted imaging. Australas Radiol 2004;48:133–8 [DOI] [PubMed] [Google Scholar]
- 9.Zhang J, Tehrani YM, Wang L, Ishill NM, Schwartz LH, Hricak H. Renal masses: characterization with diffusion-weighted MR imaging — a preliminary experience. Radiology 2008;247:458–64 [DOI] [PubMed] [Google Scholar]
- 10.Tsushima Y, Takano A, Taketomi-Takahashi A, Endo K. Body diffusion-weighted MR imaging using high b-value for malignant tumor screening: usefulness and necessity of referring to T2-weighted images and creating fusion images. Acad Radiol 2007;14:643–50 [DOI] [PubMed] [Google Scholar]
- 11.Tanimoto A, Nakashima J, Kohno H, Shinmoto H, Kuribayashi S. Prostate cancer screening: the clinical value of diffusion-weighted imaging and dynamic MR imaging in combination with T2-weighted imaging. J Magn Reson Imaging 2007;25:146–52 [DOI] [PubMed] [Google Scholar]
- 12.Matsuki M, Inada Y, Tatsugami F, Tanikake M, Narabayashi I, Katsuoka Y. Diffusion-weighted MR imaging for urinary bladder carcinoma: initial results. Eur Radiol 2007;17:201–4 [DOI] [PubMed] [Google Scholar]
- 13.Yamada I, Aung W, Himeno Y, Nakagawa T, Shibuya H. Diffusion coefficients in abdominal organs and hepatic lesions: evaluation with intravoxel incoherent motion echo-planar MR imaging. Radiology 1999;210:617–23 [DOI] [PubMed] [Google Scholar]
- 14.Lin G, Ho KC, Wang JJ, Ng KK, Wai YY, Chen YT, et al. Detection of lymph node metastasis in cervical and uterine cancers by diffusion-weighted magnetic resonance imaging at 3T. J Magn Reson Imaging 2008;28:128–35 [DOI] [PubMed] [Google Scholar]
- 15.Matsushima N, Maeda M, Takamura M, Takeda K. Apparent diffusion coefficients of benign and malignant salivary gland tumors. Comparison to histopathological findings. J Neuroradiol 2007;34:183–9 [DOI] [PubMed] [Google Scholar]
- 16.Woodhams R, Matsunaga K, Iwabuchi K, Kan S, Hata H, Kuranami M, et al. Diffusion-weighted imaging of malignant breast tumors: the usefulness of apparent diffusion coefficient (ADC) value and ADC map for the detection of malignant breast tumors and evaluation of cancer extension. J Comput Assist Tomogr 2005;29:644–9 [DOI] [PubMed] [Google Scholar]
- 17.Nakanishi K, Kobayashi M, Nakaguchi K, Kyakuno M, Hashimoto N, Onishi H, et al. Whole-body MRI for detecting metastatic bone tumor: diagnostic value of diffusion-weighted images. Magn Reson Med Sci 2007;6:147–55 [DOI] [PubMed] [Google Scholar]
- 18.Nakayama T, Yoshimitsu K, Irie H, Aibe H, Tajima T, Nishie A, et al. Diffusion-weighted echo-planar MR imaging and ADC mapping in the differential diagnosis of ovarian cystic masses: usefulness of detecting keratinoid substances in mature cystic teratomas. J Magn Reson Imaging 2005;22:271–8 [DOI] [PubMed] [Google Scholar]
- 19.Beck SD, Patel MI, Snyder ME, Kattan MW, Motzer RJ, Reuter VE, et al. Effect of papillary and chromophobe cell type on disease-free survival after nephrectomy for renal cell carcinoma. Ann Surg Oncol 2004;11:71–7 [DOI] [PubMed] [Google Scholar]
- 20.Cova M, Squillaci E, Stacul F, Manenti G, Gava S, Simonetti G, et al. Diffusion-weighted MRI in the evaluation of renal lesions: preliminary results. Br J Radiol 2004;77:851–7 [DOI] [PubMed] [Google Scholar]
- 21.Müller MF, Prasad PV, Bimmler D, Kaiser A, Edelman RR. Functional imaging of the kidney by means of measurement of the apparent diffusion coefficient. Radiology 1994;193:711–15 [DOI] [PubMed] [Google Scholar]
- 22.Namimoto T, Yamashita Y, Mitsuzaki K, Nakayama Y, Tang Y, Takahashi M. Measurement of the apparent diffusion coefficient in diffuse renal disease by diffusion-weighted echo-planar MR imaging. J Magn Reson Imaging 1999;9:832–7 [DOI] [PubMed] [Google Scholar]
- 23.Sobin LH, Wittekind C, eds TNM: Classification of Malignant Tumors. 6th edn. New York, NY: Wiley, 2002 [Google Scholar]
- 24.King AD, Ahuja AT, Yeung DK, Fong DK, Lee YY, Lei KI, et al. Malignant cervical lymphadenopathy: diagnostic accuracy of diffusion-weighted MR imaging. Radiology 2007;245:806–13 [DOI] [PubMed] [Google Scholar]
- 25.Lin G, Ho KC, Wang JJ, Ng KK, Wai YY, Chen YT, et al. Detection of lymph node metastasis in cervical and uterine cancers by diffusion-weighted magnetic resonance imaging at 3T. J Magn Reson Imaging 2008;28:128–35 [DOI] [PubMed] [Google Scholar]


