Abstract
Objectives
CT is a valuable tool in diagnostic radiology but it is also associated with higher patient radiation doses compared with planar radiography. The aim of this article is to review patient dose for the most common types of CT examinations reported during the past 19 years.
Methods
Reported dosimetric quantities were compared with the European diagnostic reference levels (DRLs). Effective doses were assessed with respect to the publication year and scanner technology (i.e. single-slice vs multislice).
Results
Considerable variation of reported values among studies was attributed to variations in both examination protocol and scanner design. Median weighted CT dose index (CTDIw) and dose length product (DLP) are below the proposed DRLs; however, for individual studies the DRLs are exceeded. Median reported effective doses for the most frequent CT examinations were: head, 1.9 mSv (0.3–8.2 mSv); chest, 7.5 mSv (0.3–26.0 mSv); abdomen, 7.9 mSv (1.4–31.2 mSv); and pelvis, 7.6 mSv (2.5–36.5 mSv).
Conclusion
The introduction of mechanisms for dose reduction resulted in significantly lower patient effective doses for CT examinations of the head, chest and abdomen reported by studies published after 1995. Owing to the limited number of studies reporting patient doses for multislice CT examinations the statistical power to detect differences with single-slice scanners is not yet adequate.
The use of CT in medicine is now firmly established and represents one of the most important radiological procedures performed worldwide. A consequence of the wide adoption of CT in clinical practice is that radiation dose from CT is growing as a component of the total radiation dose received by patients and the general population [1,2]. Data from various national surveys have proved that CT is a major source of radiation exposure and provides a substantial proportion of the collective dose from medical exposure, e.g. approximately 35% in Germany [3] and 47% in the UK [4]. The introduction of faster multislice and dual source CT technology has allowed cardiac CT, large-volume high-resolution CT and improved z-plane resolution [5-8]. The speed and ease of CT imaging and the ambition to obtain quality images and cover larger areas of the patient's anatomy can lead to increased patient doses; although technological developments provide the opportunity to decreases individual CT doses [9]. Patient radiation dose owing to CT examination is expected to be highly variable because of the use of different imaging protocols and the intrinsic differences among makes and models of CT scanners [10,11]. To limit radiation exposure arising from CT procedures to as low as reasonably achievable (ALARA), European guidelines on quality criteria were published and specific diagnostic reference levels (DRLs) were proposed for routine CT examinations [12]. The purpose of this study is to review published literature on patient radiation doses from common non-cardiac CT examinations, to compare findings with DRLs, to identify whether patient doses are reduced or increased for newer studies and to comment on the impact of multislice technology on patient doses.
CT dosimetry
CT dosimetry differs radically from conventional planar radiography and fluoroscopy dosimetry. In CT scanning the X-ray beam rotates around the patient and it is not straightforward how the radiation dose is distributed on the surface and inside of the patient [13]. CT dosimetry is performed with physical cylindrical phantoms, which contain several openings for insertion of dosemeters [14]. Measurements are typically performed with pencil ionization chambers with an active length of 100 mm inserted into the phantom openings. The measured quantity is called the CT dose index (CTDI) or more precisely CTDI100 when the ionization chamber has an active length of 100 mm. This is defined as the integral along a line parallel to the axis of rotation (z) of the dose profile (D(z)) for a single slice, divided by the nominal slice thickness T [15]:
 |
(1) |
CTDI is measured in milligrays. CTDI measured at different locations and depths in a dosimetry phantom differ. To establish an “average” CT dose index that can be used as single-number indicator of radiation dose to a patient the “weighted” CTDI was introduced and is defined as [13]:
 |
(2) |
To calculate CTDIw, CTDI is acquired at the centre (CTDIcentre) and at the periphery of the phantom at a 1 cm depth (CTDIperiphery). To account for helical doses and axial doses when slice spacing I differs from slice thickness (n × T) (where n is the number of slices and T is the slice thickness) the indicator CTDIvolume is often used [13]:
 |
(3) |
CTDIvolume spreads the dose corresponding to CTDIw over a longer or shorter z-axis length of tissue depending on the ratio  [16]. CT dose indices are estimates of the average radiation dose only in the irradiated volume and are independent of the scan length. Therefore, to assess the total amount of radiation deposited in the patient and determine the risk from ionizing radiation, the dose length product (DLP) has been proposed. The DLP is proportional to the total deposited energy and is given by [17]:
| (4) |
where L is the total scan length. DLP is measured in milligray-centimetres and it increases with an increase in total scan length or with variables that affect the CTDIw (e.g. tube current or voltage) or the CTDIvolume (e.g. pitch). In clinical practice CTDIvolume and DLP are displayed at the operation console of most CT units. Despite its proportional relationship to total deposited energy, DLP cannot be routinely used as a risk indicator because it does not take into account the radiosensitivity of the organs within the irradiated body area. For this purpose the concept of effective dose (ED) has been introduced by the International Commission on Radiological Protection [18]. Effective dose can be used for comparing doses from different diagnostic and therapeutic procedures and for comparing the use of similar technologies and procedures in different hospitals and countries as well as from use of different technologies for the same medical examinations [19]. However, for planning the exposure of patients and risk-benefit assessments, the equivalent dose or the absorbed dose to irradiated tissues is the more relevant quantity. The European Commission has proposed DRLs for the dose descriptors CTDIw and DLP for routine CT examination at the European guidelines on quality criteria for CT [12]. The introduction of DRLs provides the baseline information for subsequent dose reduction or optimisation.
Methods
Literature was accessed through PubMed and Scopus (1991 to November 2009) using the terms “computed tomography”, “dose”, “radiation dose” and “patient dose”. Additional papers were identified by cross-referencing bibliographies of retrieved articles. The search was limited to studies involving adult humans and dosimetric results were extracted for the most common types of non-cardiac CT examination of the head, chest, abdomen, pelvis, spine (cervical, thoracic and lumbar) and abdomen-pelvis. Dosimetric quantities assessed included CTDIw, DLP, ED and organ dose. Reported values were extracted to define median and range for each dose descriptor per type of examination. Reported CTDIw and DLP values were compared with the corresponding DRLs. ED and their variations among studies were assessed with respect to publication year and CT scanner technology (i.e single-slice vs multislice).
Statistical analysis
Data normality was analysed using the Kolmogorov-Smirnov test. Examined variables did not follow the normal distribution; therefore results are presented as median and range. Accordingly, differences between variables were analysed using non-parametric tests, i.e. the Mann–Whitney U-test was used to analyse differences between two groups and the Kruskal-Wallis test was used to analyse differences between more than two groups. A p-value <0.05 was considered statistically significant. Data were analysed using SPSS for Windows version 13.0 (SPSS, Inc., Chicago, IL).
Results
Dosimetric data for the most common CT examinations of the head and trunk were collected from 42 studies (Table 1). Reported dosimetric quantities varied among studies with ED being the dose descriptor most frequently quoted (Table 2). The derivation of reported dosimetric quantities also varied between studies after the following methodologies were employed: 1, the measurement in physical anthropomorphic phantoms of organ doses using suitably calibrated thermoluminescent or silicon photodiode dosemeters. Based on these measurements effective doses were calculated using appropriate organ/tissue weighting factors; 2, the CTDI and DLP values reported at the console display of the CT scanner were assessed and averaged for a patient cohort and ED were calculated by multiplying CTDI and DLP with appropriate conversion coefficients such as those given in the EUR 16262 document [12]; and 3, the scanning parameters and scanner specific CTDI data were fed into Monte Carlo based applications such as the ImPACT CT dosimetry calculator (St George's Healthcare, London, UK) [20], CT Dose [21], CT Expo [22] and WinDose [23] to obtain organ doses, CTDIw, DLP and effective doses.
Table 1. CT examinations and corresponding number of studies reporting patient doses.
| Examination | Number of studies |
| Head | 32 |
| Chest | 36 |
| Abdomen | 34 |
| Pelvis | 23 |
| Cervical spine | 10 |
| Thoracic spine | 7 |
| Lumbar spine | 19 |
| Abdomen-pelvis | 6 |
Table 2. Dose descriptors and corresponding number of studies reporting each.
| Quantity | Number of studies |
| CTDIw | 17 |
| DLP | 19 |
| Organ doses | 15 |
| Effective dose | 32 |
CTDIw, weighted CT dose index.
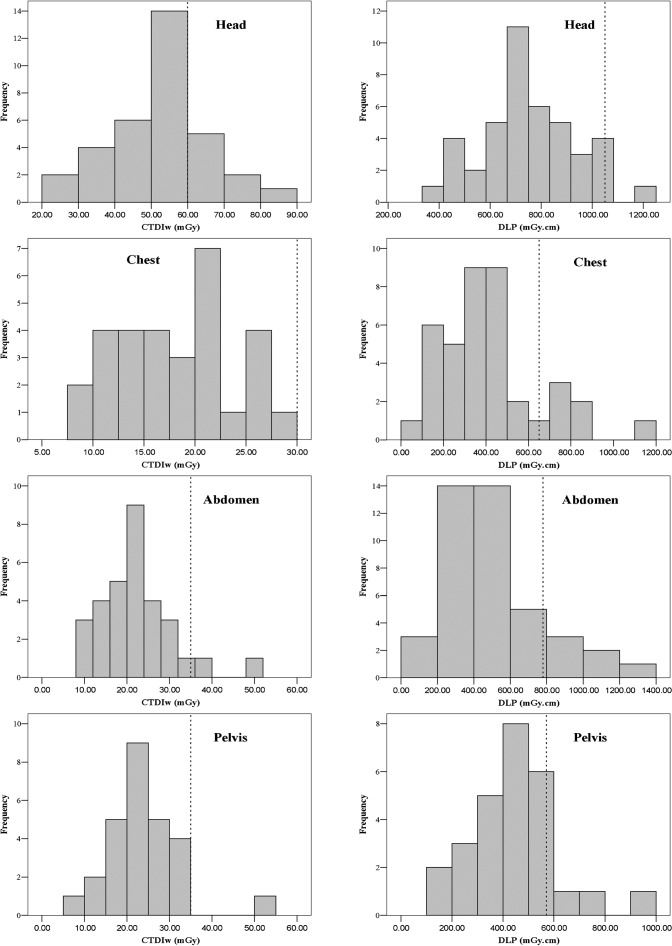
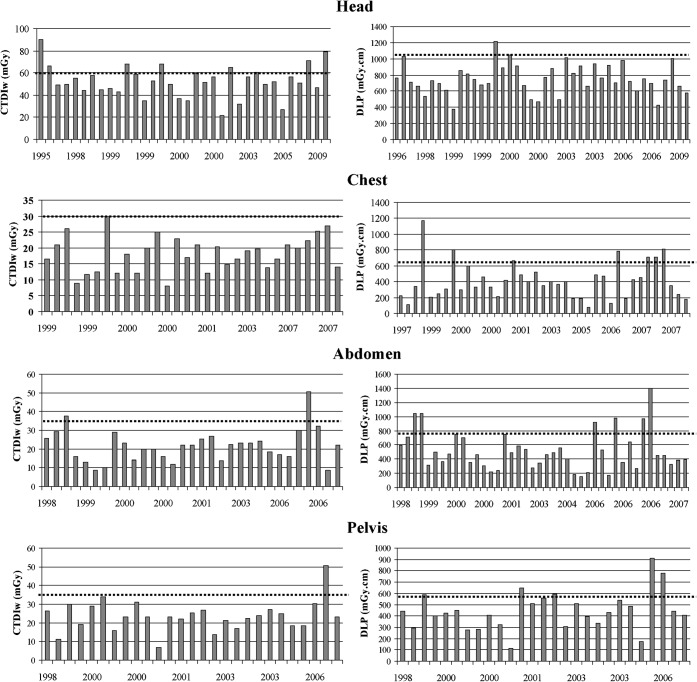
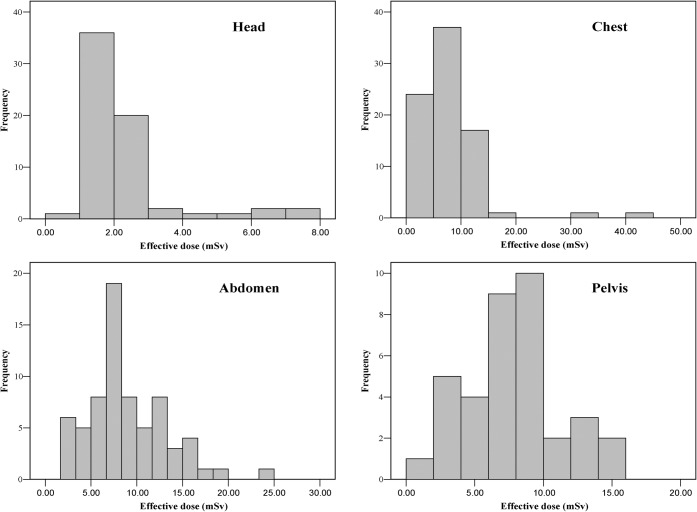
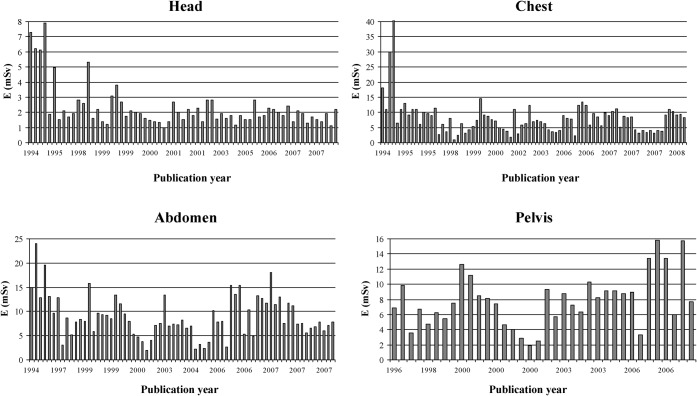
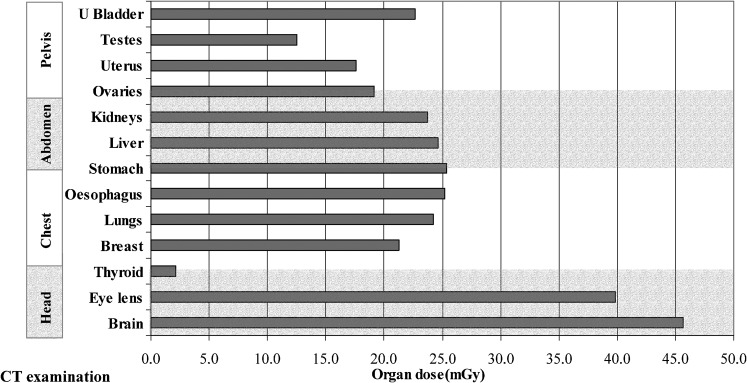
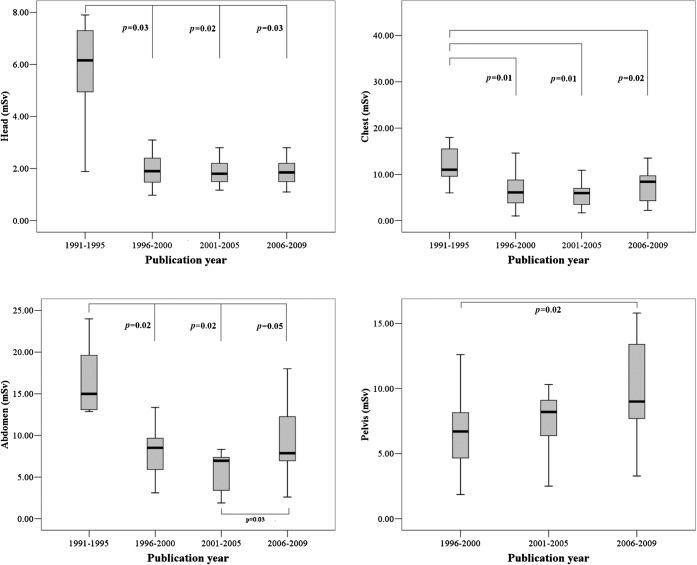
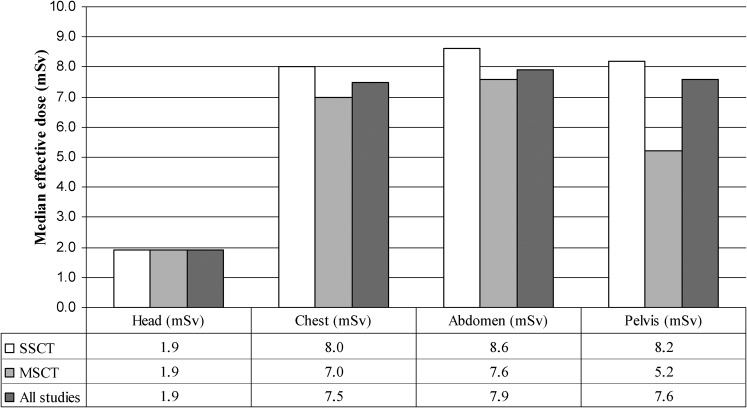
Median and range of CTDIw and DLP per type of examination are given in Tables 3 and 4 together with the corresponding DRLs. Figure 1 shows the frequency of reported CTDIw and DLP values for the most common types of CT examinations and Figure 2 shows the reported CTDIw and DLP values from individual studies sorted by publication year. Median and range of ED per type of examination are given in Table 5. Figure 3 shows the frequency of reported ED values for the most common types of CT examinations and Figure 4 shows the ED from individual studies sorted by publication year. Finally, median reported organ doses per type of examination are presented in Figure 5. To identify whether patient doses are reduced or increased in newer studies, reported results were divided into the following time periods according to publication year: 1991–1995, 1996–2000, 2001–2005 and 2005–2009 (Figure 6). ED for head and chest CT examinations were found to be significantly higher for studies published during the earliest considered period (1991–1995) compared with more recent studies (p<0.05), while there was no statistically significant difference between studies published during the latest three periods (1999–2009). ED for abdomen CT examinations were also found to be significantly higher for the studies published during the earliest period considered (1991–1995) compared with more recent studies (p≤0.05). Additionally, ED for abdomen reported by the most recent studies (2006–2009) were found to be significantly higher than those reported during the preceding period (2001–2005) (p = 0.03). Finally, results for the pelvis CT examinations for the earliest period were not available and the reported ED for the pelvis in the most recent studies (2006–2009) were found to be significantly higher that those reported during the period 1996–2000 (p = 0.02). Figure 7 presents ED for the most common types of CT examinations by studies on single-slice and multislice scanners. The reported values for multislice scanners refer to units that acquire from 2 up to 256 slices per rotation. Median ED for multislice CT are equal or lower than those of single-slice CT. However, statistical analysis revealed that owing to the limited number of studies reporting patient doses for non-cardiac examinations with multislice CT there is no adequate statistical power to detect any significant differences between multislice CT and single-slice CT for the assessed CT scan examinations.
Table 3. Reported values of weighted CT dose index (CTDIw ) and corresponding diagnostic reference level (DRL).
| CT examination | Median CTDIw (mGy) | CTDIw range (mGy) | DRL (mGy) [12] |
| Head | 52.0 | 17.0–181.0 | 60 |
| Chest | 18.6 | 3.0–86.0 | 30 |
| Abdomen | 22.0 | 4.0–166.9 | 35 |
| Pelvis | 23.0 | 4.0–107.4 | 35 |
| Cervical spine | 44.3 | 5.3–103.2 | |
| Lumbar spine | 30.3 | 10.6–59.7 |
Table 4. Reported values of dose length product (DLP) and corresponding diagnostic reference level (DRL).
| CT examination | Median DLP (mGy-cm) | DLP range (mGy-cm) | DRL (mGy-cm) [12] |
| Head | 733 | 81–2173 | 1050 |
| Chest | 394 | 21–2286 | 650 |
| Abdomen | 464 | 58–2537 | 780 |
| Pelvis | 434 | 67–2000 | 570 |
| Cervical spine | 324 | 56–1275 | |
| Thoracic spine | 253 | 66–515 | |
| Lumbar spine | 302 | 49–870 | |
| Abdomen-pelvis | 472 | 430–1850 |
Figure 1.
Frequencies of reported weighted CT dose index (CTDIw) and dose length product (DLP) values for the head, chest, abdomen and pelvis. The dotted lines indicate the corresponding diagnostic reference levels.
Figure 2.
Weighted CT dose index (CTDIw) (mGy) and dose length product (DLP) (mGy-cm) reported by individual studies for the head, chest, abdomen and pelvis. The horizontal axis refers to the publication year of the study and the dotted line indicates the corresponding diagnostic reference levels.
Table 5. Reported values of effective dose (ED).
| CT examination | Median ED (mSv) | ED range (mSv) |
| Head | 1.9 | 0.3–8.2 |
| Chest | 7.5 | 0.3–26.0 |
| Abdomen | 7.9 | 1.4–31.2 |
| Pelvis | 7.6 | 2.5–36.5 |
| Cervical spine | 2.6 | 0.3–7.5 |
| Thoracic spine | 4.6 | 1.0–9.8 |
| Lumbar spine | 5.2 | 0.8–15.7 |
| Abdomen-pelvis | 9.3 | 3.7–31.5 |
Figure 3.
Frequencies of reported effective doses (ED) (mSv) for the head, chest abdomen and pelvis.
Figure 4.
Effective dose (ED) (mSv) reported by individual studies for the head, chest, abdomen and pelvis.
Figure 5.
Median organ doses (mGy) per type of CT examination.
Figure 6.
Reported effective doses for head, chest, abdomen and pelvis CT examinations divided into time periods according to year of publication. In each box plot the bold line indicates the median, the central box includes the middle 50% of the data and the whiskers show range of data.
Figure 7.
Median effective dose for single-slice CT (SSCT) and multislice CT (MSCT) for the most common types of CT examination. The corresponding values from all studies are also shown.
Discussion
Published results indicate a large variation of patient doses for the same type of CT scan examination. This is unsurprising considering the long time period that this review covered during which CT scanning technology has evolved and examination protocols have been optimised.
Median CTDIw and DLP values are below the proposed DRLs for all examinations (Tables 3 and 4); however, there are individual studies for which the DRLs are exceeded (Figure 1). Variation of results among studies (maximum/minimum reported value) is evident for both dose descriptors; however, it is more profound for DLP and CT examinations of the trunk. CTDIw varies by a factor of 4.2/3.8/6.0/7.2 for studies concerning the head/chest/abdomen/pelvis, respectively. DLP varies by a factor of 3.2/15.1/9.3/8.2 for the head/chest/abdomen/pelvis, respectively.
It is anticipated that variation of CTDIw among studies can be attributed to intrinsic differences among the makes and models of CT scanners such as beam geometry, radiation quality, number of detector rows, absorption and scattered X-rays [24]. An additional significant factor of variation is the selected examination protocol and in particular the milliampere seconds selection because the dose is directly proportional to this [13]. Variations in examination protocols are attributed to different routine protocols among institutions [25] but also to different clinical indications, which can lead to variation in scanning techniques [26].
The greater variability of results for DLP is the result of an additional parameter i.e. scan length. Longer scan lengths can be attributed in part to the use of contrast media since these procedures involve a repeated scan of the same region (i.e. with and without the contrast media) [24]. Two obvious measures to reduce patient dose consequent to the above are reducing the milliampere seconds whilst maintaining diagnostic image quality, especially for thinner than standard patients, and reducing scan length as much as possible without missing any vital anatomical regions.
An effect that contributes to increased patient exposure is “overscan” which arises from the requirement in spiral reconstruction algorithms for data beyond the actual volume to be reconstructed [27]. Thus, at the beginning and the end of the scan volume areas are exposed that are not part of the area medically in question [28].
Regarding ED, results indicate that in CT examinations of the head and neck ED is close to 2 mSv but increases 2- to 4-fold for examinations of the trunk (Table 5). Thus, ED for head examinations is lower than that of the trunk although individual organ doses for the head are considerably greater than for other parts of the body (Figure 5). This is owing to the uneven distribution of radiosensitive organs in the human body and the lower weighting factors for the head organs [18]. Accordingly, the correlation between DLP and ED must be separated into two parts: one for CT examinations of the head and one for CT examinations of the trunk [29]. As the relationship between DLP and ED is linear and the relationship between ED and stochastic risk is also assumed to be linear, DLP, which is normally quoted by modern scanners, can be used for comparing the stochastic risk for different CT examinations [29].
The investigation of ED variation over different time periods (Figure 6) revealed that ED for CT examinations of the head, chest and abdomen prior to 1995 were significantly higher than for the later studies whereas over the period between 1996 and 2009 the ED remained virtually unchanged. The finding that ED for abdomen and pelvis examinations are increased during the most recent period (2006–2009) is most likely attributable to studies from developing countries which are in the initial stages of protocol optimisation [24,30,31].
Significant dose reduction in more recent studies is attributed to the implementation of dose management procedures that correspond to the ALARA principle [32]. The mechanisms for dose reduction in CT equipment include [33]:
X-ray beam filtration;
X-ray beam collimation;
X-ray current modulation and adaptation for patient body habitus;
Peak kilovoltage optimisation;
Improved detection system efficiency; and
Noise reduction algorithms.
Tube current modulation and patient size dependent tube current adaptation are jointly referred to as automatic exposure control (AEC). The first commercially available tube current modulation systems were introduced in 1994 and provided dose reduction of up to 20% without considerable degradation of image quality [34]. Subsequent studies validated that dose reduction is achievable and that in elliptical body regions anatomically based modulation of the tube current results in up to 40% dose reduction [35].
Multislice CT technology, which is currently common in clinical practice, increases the efficacy of CT procedures and offers new promising applications such as multiphase exams, vascular and cardiac exams, perfusion imaging and screening exams of the heart, chest and colon [36-38]. However, the expanding use of multislice CT systems may result in a considerable increase in both the frequency of CT procedures and patient exposure levels. Regarding patient exposure, a certain dose increase compared with single-slice CT is unavoidable owing to underlying physical principles and in particular dose efficiency [39]. The dose efficiency of a CT scanner refers to the fraction of the total X-rays emitted from the X-ray source that are captured by the detectors and contribute to image formation. Dose efficiency has two components: the absorption efficiency, which is the fraction of X-rays that are captured by active detector area; and geometric efficiency, which is the fraction of X-rays that exit the patient and enter the active detector area [40]. The absorption efficiencies of single-slice CT and multislice CT are similar since the same type of detectors is used in both cases. However, geometric efficiency for multislice CT is reduced owing to the requirement for dividers between individual detector elements along the z-axis, which create dead spaces [40]. Additionally, with multislice CT only the plateau of the trapezoid dose profile may be used to ensure equal signal level for all detector slices while the penumbra region has to be discarded. This represents a wasted dose to the patient in contrast to single-slice CT where the entire dose profile contributes to detector signal [39,41]. Since the penumbra accounts for a larger percentage of the beam when a narrow detector configuration is used, dose efficiency is decreased with the use of a narrow collimation. This principle applies to CT scans performed with any multislice CT scanner, but the effect on radiation dose is greater with four slice scanners (because of the small beam size) than with scanners capable of acquiring more slices per rotation [42]. Thus, the relative contribution of the penumbra region to patient dose decreases with increasing slice width and also decreases with increasing number of simultaneously acquired slices [39,40].
To evaluate the effect of multislice technology for the most common types of CT examinations (head, chest, abdomen and pelvis), the ED were extracted from studies that reported results for single-slice CT and multislice CT. The number of studies that report ED for non-cardiac multislice CT examinations is currently limited and the results for multislice CT refer to various types of scanners that acquire from 2 to 256 slices per rotation. As previously mentioned, median effective doses for multislice CT scans are equal or lower than single-slice CT scans but the statistical power is not adequate to detect any significant differences between them. A few comparative studies have evaluated multislice CT against single-slice CT technology. A study of single-slice CT, dual-slice and quad-slice systems concluded that average ED over all examinations is increased by 10% for quad-slice systems but decreased by 26% for dual-slice systems [43]. Two subsequent studies indicate that doses are increased for multislice CT with four or more detector rows compared with single-slice CT [26,44] and that on average multislice CT scanners deliver 35% more ED than single-slice CT scanners, although this difference is not uniformly spread across all examinations [44]. The distinction between single-slice CT and multislice CT ED is generally greatest for examinations using narrow slices (e.g. head or high resolution chest) but is less apparent for other examinations (e.g. abdomen or pelvis) [44]. This characteristic is owing to the necessity of multislice CT scanners to irradiate more of the patient than is actually imaged particularly for acquisition of narrow slices and it can result to doses up to 40% higher compared with well-collimated single-slice CT systems [45].
Regarding comparison of delivered dose among multislice CT with varying number of detector rows, a study comparing radiation dose at routine chest examination between scanners with 4, 8 and 16 rows revealed a trend towards decreasing radiation dose with increasing number of detector rows [46]. Another study comparing doses associated with 16-slice and 256-slice scanners also concluded that dose reduction is achieved for all types of CT examinations with the 256-slice scanner [47]. A recent study comparing organ and ED in chest and abdominal CT examinations concluded that doses associated with 64-slice scanners are similar to those with 4-, 8- and 16-slice scanners [48].
A development in multislice CT technology is the introduction of scanners with two X-ray tubes, for which patient doses could be up to a factor of two lower than a single source CT scanner of the same number of acquired slices [49].
A concurrent finding of the above comparative studies is that multislice CT scanners with more that 4-detector rows deliver higher patient dose than single-slice CT and that patient dose is decreased with increasing number of detector rows. However, it has to be noted that most comparative studies evaluated single-slice CT scanners that had heavily optimised protocols of exposure settings already available and implemented compared with multislice CT scanners which were the beginning of their optimisation process [43]. It is therefore possible that with modern multislice CT scanners, capable of acquiring 16 or more slices per rotation in combination with sophisticated exposure reduction techniques, radiation doses to patients during CT examinations could be substantially reduced. However, the improved clinical efficacy and new applications available with multislice CT are likely to lead to rising examination frequency and thorough justification of exams and an effort to minimise patient irradiation should always be undertaken.
Conclusion
Patient radiation doses from CT examinations vary among studies owing to differences in CT scanner design and examination protocols. However, reported values are generally lower than the proposed DRLs. The introduction of mechanisms for dose reduction resulted in significantly lower patient ED for CT examinations of the head, chest and abdomen reported by studies published after 1995. Multislice scanners have increased the efficacy and clinical indications for CT but are also burdened, at least in theory, with increased patient irradiation. The currently limited number of studies that report patient doses for multislice CT examinations prohibit the detection of differences between multislice and single-slice scanners.
References
- 1.Origgi D, Vigorito S, Villa G, Bellomi M, Tosi G. Survey of computed tomography techniques and absorbed dose in Italian hospitals: a comparison between two methods to estimate the dose-length product and the effective dose and to verify fulfilment of the diagnostic reference levels. Eur Radiol 2006;16:227–37 [DOI] [PubMed] [Google Scholar]
- 2.Shrimpton PC, Wall BF. The increasing importance of X-ray computed tomography as a source of medical exposure. Radiat Prot Dosimetry 1995;57:413–5 [Google Scholar]
- 3.Kaul A, Bauer B, Bernhardt J, Nosske D, Veit R. Effective doses to members of the public from the diagnostic application of ionizing radiation in Germany. Eur Radiol 1997;7:1127–32 [DOI] [PubMed] [Google Scholar]
- 4.Hart D, Wall BF. UK population dose from medical X-ray examinations. Eur J Radiol 2004;50:285–91 [DOI] [PubMed] [Google Scholar]
- 5.Leber AW, Knez A, von Ziegler F, Becker A, Nikolaou K, Paul S, et al. Quantification of obstructive and non-obstructive coronary lesions by 64-slice computed tomography: a comparative study with quantitative coronary angiography and intravascular ultrasound. Journal of the American College of Cardiology 2005;46:147–54 [DOI] [PubMed] [Google Scholar]
- 6.Mollet NR, Cademartiri F, van Mieghem CA, Runza G, McFadden EP, Baks T, et al. High-resolution spiral computed tomography coronary angiography in patients referred for diagnostic conventional coronary angiography. Circulation 2005;112:2318–23 [DOI] [PubMed] [Google Scholar]
- 7.Raff GL, Gallagher MJ, O'Neill WW, Goldstein JA. Diagnostic accuracy of non-invasive coronary angiography using 64-slice spiral computed tomography. Journal of the American College of Cardiology 2005;46:552–7 [DOI] [PubMed] [Google Scholar]
- 8.Scheffel H, Alkadhi H, Plass A, Vachenauer R, Desbiolles L, Gaemperli O, et al. Accuracy of dual-source CT coronary angiography: First experience in a high pre-test probability population without heart rate control. European radiology 2006;16:2739–47 [DOI] [PMC free article] [PubMed] [Google Scholar]
- 9.Muhogora WE, Ahmed NA, Beganovic A, Benider A, Ciraj-Bjelac O, Gershan V, et al. Patient doses in CT examinations in 18 countries: initial results from International Atomic Energy Agency projects. Radiat Prot Dosimetry 2009;136:118–26 [DOI] [PubMed] [Google Scholar]
- 10.Smith A, Shah GA, Kron T. Variation of patient dose in head CT. Br J Radiol 1998;71:1296–301 [DOI] [PubMed] [Google Scholar]
- 11.Kalender W. Computed tomography: influence of exposure parameters and the establishment of reference dose values. Radiat Prot Dosimetry 1998;73:384–95 [Google Scholar]
- 12.European Commission. European guidelines on quality criteria for computed tomography, Report EUR 16262. Brussels: EC; 1999. [Google Scholar]
- 13.Goldman LW. Principles of CT: radiation dose and image quality. J Nucl Med Technol 2007;35:213–25 [DOI] [PubMed] [Google Scholar]
- 14.Shope TB, Morgan TJ, Showalter CK, Pentlow KS, Rothenberg LN, White DR, et al. Radiation dosimetry survey of computed tomography systems from ten manufacturers. Br J Radiol 1982;55:60–9 [DOI] [PubMed] [Google Scholar]
- 15.Spokas JJ. Dose descriptors for computed tomography. Med Phys 1982;9:288–92 [DOI] [PubMed] [Google Scholar]
- 16.McNitt P, Cagnon CH, Solberg A, Chetty I. Radiation dose in spiral CT: the relative effects of collimation and pitch. Med Phys 1999;26:409–14 [Google Scholar]
- 17.Morin RL, Gerber TC, McCollough CH. Radiation dose in computed tomography of the heart. Circulation 2003;107(6):917–22 [DOI] [PubMed] [Google Scholar]
- 18.ICRP. doi: 10.1016/j.icrp.2007.10.003. ICRP publication 103, The 2007 Recommendations of the International Commission on Radiological Protection. Annals of the ICRP. Elsevier Publications, Oxford, UK. 2007. [DOI] [PubMed] [Google Scholar]
- 19.ICRP. doi: 10.1016/j.icrp.2007.09.001. ICRP publication 102, Managing patient dose in multi-detector computer tomography. Annals of the ICRP, 37, Elsevier Publications, Oxford, UK. 2007. [DOI] [PubMed] [Google Scholar]
- 20.Impactscan. org. ImPACT CT dosimetry tool (Available from: http://www.impactscan.org/) accessed from April 2003 to February 2009. [Google Scholar]
- 21.Baadegaard N, Jensen L. A CT dose calculation software “CT-dose”. Denmark: National Board of Health, Aarhus University Hospital; 1999. [Google Scholar]
- 22.Brix G, Lechel U, Veit R, Truckenbrodt R, Stamm G, Coppenrath EM, et al. Assessment of a theoretical formalism for dose estimation in CT: an anthropomorphic phantom study. Eur Radiol 2004;14:1275–84 [DOI] [PubMed] [Google Scholar]
- 23.Kalender WA, Schmidt B, Zankl M, Schmidt M. A PC program for estimating organ dose and effective dose values in computed tomography. Eur Radiol 1999;9:555–62 [DOI] [PubMed] [Google Scholar]
- 24.Ngaile JE, Msaki P, Kazema R. Towards establishment of the national reference dose levels from computed tomography examinations in Tanzania. J Radiol Prot 2006;26:213–25 [DOI] [PubMed] [Google Scholar]
- 25.Aldrich JE, Bilawich AM, Mayo JR. Radiation doses to patients receiving computed tomography examinations in British Columbia. Can Assoc Radiol J 2006;57:79–85 [PubMed] [Google Scholar]
- 26.Shrimpton PC, Hillier MC, Lewis MA, Dunn M. National survey of doses from CT in the UK: 2003. Br J Radiol 2006;79:968–80 [DOI] [PubMed] [Google Scholar]
- 27.Taguchi K, Aradate H. Algorithm for image reconstruction in multi-slice helical CT. Med Phys 1998;25:550–61 [DOI] [PubMed] [Google Scholar]
- 28.Cohnen M, Poll LJ, Puettmann C, Ewen K, Saleh A, Modder U. Effective doses in standard protocols for multi-slice CT scanning. Eur Radiol 2003;13:1148–53 [DOI] [PubMed] [Google Scholar]
- 29.Hidajat N, Maurer J, Schroder RJ, Nunnemann A, Wolf M, Pauli K, et al. Relationships between physical dose quantities and patient dose in CT. Br J Radiol 1999;72:556–61 [DOI] [PubMed] [Google Scholar]
- 30.Ngaile JE, Msaki P, Kazema R. Current status of patient radiation doses from computed tomography examinations in Tanzania. Radiat Prot Dosimetry 2006;121:128–35 [DOI] [PubMed] [Google Scholar]
- 31.Muhogora WE, Nyanda AM, Ngoye WM, Shao D. Radiation doses to patients during selected CT procedures at four hospitals in Tanzania. Eur J Radiol 2006;57:461–7 [DOI] [PubMed] [Google Scholar]
- 32.ICRP Task Group on Control of Radiation Dose in Computed Tomography. Managing patient dose in computed tomography. A report of the International Commission on Radiological Protection. Elsevier Publications, Oxford, UK: 2000. [DOI] [PubMed] [Google Scholar]
- 33.McCollough CH, Bruesewitz MR, Kofler JM., Jr CT dose reduction and dose management tools: overview of available options. Radiographics 2006;26:503–12 [DOI] [PubMed] [Google Scholar]
- 34.Kopka L, Funke M, Breiter N, Hermann KP, Vosshenrich R, Grabbe E. An anatomically adapted variation of the tube current in CT. Studies on radiation dosage reduction and image quality. Rofo 1995;163:383–7 [DOI] [PubMed] [Google Scholar]
- 35.Kalender WA, Wolf H, Suess C. Dose reduction in CT by anatomically adapted tube current modulation. II. Phantom measurements. Med Phys 1999;26:2248–53 [DOI] [PubMed] [Google Scholar]
- 36.Berland LL, Smith JK. Multidetector-array CT: once again, technology creates new opportunities. Radiology 1998;209:327–9 [DOI] [PubMed] [Google Scholar]
- 37.Rydberg J, Buckwalter KA, Caldemeyer KS, Phillips MD, Conces DJ., Jr , Aisen AM, et al. Multisection CT: scanning techniques and clinical applications. Radiographics 2000;20:1787–806 [DOI] [PubMed] [Google Scholar]
- 38.Golding SJ. Multi-slice computed tomography (MSCT): the dose challenge of the new revolution. Radiat Prot Dosimetry 2005;114:303–7 [DOI] [PubMed] [Google Scholar]
- 39.Kohl G. The evolution and state-of-the-art principles of multislice computed tomography. Proc Am Thorac Soc 2005;2:470–6 [DOI] [PubMed] [Google Scholar]
- 40.Goldman LW. Principles of CT: multislice CT. J Nucl Med Technol 2008;36:57–68 [DOI] [PubMed] [Google Scholar]
- 41.Mayo JR, Aldrich J, Muller NL. Radiation exposure at chest CT: a statement of the Fleischner Society. Radiology 2003;228:15–21 [DOI] [PubMed] [Google Scholar]
- 42.Dalrymple NC, Prasad SR, El-Merhi FM, Chintapalli KN. Price of isotropy in multidetector CT. Radiographics 2007;27:49–62 [DOI] [PubMed] [Google Scholar]
- 43.Brix G, Nagel HD, Stamm G, Veit R, Lechel U, Griebel J, et al. Radiation exposure in multi-slice vs single-slice spiral CT: results of a nationwide survey. Eur Radiol 2003;13:1979–91 [DOI] [PubMed] [Google Scholar]
- 44.Yates SJ, Pike LC, Goldstone KE. Effect of multislice scanners on patient dose from routine CT examinations in East Anglia. Br J Radiol 2004;77:472–8 [DOI] [PubMed] [Google Scholar]
- 45.Lewis MA. Multislice CT: opportunities and challenges. Br J Radiol 2001;74:779–81 [DOI] [PubMed] [Google Scholar]
- 46.Moore WH, Bonvento M, Olivieri-Fitt R. Comparison of MDCT radiation dose: a phantom study. AJR Am J Roentgenol 2006;187:W498–502 [DOI] [PubMed] [Google Scholar]
- 47.Mori S, Endo M, Nishizawa K, Murase K, Fujiwara H, Tanada S. Comparison of patient doses in 256-slice CT and 16-slice CT scanners. Br J Radiol 2006;79:56–61 [DOI] [PubMed] [Google Scholar]
- 48.Fujii K, Aoyama T, Yamauchi-Kawaura C, Koyama S, Yamauchi M, Ko S, et al. Radiation dose evaluation in 64-slice CT examinations with adult and paediatric anthropomorphic phantoms. Br J Radiol 2009;82:1010–8 [DOI] [PMC free article] [PubMed] [Google Scholar]
- 49.McCollough CH, Primak AN, Saba O, Bruder H, Stierstorfer K, Raupach R, et al. Dose performance of a 64-channel dual-source CT scanner. Radiology 2007;243:775–84 [DOI] [PubMed] [Google Scholar]


