

Abstract
Objective
The aim of this study was to determine the prognostic significance of the volume and intensity of abnormal 18F-fluorodeoxyglucose positron emission tomography (FDG-PET) accumulation within areas of contrast enhancement on post-therapeutic volumetric MRI.
Methods
A total of 10 patients with Grade III or IV glioma were treated with resection followed by intracavitary radiation therapy with 131I-labelled antitenascin monoclonal antibody. Patients underwent serial FDG-PET and 1.5 T MR imaging. For each patient, MR and FDG-PET image volumes at each time point were aligned using a rigid-body normalised mutual information algorithm. Contrast-enhancing regions of interest (ROIs) were defined using a semi-automated k-means clustering technique. Activity within the ROI on the co-registered PET scan was calculated as a ratio (mean activity ratio; MAR) to activity in contralateral normal-appearing white matter (NAWM). The PET lesion was defined as the portion of the ROI associated with activity greater than two standard deviations above the mean in NAWM. Survival was assessed using the logrank test.
Results
Larger contrast-enhancing ROIs were strongly associated with an increased MAR (r = 0.51; p<0.002). Enhancing lesions with an MAR >1.2 were associated with decreased survival (p<0.016). In nine patients who died, the MAR on PET correlated inversely with survival duration (r = −0.43; p<0.01), whereas PET lesion volume did not.
Conclusion
Following intracavitary radiation therapy, the development of contrast-enhancing lesions that are associated with high mean FDG-PET accumulation suggests poor prognosis.
High-grade gliomas are the most common primary central nervous system (CNS) tumours, having a combined incidence of 5–8/100 000 population [1]. Even with optimal management of these tumours, consisting of complete surgical resection, radiation therapy and adjuvant temozolomide, median overall survival in these patients approximates 1 year [2]. Despite recent advances, genotypic heterogeneity within pathologically indistinguishable tumours remains a major barrier to successful treatment of patients with high-grade primary brain tumours [3]. As a result of this heterogeneity, only a minority of individual tumours are likely to respond to any given chemotherapeutic agent [4]. Early identification of non-responders would allow more effective therapy to be instituted, while minimising the morbidity and financial cost associated with prolonged ineffective treatment. At present, contrast-enhanced MRI provides the primary imaging assessment of therapeutic efficacy in such patients, but the shortcomings of this paradigm are well known [4-6].
Positron emission tomography (PET) using the radiotracer 18F-fluorodeoxyglucose (FDG) has a complementary role to MRI in the evaluation of primary cerebral malignancies, providing in vivo physiological information not otherwise available [7]. The glucose metabolic rate of such tumours has been shown to be an accurate predictor of histological tumour grade as well as of patient survival, information that often effects management [8-10]. Although it was first demonstrated in the de novo evaluation of such tumours, there is some evidence that this relationship might also apply in the setting of prior therapeutic intervention [11,12]. Furthermore, at least two groups have been able to establish thresholds of FDG accumulation above which patients are likely to have poor prognosis [9,13]. These data demonstrate the potential for quantitative analysis of FDG-PET imaging to prospectively evaluate therapeutic efficacy in individual patients with high-grade brain tumours.
The potential utility of FDG-PET imaging towards this end, however, will require the development of parameters with a degree of test–retest reproducibility. To accomplish this goal, two major challenges must be overcome: the high glucose metabolism within normal grey matter and regional tumour heterogeneity. Cerebral grey matter uses glucose almost exclusively to meet its energy requirements. As a result, normal cortex and deep grey matter nuclei have high baseline FDG accumulation, making differentiation from high-grade neoplasm a significant challenge. A common solution to this problem is side-by-side anatomical correlation with contrast-enhanced MR images [6,9,13]. Although image analysis can be accomplished in this manner, different angles of image acquisition can make accurate correlation difficult [6]. By accounting for these differences, formal co-registration of anatomical and FDG-PET data might provide more accurate characterisation of intracranial lesions [6,14]. Considering the second challenge, malignant primary brain tumours display a high degree of regional histological heterogeneity; the majority of tumours display elements of both high and low World Health Organization (WHO) grade [6,15]. Current strategies for region of interest (ROI) selection typically involve subjective placement of ROIs using side-by-side comparison with MR images [9,13]. Such strategies are unlikely to include the same regions of the tumour on sequential examinations and will therefore likely serve to diminish the reproducibility of quantitative measures of FDG accumulation. Methods that analyse FDG accumulation within whole-tumour ROIs might be less susceptible to variability resulting from intratumoural heterogeneity. It is important to note, however, that such analyses might not have the same prognostic value, given evidence that tumour behaviour might be best predicted by its most FDG-avid elements [16].
The goal of this study was to evaluate the prognostic significance of parameters of FDG accumulation within whole-tumour ROIs derived from co-registered FDG-PET and contrast-enhanced MRI exams. As the patterns of FDG accumulation within areas of tumour-related enhancement have not been well characterised, we also sought to examine the relationship between quantitative parameters derived from the two imaging studies.
Methods and materials
Patients were selected from a larger study of MR and PET imaging in patients undergoing intracavitary radiation therapy for high-grade glioma that was approved by the local institutional review board and for which informed consent was obtained. Patients were included if they met four criteria: the candidate was referred for pathological diagnosis of grade III or IV astrocytoma; they underwent MRI including volumetric gadolinium contrast-enhanced T1 weighted three-dimensional spoiled gradient recalled (3D SPGR) in steady-state images after intracavitary radiation treatment; they underwent FDG-PET within 48 h of the time of MRI; and they were over 18 years of age. Exclusion criteria were pregnancy and/or breast feeding, co-medication that could interfere with study results (e.g. immunosuppressive agents other than corticosteroids), active infection or a history of adverse reaction to gadolinium chelates. The duration of imaging follow-up for this patient group ranged from 200 to 512 days after initial tumour resection. Clinical follow-up and survival status was documented to a maximum (clinical follow-up terminated at the time of patient demise) of 1611 days (4.4 years) after initial resection. The study was conducted in compliance with the Health Insurance Portability and Accountability Act (HIPAA) regulations.
MR and FDG-PET imaging
MRI was performed on a 1.5 T magnet (GE Medical Systems, Milwaukee, WI). Whole-brain 3D SPGR (repetition time (TR)/echo time (TE) 12.2 ms/5.3 ms; 1 acquisition (NEX 1); flip angle 20 degrees; inversion time 300 ms; field of view 256×256 mm) was performed after the intravenous injection of gadopentetate dimeglumine (Gd-DTPA; Magnevist Bayer Health, Robinson Township, PA); the dose of Gd-DTPA was 0.1 mmol kg−1.
Patients underwent FDG-PET scans within 48 h of contrast-enhanced MRI. All PET studies were performed on a GE Advance PET scanner (GE Healthcare, Inc., Waukesha, WI). Patients were instructed to have no caloric intake 4 h prior to FDG injection. Serum glucose measurements were obtained prior to injection to ensure normoglycaemia. Although hyperglycaemia was not an absolute criterion for exclusion, normoglycaemia was documented prior to the PET studies for 9 of the 10 patients (the 10th patient had a documented blood glucose level of 256 mg dl−1 prior to 1 of the serial studies; the remaining studies were performed in the setting of normoglycaemia). After the injection of 370 MBq 2-(18F)-fluoro-2-deoxy-d-glucose, patients are allowed to rest quietly, with eyes open, in a dimly lit room for 45 min. PET scans were performed for 6 min using 3D acquisition over a single table position (14.4 cm z-axis distance). Each data set consisted of 35 transaxial PET images with 4.25 mm slice thickness and 25.6-mm field of view. Images were reconstructed using 3D filtered back-projection with utilisation of calculated attenuation correction. Raw PET tiff files were then converted into isotropic 32-bit images in MBq ml−1.
Image analysis
All imaging data were analysed retrospectively. 3D SPGR image volumes were interpolated to 1 mm isotropic voxels (initial voxel size 0.94×0.94×1.5 mm) using trilinear technique. For each patient, all post-therapy MR image volumes were aligned to that patient's earliest available 3D SPGR image set using a rigid body normalised mutual information algorithm provided by the National Library of Medicine Insight Segmentation and Registration Toolkit (MultiResMIRegistration; http://www.itk.org). The FDG-PET data sets were interpolated (again using trilinear technique) to 1 mm isotropic voxels (initial voxel size 2×2×3.3 mm). Each interpolated PET scan was then registered to the 3D SPGR image volume obtained within 48 h of PET scan acquisition. Figure 1 demonstrates an example of co-registered contrast-enhanced MR and PET images within a patient at three different time-points. Visual inspection of co-registered images revealed satisfactory volumetric correlation.
Figure 1.

Co-registered axial contrast-enhanced spoiled gradient recalled (MRI) and axial fluorodeoxyglucose position emission tomography images from three time-points. (a) MRI time-point 1. (b) FDG-PET time-point 1. (c) MRI time-point 2. (d) FDG-PET time-point 2. (e) MRI time-point 3. (f) FDG-PET time-point 3.
Contrast-enhanced 3D SPGR image volumes were segmented using a semi-automated technique to isolate volumes of interest defined by abnormal tumour-related enhancement. Segmentation was performed by a board-certified radiologist blinded to the survival data and implemented using macro scripts and plug-in extensions to ImageJ, a java-based image analysis platform (http://rsb.info.nih.gov/ij/; W Rasband, National Institute of Mental Health, Bethesda, MD) (Figure 2). The segmentation procedure involved four steps. Firstly, images in the registered isotropic 3D SPGR data set were smoothed using an edge-preserving technique [17]. Secondly, each image in the data set was segmented into four levels of signal intensity using a k-means clustering technique. Thirdly, abnormal tumour-related enhancement was selected from the image segment with the highest mean signal intensity using freehand ROI placement to exclude other regions of high signal intensity (including fat as well as enhancing dura mater and choroid plexus). Lastly, regions from each MR slice were summed to create whole-tumour volumes of tumour-related enhancement.
Figure 2.

Semi-automated process used to acquire volumes of abnormal tumour-related enhancement. (a) Selected axial contrast-enhanced spoiled gradient recalled image demonstrates tumour-related enhancement in the left posterior parietal lobe. (b) Same image as in (a) segmented into four levels of signal intensity. (c) The image segment with the highest signal intensity. (d) Freehand region of interest is placed around tumour-related enhancement to exclude other regions with high signal intensity. (e) Isolated tumour-related enhancement.
Data analysis
FDG activity in the brain was calculated as a ratio to the activity in contralateral normal-appearing white matter (NAWM). NAWM was delineated on co-registered 3D SPGR images by freehand ROI within NAWM in the centrum semiovale contralateral to the surgical cavity. The mean activity ratio (MAR) was defined as the average FDG accumulation within the volume of tumour-related enhancement relative to the average FDG accumulation in NAWM. The PET lesion was defined as the portion of the volume of tumour-related enhancement derived from MRI associated with activity greater than two standard deviations above the mean in NAWM. This cut-off was defined empirically in an effort to include only those pixels that are likely to demonstrate abnormally increased FDG accumulation (i.e. greater than white matter). By definition, therefore, the volume of the PET lesion could not exceed the volume of the tumour-related enhancement. PET scans were reviewed (visual analysis by one reader) to ensure there were no obvious areas of abnormal FDG accumulation outside the regions of enhancement.
Two survival analyses were conducted. Firstly, a generalised linear model was used to evaluate the relationship of derived parameters to survival duration. This statistical test was selected as patients did not necessarily have the same number of imaging studies. Secondly, survival in patients with high mean FDG accumulation was compared with that in all other patients using the logrank test according to the following null hypothesis: patients with an MAR greater than the median (1.2) at any point during the first 4 months after therapy will not have significantly different survival duration from all other patients.
Results
Patient demographics
Imaging was performed from March 2002 through February 2005. The final patient group comprised 10 patients (7 men and 3 women, 31–69 years of age, mean age 48.0 years) with biopsy-proven high-grade glioma (2 WHO Grade III, 8 WHO Grade IV). All patients were treated with surgical resection followed by intracavitary radiation therapy with 131I-labelled antitenascin monoclonal antibody (1.3–3.4 GBq, 7–20 mg protein, cavity volume 1.8–4.0 ml).
Image acquisition
Paired MRI and PET studies from a total of 37 time-points met the criteria for inclusion in this study. Of the 10 patients, 1 had 2 time-points included in the study, 5 had 3 time-points included, 2 had 6 time-points and 2 had 7 time-points included. A total of 31 of the pairs were obtained within the first year after treatment and 14 were obtained within the first 6 months.
Lesion analysis
The volume of abnormal tumour-related enhancement on MR images varied in magnitude from 0.4 to 30.1 cc. The FDG activity in these volumes of enhancing tissue, expressed as an MAR, ranged between 0.6 and 2.1. The volume of lesions derived from PET images varied from 0 to 15.8 cc. The median volume of the PET lesion relative to the volume of tumour-related enhancement was 20% (range 0–88%).
The relationship between the volume of tumour-related enhancement and PET lesion volume is shown in Figures 3 and 4. Larger volumes of tumour-related enhancement were associated with larger PET lesions (r = 0.72; p<0.0001). Larger enhancing volumes were also associated with a greater ratio of PET lesion volume to the volume of the tumour-related enhancement (r = 0.42; p = 0.01). There was a positive correlation between the volume of tumour-related enhancement and increased mean FDG accumulation, as measured by the MAR (r = 0.51; p<0.002; Figure 5).
Figure 3.

Volume of tumour-related enhancement vs volume of position emission tomography (PET) lesion. Larger volumes of tumour-related enhancement were associated with larger PET lesions (r = 0.72; p<0.0001). The key to the right of the graph associates randomised patient number with respective data points.
Figure 4.
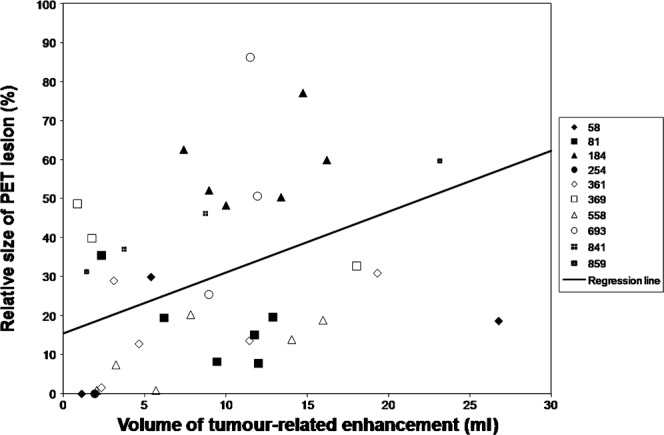
Volume of tumour-related enhancement vs relative size position emission tomography (PET) lesion. The volume of the PET lesion relative to the volume of tumour-related enhancement increased with increasing tumour-related enhancement volume (r = 0.42; p = 0.01). The key to the right of the graph associates randomised patient number with respective data points.
Figure 5.
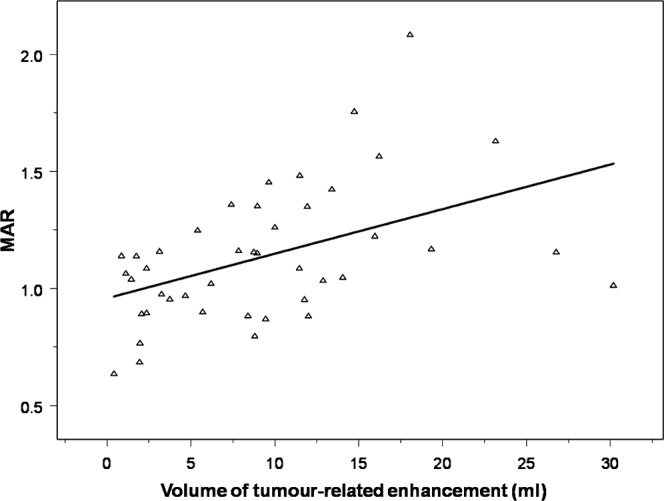
Volume of tumour-related enhancement vs mean activity ratio (MAR). There is a positive correlation between the volume of tumour-related enhancement and increased 18F-fluorodeoxyglucose accumulation, as measured by the MAR (r = 0.51; p<0.002).
Survival analysis
In paired studies from the nine patients who died during the follow-up period, the MAR correlated inversely with the duration of survival from the time of imaging (r = −0.43; p<0.01; Figure 6). Furthermore, those patients with high mean FDG accumulation based on the FDG-PET scan (defined as an MAR >1.2) had decreased survival compared with those patients who did not (p<0.016; Figure 7). Mean survival for the high mean FDG group was 541 days from the date of initial resection (range 244–719 days). For all other patients, mean survival was 1011 days (range 657–1611 days).
Figure 6.
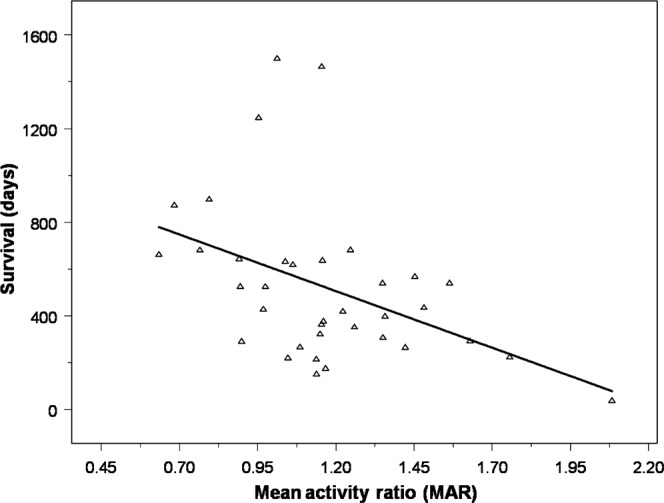
Mean activity ratio (MAR) vs survival in the nine patients who died during the follow-up period. The MAR within the volume of tumour-related enhancement correlated inversely with survival duration from the time of imaging (r = −0.43; p<0.01).
Figure 7.
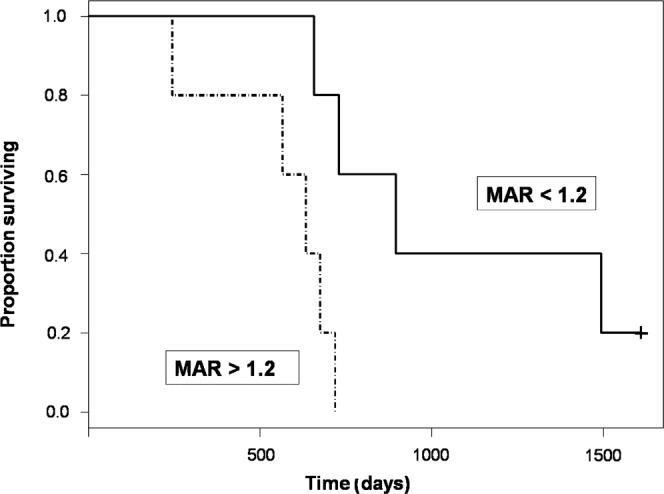
Kaplan–Meier survival curve. Patients with high mean 18F-fluorodeoxyglucose accumulation (defined as a mean activity ratio (MAR) >1.2 at some time during the first 4 months after therapy; dotted black line) have decreased survival from the time of treatment (p<0.016). The solid black line represents patients whose maximal MAR measured <1.2 during this 4 month time period. +, censored patient.
By contrast, neither PET lesion volume nor the volume of tumour-related enhancement correlated with survival duration.
Discussion
18F-FDG undergoes uptake and phosphorylation in normal and neoplastic cerebral tissues, but cannot complete the glycolytic pathway and thus remains sequestered within the intracellular compartment. Neoplastic transformation is associated with elevated rates of glucose utilisation as well as a shift from oxidative to anaerobic metabolism. This acceleration is supported by an increased capacity for glucose transport as well as glycolysis [18]. These characteristics form the basis for evaluation of malignancy with FDG-PET.
Although the value of FDG-PET imaging is well established, the optimal methods for image analysis have not been determined [19]. Our results establish the selection of whole-tumour ROIs based on the segmentation of co-registered contrast-enhanced MR images as a viable alternative to subjective ROI placement. Mean FDG accumulation within such whole-tumour ROIs, normalised to contralateral NAWM, correlated inversely with overall survival. In addition, we were able to define a threshold above which patients were likely to have poor prognosis. These results suggest the potential for such parameters to prospectively identify individual patients who have experienced treatment failure and are in concordance with recent studies demonstrating the prognostic value of FDG-PET in the post-treatment setting [20]. Although FDG is the most widely used PET tracer, a similar approach might be of interest to help establish quantitative metrics with prognostic value using other PET agents including 18F-fluoroethyl tyrosine (FET) [21,22].
This and similar methods could have significant implications for the use of pre- and post-therapy FDG scans to evaluate treatment response. Subjective placement of ROIs using side-by-side comparison with MR images is unlikely to include identical regions of the tumour at disparate time-points. Such ROI placement paradigms are therefore likely to diminish the reproducibility of quantitative measures of FDG accumulation, especially given the degree of histological heterogeneity known to occur in high-grade primary brain tumours [6]. We used whole-tumour ROIs derived from co-registered FDG-PET and contrast-enhanced MRI exams to accurately differentiate enhancing tumour from adjacent non-enhancing tumour as well as from normal brain. Of note, co-registration has been shown to improve the diagnostic accuracy of FDG-PET, including differentiation of tumour from normal structures, in other parts of the body [23]. Further study is required to determine whether such parameters will be more suitable to interscan comparison in the evaluation of treatment response.
It should be noted that many groups have used a subjective visual grading system (VGS) like that described by Kim et al [16], grading metabolism by comparison with FDG accumulation in surrounding grey and white matter structures. Several studies have demonstrated this type of semi-quantitative analysis to be equal, or even superior to, objective indices of metabolic rate with regards to predicting outcome in patients with high-grade primary brain tumours [16,24,25]. Further study will be required to determine how different methods of ROI placement might effect such conclusions.
The preponderance of studies on this subject, using both VGSs as well as objective indices of glucose metabolism, use some index of intensity of FDG accumulation without respect for the size of the PET abnormality. Tralins et al [26] found PET lesion volume to be an independent predictor of both survival and time to tumour progression. Our study found no significant correlation between PET lesion volume and survival. This discrepancy could reflect inadequate power to detect such a correlation in a small number of patients. It is also possible that the intensity of FDG uptake in brain tumours is a more robust predictor of survival than the size of the PET lesion.
Although there is some evidence of concordance between tumour characterisation by contrast-enhancement on MR images and FDG accumulation on FDG-PET scans [27], our results provide the first correlation of quantitative MR and FDG-PET parameters in spatially registered lesions. Lesions showing larger volumes of tumour-related contrast enhancement on MRI were strongly associated with overall increased intensity of FDG accumulation, as measured by the MAR, as well as with larger PET lesions. Lesions with larger volumes of contrast enhancement were also associated with a greater ratio of PET lesion volume to volume of contrast enhancement.
Our study suffers from several limitations. Firstly, although initial therapies were standardised (i.e. resection followed by intracavitary radiation therapy with 131I-labelled antitenascin monoclonal antibody), decisions regarding further intervention were made on an individual basis. This broad rubric of therapy includes the use of corticosteroids, which not only potentially raise serum glucose levels but also affect the permeability of the blood–brain barrier and tumour perfusion [28]. Of note, normoglycaemia was documented prior to FDG injection for PET studies in 9 of our 10 patients. In addition, FDG accumulation has been shown to be primarily related to FDG metabolism with little dependence on disruption of the blood–brain barrier [29].
Secondly, because all of our patients underwent the same initial treatment, it remains unclear whether these results can be applied to larger patient groups that might have received a more diverse array of therapies. This is particularly relevant as novel treatment modalities, such as combination treatments with anti-angiogenesis agents, become more commonplace.
Thirdly, no attempt was made to determine the pathological diagnoses underlying the MR and FDG-PET imaging findings in our patients. In particular, no distinction was made between patients with radiation necrosis and recurrent high-grade glioma. Although this diagnostic distinction has significant consequences regarding management of these patients, in this study it did not seem to affect the prognostic implications of the imaging findings.
Further study would be of interest to determine whether the results in this small single-centre trial can be replicated in a larger multicentre trial using a wider range of MR and PET scanner instrumentation. A multicentre trial might be able to provide further validation of quantitative measurements from FDG-PET as surrogate end points for clinical trials. Such a trial might also be able to distinguish whether measurements from FDG-PET are more robust predictors of outcome than volume of tumour-related contrast enhancement on MRI. Moreover, it would be possible to see how both measurements compare with more accepted surrogate end points on MRI, such as bidirectional measurements using the MacDonald criteria. As a prelude to this, a study of test–retest reproducibility of these quantitative measurements in individual patients would be particularly valuable. It is of interest to note that quantitative analysis of brain lesions using data derived from both PET and MRI could become even more practical if recently introduced combination PET-MRI scanners come into widespread clinical use [30].
Conclusion
Our study has demonstrated a correlation between quantitative measurements derived from FDG-PET imaging and prognosis in patients with high-grade primary brain tumours. If these findings can be validated in larger studies, these measurements could provide the basis for useful surrogate markers of patient outcome in clinical trials.
References
- 1.Friedman HS, Kerby T, Calvert H. Temozolomide and treatment of malignant glioma. Clin Cancer Res 2000;6:2585–97 [PubMed] [Google Scholar]
- 2.Stupp R, Mason WP, van denBent MJ, Weller M, Fisher B, Taphoorn MJ, et al. Radiotherapy plus concomitant and adjuvant temozolomide for glioblastoma. New Engl J Med 2005;352:987–96 [DOI] [PubMed] [Google Scholar]
- 3.Barker FG, 2nd, Chang SM, Valk PE, Pounds TR, Prados MD. 18-Fluorodeoxyglucose uptake and survival of patients with suspected recurrent malignant glioma. Cancer 1997;79:115–26 [PubMed] [Google Scholar]
- 4.Perry JR, Cairncross JG. Glioma therapies: how to tell which work? J Clin Oncol 2003;21:3547–9 [DOI] [PubMed] [Google Scholar]
- 5.Macdonald DR, Cascino TL, Schold SC, Jr, Cairncross JG. Response criteria for phase II studies of supratentorial malignant glioma. J Clin Oncol 1990;8:1277–80 [DOI] [PubMed] [Google Scholar]
- 6.Wong TZ, Turkington TG, Hawk TC, Coleman RE. PET and brain tumor image fusion. Cancer J 2004;10:234–42 [DOI] [PubMed] [Google Scholar]
- 7.Spence AM, Mankoff DA, Muzi M. Positron emission tomography imaging of brain tumors. Neuroimaging Clin N Am 2003;13:717–39 [DOI] [PubMed] [Google Scholar]
- 8.Di Chiro G. Positron emission tomography using [18F] fluorodeoxyglucose in brain tumors. A powerful diagnostic and prognostic tool. Invest Radiol 1987;22:360–71 [DOI] [PubMed] [Google Scholar]
- 9.Patronas NJ, Di Chiro G, Kufta C, Bairamian D, Kornblith PL, Simon R, et al. Prediction of survival in glioma patients by means of positron emission tomography. J Neurosurg 1985;62:816–22 [DOI] [PubMed] [Google Scholar]
- 10.Mineura K, Sasajima T, Kowada M, Ogawa T, Hatazawa J, Shishido F, et al. Perfusion and metabolism in predicting the survival of patients with cerebral gliomas. Cancer 1994;73:2386–94 [DOI] [PubMed] [Google Scholar]
- 11.Padma MV, Said S, Jacobs M, Hwang DR, Dunigan K, Satter M, et al. Prediction of pathology and survival by FDG PET in gliomas. J Neurooncol 2003;64:227–37 [DOI] [PubMed] [Google Scholar]
- 12.Pardo FS, Aronen HJ, Fitzek M, Kennedy DN, Efird J, Rosen BR, et al. Correlation of FDG-PET interpretation with survival in a cohort of glioma patients. Anticancer Res 2004;24:2359–65 [PubMed] [Google Scholar]
- 13.Delbeke D, Meyerowitz C, Lapidus RL, Maciunas RJ, Jennings MT, Moots PL, et al. Optimal cutoff levels of F-18 fluorodeoxyglucose uptake in the differentiation of low-grade from high-grade brain tumors with PET. Radiology 1995;195:47–52 [DOI] [PubMed] [Google Scholar]
- 14.Chao ST, Suh JH, Raja S, Lee SY, Barnett G. The sensitivity and specificity of FDG PET in distinguishing recurrent brain tumor from radionecrosis in patients treated with stereotactic radiosurgery. Int J Cancer 2001;96:191–7 [DOI] [PubMed] [Google Scholar]
- 15.Kaur B, Tan C, Brat DJ, Post DE, Van Meir EG. Genetic and hypoxic regulation of angiogenesis in gliomas. J Neurooncol 2004;70:229–43 [DOI] [PubMed] [Google Scholar]
- 16.Kim CK, Alavi JB, Alavi A, Reivich M. New grading system of cerebral gliomas using positron emission tomography with F-18 fluorodeoxyglucose. J Neurooncol 1991;10:85–91 [DOI] [PubMed] [Google Scholar]
- 17.Perona P, Malik J. Scale-space and edge detection using anisotropic diffusion. IEEE Transactions on Pattern Analysis and Machine Intelligence 1990;12:629–39 [Google Scholar]
- 18.Muzi M, Freeman SD, Burrows RC, Wiseman RW, Link JM, Krohn KA, et al. Kinetic characterization of hexokinase isoenzymes from glioma cells: implications for FDG imaging of human brain tumors. Nucl Med Biol 2001;28:107–16 [DOI] [PubMed] [Google Scholar]
- 19.Varrone A, Sjoholm N, Eriksson L, Gulyas B, Halldin C, Farde L. Advancement in PET quantification using 3D-OP-OSEM point spread function reconstruction with the HRRT. Eur J Nucl Med Mol Imaging 2009;36:1639–50 [DOI] [PubMed] [Google Scholar]
- 20.Wang SX, Boethius J, Ericson K. FDG-PET on irradiated brain tumor: ten years' summary. Acta Radiol 2006;47:85–90 [DOI] [PubMed] [Google Scholar]
- 21.Pauleit D, Stoffels G, Bachofner A, Floeth FW, Sabel M, Herzog H, et al. Comparison of (18)F-FET and (18)F-FDG PET in brain tumors. Nucl Med Biol 2009;36:779–87 [DOI] [PubMed] [Google Scholar]
- 22.Pauleit D, Floeth F, Hamacher K, Riemenschneider MJ, Reifenberger G, Muller HW, et al. O-(2-[18F]fluoroethyl)-l-tyrosine PET combined with MRI improves the diagnostic assessment of cerebral gliomas. Brain 2005;128:678–87 [DOI] [PubMed] [Google Scholar]
- 23.Charron M, Beyer T, Bohnen NN, Kinahan PE, Dachille M, Jerin J, et al. Image analysis in patients with cancer studied with a combined PET and CT scanner. Clin Nucl Med 2000;25:905–10 [DOI] [PubMed] [Google Scholar]
- 24.Schifter T, Hoffman JM, Hanson MW, Boyko OB, Beam C, Paine S, et al. Serial FDG-PET studies in the prediction of survival in patients with primary brain tumors. J Comput Assist Tomogr 1993;17:509–61 [DOI] [PubMed] [Google Scholar]
- 25.Meyer PT, Schreckenberger M, Spetzger U, Meyer GF, Sabri O, Setani KS, et al. Comparison of visual and ROI-based brain tumour grading using 18F-FDG PET: ROC analyses. Eur J Nucl Med 2001;28:165–74 [DOI] [PubMed] [Google Scholar]
- 26.Tralins KS, Douglas JG, Stelzer KJ, Mankoff DA, Silbergeld DL, Rostomily RC, et al. Volumetric analysis of 18F-FDG PET in glioblastoma multiforme: prognostic information and possible role in definition of target volumes in radiation dose escalation. J Nucl Med 2002;43:1667–73 [PubMed] [Google Scholar]
- 27.Davis WK, Boyko OB, Hoffman JM, Hanson MW, Schold SC, Jr, Burger PC, et al. [18F]2-fluoro-2-deoxyglucose-positron emission tomography correlation of gadolinium-enhanced MR imaging of central nervous system neoplasia. AJNR Am J Neuroradiol 1993;14:515–23 [PMC free article] [PubMed] [Google Scholar]
- 28.Quarles CC, Krouwer HG, Rand SD, Schmainda KM. Dexamethasone normalizes brain tumor hemodynamics as indicated by dynamic susceptibility contrast MRI perfusion parameters. Technol Cancer Res Treat 2005;4:245–9 [DOI] [PubMed] [Google Scholar]
- 29.Roelcke U, Radu EW, von Ammon K, Hausmann O, Maguire RP, Leenders KL. Alteration of blood-brain barrier in human brain tumors: comparison of [18F]fluorodeoxyglucose, [11C]methionine and rubidium-82 using PET. J Neurol Sci 1995;132:20–7 [DOI] [PubMed] [Google Scholar]
- 30.Catana C, Procissi D, Wu Y, Judenhofer MS, Qi J, Pichler BJ, et al. Simultaneous in vivo positron emission tomography and magnetic resonance imaging. Proc Natl Acad Sci U S A 2008;105:3705–10 [DOI] [PMC free article] [PubMed] [Google Scholar]