

Abstract
Objectives
The aim of this study was to determine the disease-specific distribution of brain metastases and, using radiobiological modelling, estimate how these anatomical tendencies might be exploited when delivering prophylactic whole-brain radiotherapy for small cell lung cancer in complete remission.
Methods
Disease-specific brain metastasis atlases were created by mapping brain metastases to a standard image set from a database of patients who were to receive external beam radiation therapy. The specific diseases investigated included lung (both small cell and non-small cell), breast, renal and gynaecological cancers as well as melanoma. Radiobiological modelling was used to estimate how much improvement, in terms of the metastasis-free rate at 3 years, might be possible with non-uniform dose distributions if there are spatial biases in the incidence of micrometastases from small cell lung cancer.
Results
For lung and breast cancer, there was an increased probability of cerebellar metastases compared with what would be predicted based solely on brain volume. This trend was not evident for renal cancer, gynaecological malignancies or melanoma.
Conclusion
Radiobiological models suggest that if there is a non-uniform distribution of microscopic brain metastases in patients with small cell lung cancer, higher population-based metastasis-free rates might be achievable with non-uniform irradiation compared with the same integral whole-brain dose delivered as a uniform prescription.
The brain is a common site of metastases for a variety of cancers, and some reports have shown that there are regions of the brain where metastases are more prevalent, particularly the posterior fossa. Delattre et al [1] have studied the distribution of brain metastases and found that posterior fossa metastases are more likely in patients with pelvic (prostate and uterus) and gastrointestinal primaries, as compared with other primary sites: they reported a 53:47 ratio between the posterior fossa and cerebrum for solitary metastasis from pelvic disease. Tsukada et al [2] investigated the distribution of central nervous system metastases in breast cancer and found a predilection for posterior fossa metastases compared with the cerebrum: they reported a 45:55 ratio for involvement of metastases in these two regions, respectively. In addition, recent work by Ghia et al [3] showed an increased prevalence of cerebellar metastases in a group of 100 patients with brain metastases from various primary disease sites.
We aim to compare these findings with a database of 163 patients and to explicitly study the three-dimensional spatial distribution of brain metastases, with particular interest in the prevalence of posterior fossa (or, more narrowly, cerebellar) metastases for different disease types. If there is a significant bias for metastases to develop in certain brain regions, it might be possible to take advantage of this when delivering prophylactic whole-brain radiotherapy by redistributing the dose to preferentially irradiate these higher risk regions.
In order for this so-called “dose painting” or “dose redistribution” approach to work, three factors are required. Firstly, information is needed about the risk for recurrence. For our work here, we use the three-dimensional information about the incidence of metastases as a surrogate for this information; however, a more direct approach for future studies would be to map out recurrences after prophylactic cranial irradiation (PCI) for small cell lung cancer (SCLC) in complete remission. Secondly, one needs to be able to constrain the doses in some way such that a comparison between a “painted” dose distribution and a uniform one is unbiased. For this we will constrain the integral dose when comparing these dose distributions. Thirdly, we need information about the dose-response relationship. A meta-analysis from 1999 suggested that there is a dose-response relationship in terms of metastasis-free rates (although none was found for survival) for PCI of SCLC in complete remission [4]. However, a more recent randomised trial comparing 25 Gy in 10 fractions vs 36 Gy in either 18 daily fractions or 24 twice-daily fractions did not demonstrate a difference in terms of the 2-year brain metastasis-free rate [5]. Even more surprising is that there was a detriment in overall survival in the higher dose group. The reasons for this observation are unclear, but higher thoracic recurrence is probably related. As noted by the authors, interpretation is complicated by the fact that the details of thoracic radiation were not collected in the trial. One statistically significant benefit from dose escalation was a decrease in the first isolated brain failure; there was an absolute decrease of 6% at 2 years. Nevertheless, in combining the information from these two sources we are able to obtain an estimate for the dose-response relationship for PCI in SCLC in complete remission.
Methods and materials
MRI scans of patients wherein the brain metastases had been contoured were all mapped to a single image set, the International Consortium for Brain Mapping (ICBM) template image [6], using contour-based deformable image registration. The gross contour of the brain was used to drive the deformation so that after deformation the outside shape of any given patient’s brain matched that of the ICBM template. Before registration with other patients, the ICBM image was scaled by a factor of 0.9 in all three dimensions, because the volume of the brain in this template image is unusually large, as has been noted by others [7]. Deformable image registration was performed as previously described [8]. A total of 163 patients who were to receive whole-brain radiotherapy, stereotactic radiosurgery or both for brain metastases were included in the study. The year during which the post-contrast T1 weighted MRI scan was taken ranged from 2000 to 2007. All MR images that were available in our database were used with one exception: 1 patient had in excess of 200 metastases and individual identification of the metastases was not possible owing to the ambiguity of whether or not some metastases were isolated or comprised multiple confluent metastases.
After mapping to the ICBM template, each brain metastasis as contoured in an individual patient was converted into an image mask. The masks have a zero image value outside the metastasis and a constant value inside the metastasis such that the sum of all voxel values is one. This ensures an equal contribution of every metastasis to the atlas. For each disease, all of the individual metastasis image masks for that disease were added together, forming a brain metastases atlas. One atlas was constructed for each disease type, although combinations of atlases were created for some of the analysis. More details on the atlas construction appear in Appendix 1.
In order to address the question of whether the distribution of brain metastases depended on whether a patient had a solitary or multiple metastases, the prevalence of cerebellar metastases for patients with solitary metastases and multiple metastases were determined separately.
Radiobiological modelling for non-uniform dose prescriptions
A model for responses to non-uniform dose distributions can be derived if one assumes that any given micrometastasis has a probability of residing in a certain region of the brain that mirrors the prevalence found in our database. Note that the validity of this assumption will be discussed separately from the modelling that follows. If there is no difference between the prevalence of cerebellar metastasis for patients with solitary and multiple metastases, we can model each micrometastatic event as statistically independent. We will take two limiting approaches to dealing with reseeding, which are discussed in detail later.
The following two assumptions are being made in the derivation of our dose-response model. Firstly, we assume that for the available dose-response data the delivered dose to the brain is uniform. This is true to a first approximation, although modest dose heterogeneity of 3–4% is observed with standard opposed lateral fields using a 6 MV beam. Secondly, we assume that, averaged over the population, the dose response for a particular micrometastasis does not vary with its location in the brain.
To generate a model of total brain tumour control probability (TCP) for a population of patients treated with a non-homogeneous brain radiation dose, we defined the observed whole-brain TCP for a given homogeneous dose as TCPOBS(d). Defining the TCP of a single metastasis at dose d as TCP1(d), total brain control for n micrometastases can be found as follows:  . To account for multiple micrometastases, total brain TCP for a given uniform dose, d, is then:
 |
(1) |
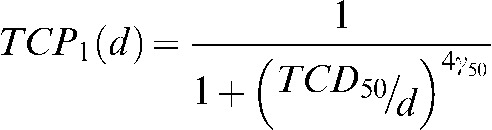
Pr(n) represents the probability that a given patient in the population has n micrometastases. Appendix 2 describes how an estimate for Pr(n) for a population of patients can be obtained. We use the following phenomenological model for TCP1(d) that has been used elsewhere [9]:
 |
(2) |
The parameters TCD50 and γ50 are used as fitting parameters with Equation 2 substituted into Equation 1. A meta-analysis of trials from Aupérin et al [4] comparing PCI with no PCI provides some dose-response data for the nominal range of 8–38 Gy. Additionally, data from the trial reported by Le Péchoux et al [5] were used. Because this trial compared two dose schedules for PCI and did not include a non-PCI control group, the brain metastasis rate without PCI was assumed to be the same as it was in the earlier meta-analysis reported by Aupérin et al (58.6%) [4]. For the purposes of this work, the linear quadratic model was used to convert delivered doses to equivalent doses in 2.5 Gy fractions using an α/β ratio of 10 Gy. Each data point was weighted by the number of patients in the treatment group for each dose level for the TCP model fit shown below. Appendix 3 describes how the clinical dose-response data, expressed as the relative risk for brain metastasis at 3 years, is converted into TCP. This conversion is different depending on whether one considers reseeding or not.
We model the population-based TCP for an inhomogeneous dose distribution by considering each metastasis and the corresponding local dose separately. We divide the brain into R subvolumes, each with a fractional volume νi and local dose di. For each of these subvolumes, there is a probability ai that any given micrometastasis will be in that subvolume. The law of total probability allows us to calculate the TCP for a population of patients with a single metastasis of unknown location and, considering each micrometastasis independently, we raise this value to the Nth power for a patient with N metastases:
 |
(3) |
To account for varying numbers of micrometastases, we create a weighted average to predict the population-based TCP using the assumed probability distribution for the number of micrometastases Pr(n) and arrive at the following:
 |
(4) |
where Nmax is the maximum number of possible metastases in the model, which we chose to be 10 for our estimate for Pr(n). Note that Equation 4 devolves to Equation 1 if the dose di is the same for all subvolumes.
We constrain the average dose in the brain to be a given nominal value D and optimise the TCP by varying di:
 |
(5) |
where νi is the fractional subvolume of structure i and di is the local dose in that volume. Finally, we choose to use an additional constraint and limit the dose in any subregion to 45 Gy.
Results
Brain metastasis atlases
The number of patients and total number of metastases for each disease type is shown in Table 1. Lateral projections of four different brain metastasis atlases are shown in Figure 1. For lung cancer, there is a statistically significant bias for cerebellar metastases compared with what one would predict based solely on relative brain volume (11.3% of the non-ventricular brain volume as determined using the ICBM template). There is also a statistically significant bias for cerebellar metastases in breast cancer.
Table 1. Number of patients and metastases by disease type.
| Disease type | Number of patients | Number of metastases | Patients with a solitary lesion (%) |
| Breast cancer | 30 | 118 | 36.7 |
| NSCLC | 63 | 174 | 38.1 |
| SCLC | 22 | 53 | 45.5 |
| Renal cancer | 11 | 43 | 45.5 |
| Gynaecological cancer | 8 | 38 | 62.5 |
| Melanoma | 29 | 73 | 48.3 |
| Total | 163 | 499 | 42.3 |
NSCLC, non-small cell lung cancer; SCLC, small cell lung cancer.
Figure 1.

Lateral projections of brain metastasis atlases, as an overlay on the projection of the MRI image set on which the atlases are defined, illustrating the difference found between different disease types in terms of the prevalence of metastases in certain regions. The colour scale represents the relative prevalence of brain metastasis, which has been saturated at 5.5 for this figure. The image in the top left panel is the case for a hypothetical uniform distribution of brain metastases used for comparison with the other panels; in this image the relative prevalence of brain metastasis is equal to one everywhere by definition. The top right panel is for renal and gynaecological malignancies in addition to melanoma. The lower left panel is for breast cancer and the lower right panel is for lung cancer (both small cell and non-small cell).
Figure 2 shows the percentage of metastases in the cerebellum separated by disease type. A horizontal line is drawn representing the relative volume of the cerebellum, numerically equal to the percentage of metastases that would be found if the distribution of metastases were uniform throughout the entire brain. For each disease, a bias for cerebellar metastases is evident if the 95% confidence interval for the observed proportion of metastases does not cross this horizontal line. If one considers the posterior fossa instead of the cerebellum, the qualitative results remain the same (data not shown). For each disease type, no statistically significant difference was found between solitary and multiple metastases.
Figure 2.

Prevalence of cerebellar metastasis for the disease types considered. The error bars represent 95% confidence intervals based on the binomial distribution. A horizontal line is drawn representing the relative volume of the cerebellum (i.e. the prevalence that would be found given a uniform distribution of metastases throughout the entire brain). The bar labelled “All” combines all diseases; the bar labelled “Lung” combines results for both small cell lung cancer (SCLC) and non-small cell lung cancer (NSCLC). The bars were determined by reviewing all patient images and represent the exact value found in our database; the “X” marks were determined using the brain metastasis atlases by finding the sum of all voxel values within the cerebellum structure in the respective atlas and dividing by the sum of all voxel values in the entire atlas. The latter approach is subject to registration uncertainty. Gyn, gynaecological.
Figure 3 shows the estimated percentage of metastases found within 5, 10 and 15 mm envelopes of the hippocampus. This assessment was accomplished using the brain metastasis atlas for all diseases combined and was not based on individual hippocampus contours for each patient; thus, it is subject to registration uncertainties. The statistical significance of these biases (determined analogously as with Figure 2) in all hippocampal regions is lost when considering lung cancer exclusively, with the exception of the hippocampus +15 mm region.
Figure 3.

The estimated prevalence of metastases near the hippocampus, considering all diseases together. The three horizontal bars represent estimates for the volumes of the 5, 10 and 15 mm expansions of the hippocampus (i.e. the prevalence that would be found given a uniform distribution of metastases throughout the entire brain). The error bars represent 95% confidence intervals based on the binomial distribution, but do not reflect additional registration uncertainties.
Radiobiological modelling
The fit for the dose-response model when considering maximal reseeding is shown in Figure 4, where the dashed curve shows a single metastasis TCP model with a TCD50 of 8.87 Gy (in 2.5 Gy fractions) and a γ50 of 0.468. The solid curve shows the resulting population-based metastases TCP, determined from Equations 1 and 2, and the assumed Pr(n). The data points marked with squares represent data from the 1999 meta-analysis [4]; the data points marked with circles are from the 2009 randomised trial [5].
Figure 4.

Modelled tumour control probability in the presence of maximal reseeding (Ps = 0.158, see text). The solid line represents the population-based tumour control probability TCPOBS(d) as in Equation 1, whereas the dashed line is the single-metastasis tumour control probability TCP1(d) as in Equation 2. Clinical data from Aupérin [4] and Le Péchoux [5] appear as the square and circular data points, respectively. The error bars represent 95% confidence intervals, which were clipped to a minimum tumour control probability (TCP) of 0 and maximum TCP of 1. The fitting parameters for the single metastasis TCP (dashed line) are TCD50 = 8.87 Gy, γ50 = 0.468. PCI, prophylactic cranial irradiation; SCLC, small cell lung cancer.
The parameter νi is 0.1127 for the cerebellum (calculated as the volume of the cerebellum in the ICBM template divided by the non-ventricular brain volume) and 0.0267 for the hippocampus after a 5 mm isotropic expansion. These numbers are used for the following modelling results.
For a case where the prevalence of metastases in the cerebellum is 0.256 (the value for lung cancer in our database) and 0.0072 for the hippocampus (also for lung cancer), the optimal choice of dose in this model is shown in Figure 5 when maximal reseeding is considered. The corresponding modelled relative risk for brain metastases at 3 years and the change in relative risk compared with a uniform dose is shown in Figure 6 in the top and bottom panels, respectively. This figure shows three dose–response curves: one is for uniform irradiation (thin solid line); the second is for uniform irradiation with hippocampal sparing (dashed line); and the third is for hippocampal sparing and a simultaneous optimised redistribution of dose between the cerebellum and elsewhere in the brain (thick solid line) based on the doses in Figure 5.
Figure 5.

The optimised dose in the cerebellum (thick solid line) and outside the hippocampus +5 mm and cerebellar regions (dashed line) is shown as a function of the average dose outside of the hippocampus +5 mm region. The best estimate for the prevalence of metastases in the hippocampus +5 mm region (0.0072) and the best estimate for the prevalence of metastases in the cerebellum (0.256) were used. The estimates for prevalence in the different regions are based on the data for lung cancer (small cell lung cancer and non-small cell) and maximal reseeding is considered. A line representing a uniform whole brain dose is drawn for reference (thin solid line).
Figure 6.

The relative risk for brain metastases at 3 years (top panel) and the change in relative risk as a function of the average dose outside of the hippocampus +5 mm region (lower panel) is shown. The best estimate for the prevalence of metastases in the hippocampus +5 mm region (0.0072) and the best estimate for the prevalence of metastases in the cerebellum (0.256) were used. The estimates for prevalence in the different regions are based on the data for lung cancer (small cell lung cancer and non-small cell) and maximal reseeding is considered. RR, relative risk; hipp., hippocampus.
If one is interested in boosting the dose to the cerebellum without reducing the dose elsewhere, Figures 5 and 6 can still be used for determining optimal doses and estimates for relative risk. For example, for a brain dose (outside the cerebellum and hippocampus +5 mm regions) of 25 Gy, one starts by finding where the dashed curve reaches 25 Gy on the vertical axis in Figure 5. Next, the corresponding average dose is found on the horizontal axis yielding a dose of 26.4 Gy and the cerebellar dose corresponding to this value is then found by reading it off the vertical axis (thick line), yielding a value of 36.8 Gy. Given this average dose outside of the hippocampus +5 mm region of 26.4 Gy, one can read in Figure 6 what the predicted change in relative risk is for that dose (thick line).
Table 2 shows modelling results for cases where the average dose is 25 Gy. The optimised doses and changes in the relative risk for brain metastases at 3 years are shown for a variety of modelling parameters. The average prevalences for brain metastases in different regions are used for two columns, and the results can be compared in the other columns with a “worst case” scenario where the upper 95% confidence level is assumed for the prevalence of metastases within 5 mm of the hippocampus and the lower 95% confidence level is assumed for the prevalence of metastases in the cerebellum. In addition, hippocampal sparing and the optimisation of dose between the cerebellum and elsewhere are considered both separately and together.
Table 2. Influence of hippocampal sparing and dose optimisation in terms of relative risk for brain metastases at 3 years with a prescription dose of 25 Gy.
| Hippocampal sparing? | Optimised doses? | Maximal reseeding |
Neglecting reseeding |
|||
| Average prev | Worst prev | Average prev | Worst prev | |||
| No | Yes | Optimal cerebellar dose (Gy) | 34.9 | 31.4 | 39.8 | 34.5 |
| Optimal cerebral dose (Gy) | 23.7 | 24.2 | 23.1 | 23.8 | ||
| Change in RR compared with uniform dose | −0.90% | −0.40% | −1.35% | −0.50% | ||
| Yes | Yes | Optimal cerebellar dose (Gy) | 35.0 | 31.8 | 40.0 | 35.1 |
| Optimal cerebral dose (Gy) | 23.7 | 24.1 | 23.0 | 23.7 | ||
| Change in RR compared with uniform dose | 0.10% | 3.50% | −0.70% | 1.85% | ||
| Change in RR owing to dose optimisation | −0.90% | −0.40% | −1.30% | −0.57% | ||
| Yes | No | Change in RR compared with uniform dose | 1.00% | 3.90% | 0.60% | 2.42% |
prev, prevalence; RR, relative risk.
Discussion
For lung and breast cancer, we found an increased probability of cerebellar metastases compared with what would be predicted based solely on brain volume; however, this trend was not evident for renal cancer, gynaecological malignancies or melanoma. Our radiobiological modelling suggests that if there is truly a non-uniform distribution of microscopic brain metastases in patients with SCLC; higher population-based metastasis-free rates might be achievable with non-uniform irradiation compared with the same integral whole-brain dose delivered as a uniform prescription. Note that whether or not there is a bias for cerebellar recurrence after PCI for SCLC is something that we cannot determine conclusively from the current study.
It is important to note that one issue in the interpretation of the results presented in this work would be a selection bias: patients in our database were those who were to receive radiation therapy for brain metastases and will therefore not necessarily be representative of a different population. Future studies will need to determine the nature and magnitude of such regional biases in brain metastases, if they exist, in the relevant population.
We did not detect a bias for cerebellar metastases for gynaecological malignancies, which is not in agreement with the results reported by Delattre et al [1]; these authors found a ratio of posterior fossa metastasis to cerebral metastasis of 53%/47%. This observation could be explained, in part, by the inclusion of only solitary metastases from pelvic primaries (gynaecological, prostate and gastrointestinal) rather than any number of metastases from gynaecological malignancies as described here. It should be noted that the upper 95% confidence limit for the bias for cerebellar metastasis from gynaecological malignancies in our database is significantly below 53%, this also being true when considering the entire posterior fossa instead of just the cerebellum. However, in the present study, there were only eight patients with brain metastases from gynaecological primaries. Our results for breast cancer are in qualitative agreement with those of Tsukata et al [2]. Solitary and multiple metastases in their study displayed similar biases, which is consistent with our results.
On the basis of the literature one would expect to find metastases near white–grey matter junctions, regions that receive a relatively high blood supply or at the distal ends of arterioles. For our work here, however, we are unable to assess whether this is the case. This is the result of registration uncertainties; these particular regions in the brain are spatially complicated and cannot be tracked accurately during the deformable registration process. Because of this, we make no attempt to assess the prevalence of metastases in these particular regions.
Several potential implications can be drawn from these data. Table 2 shows that, depending on model parameters, the improvement in the relative risk for brain metastases at 3 years is 0.4–1.35% when optimising the dose differential between the cerebellum and elsewhere. The optimised dose in the cerebellum ranges from 31.4 Gy to 39.8 Gy, with the corresponding dose elsewhere ranging from 23.1 Gy to 24.2 Gy. The detriment in relative risk for brain metastases when sparing the hippocampus +5 mm region ranges from 0.6% to 3.9%. Two limiting possibilities for the influence of metastatic reseeding in the brain were considered (Appendix 3) in an attempt to elucidate the variation that an unknown reseeding rate could introduce into the modelling results.
There is a significant amount of uncertainty in the modelling approach used here. The dose–response curve, the influence of metastatic seeding after PCI, the estimated number of micrometastases, the actual prevelances of metastases in the various subregions that would be encountered in the relevant population and the relevance of optimisation based on average dose only are some of the considerations. For this reason we consider the TCP and optimal dose estimates above as an indication of what might be possible with rationally designed, non-uniform dose distributions if there are spatial biases for recurrence after PCI. On the basis of these results, it would be of interest to create a brain metastasis atlas based on recurrences after PCI for SCLC in complete remission. Given that information, further refinements in the radiobiological modelling could be performed in order to obtain better estimates for what gains in terms of brain metastasis free rates, if any, could potentially be achieved with a non-uniform dose prescription. Although the models studied here consider only a few regions of the brain, the method can be extended to include multiple structures. For example, as the 15 mm envelope around the hippocampus might be at a lower risk for metastasis when considering all diseases, if this turns out to be true in a particular population the dose in this region could be adjusted down as part of the optimisation process. An additional topic for future work would be to derive a three-dimensional prescription function instead of using multicompartment models and to base the modelling studies on physically deliverable dose distributions optimised with commercially available treatment planning systems.
Conclusion
We have shown that, for breast and lung cancer, brain metastases occur more frequently in the cerebellum than one would expect based only on its volume. If such a regional bias exists in the population of people who receive prophylactic cranial irradiation for SCLC, whether in the cerebellum or elsewhere, it might be advantageous to deliver a higher dose to the high-risk regions as compared with the rest of the brain, even if the dose in the rest of the brain is reduced to keep the average dose the same. Future studies are needed to better define these regional biases for recurrence after PCI for SCLC.
Acknowledgments
This work was supported in part by the National Institutes of Health Grants R01-CA109656, R01-CA118365 and T32-CA09206-31. We would like to thank Dr Cécile Le Péchoux and Dr Anne Aupérin for their assistance with the dose–response data used in this manuscript and Dr Kevin Kozak for his helpful comments.
Appendix 1: Atlas construction
Brain metastasis atlases were constructed as follows. Firstly, a brain structure is defined by combining all structures in the International Consortium for Brain Mapping (ICBM) atlas with the ventricles subtracted out. Secondly, each metastasis in the atlas is clipped to be inside this brain structure and the intensity of the mask is re-normalised to a sum of 1. The normalisation to 1 is done for all metastases to ensure an equal contribution of each metastasis to the atlas regardless of size. (Note that none of the metastases fell completely outside of the ICBM brain structure or completely within the ventricles after registration.)
When displaying the atlases in the figures shown here, the atlases are smoothed with a Gaussian kernel having a full width at half maximum value of 10 mm in all dimensions. This smoothing was done to eliminate the sharp edges in the atlas and to distribute the very large image intensity associated with small metastases. Although some spatial information is lost in the smoothing process, the accuracy of intersubject registration is likely on the order of 5–10 mm, as was found previously for intersubject registration of the hippocampus [8]. Finally, lateral projections of these atlases were constructed to enable visualisation in two dimensions for the figures reported here, after which the intensities were normalised to account for varying thicknesses of the brain as viewed laterally. This normalisation was done such that a uniform distribution of brain metastases would appear as a uniform intensity in these lateral projections. Therefore, regions in the projections that have high image intensities (shown as “hotter” colours) reflect an increased bias for brain metastasis for those regions.
The prevalence of metastases in certain regions of the brain can be determined using the anatomical labels that are associated with the ICBM template. The number of metastases in any given region is the sum of all voxel values in the brain metastasis atlas for that region. When a given metastasis is partially contained within a region, the fraction of the volume of that metastasis is counted. In this way, the effective point of origin of the metastasis is assumed to have a uniform probability distribution across the entire metastasis. Although there might be alternative ways of estimating the effective point of origin, given the uncertainties in intersubject registration, we choose for this work to assume an equal probability for each point within the metastasis.
Appendix 2: Discrete distribution function for the number of micrometastases
An estimate of Pr(n) can be formulated based on the observed proportions for the number of brain metastases of lung cancer patients in our database. For this we have used an extended database of lung cancer patients, with a total of 193 patients with either small cell lung cancer or non-small cell lung cancer. We found that 77 patients had a single metastasis, 42 had 2 metastases, 22 had 3, 18 had 4, 11 had 5, 8 had 6, 7 had 7, 3 had 8, 3 had 9 and 2 had 10. Assuming that the proportion of viable micro brain metastases that yield clinically observable brain metastasis scales with the observed proportions for the number of visible brain metastases, we propose the following discrete functional form for the estimated proportions for the number of micro brain metastases:
| (A1) |
The free parameter α in Equation A1 can be used to fit Pr(n) to the observed proportions of the number of visible brain metastases. The discrete distribution function proposed in Equation A1 has the form of a Weibull distribution function. The Weibull distribution has been used in survival analysis in the case of a time-dependent hazard rate and in reliability analysis to study the time to first failure. Figure 7 shows the proportion of the number of observed brain metastases as compared with the proportion of the number of brain metastases as predicted by Equation A1 using a value of α = 1/μ, where μ denotes the average number of brain metastases observed per patient in our population of lung cancer patients, which is equal to 2.70. This yields a fit to the observed proportions of the number of visible brain metastases that is valid to n = 12, although we choose here to truncate it at n = 10 and normalise.
Figure 7.

Fit to observed proportions of the number of brain metastases using α = 1/μ. The circles represent the observed proportion of brain metastases, whereas the solid line is the empirical fit. Note that the Weibull fit is discrete, but it is drawn as a continuous line to aid visualisation.
Appendix 3: Relative risk, tumour control probability and reseeding
In this report we define the term tumour control probability (TCP) as the probability of controlling a given micrometastasis, given that it exists in the patient in question. Deriving a relationship between the relative risk (RR) for brain metastases at 3 years and the TCP requires one to make assumptions about reseeding. We will consider two limiting scenarios, one assuming that no reseeding occurs and one with an estimate of the maximum possible rate of reseeding.
Neglecting reseeding
In the absence of reseeding, the relationship between TCP and RR is derived below. Let the brain metastasis rate at 3 years without treatment be Po and let the rate with treatment be Pt. The relative risk for brain metastases is defined as the ratio RR = Pt /Po. In order to have brain metastases at 3 years, a surviving patient needs to have viable microscopic brain metastases before treatment and, furthermore, to fail treatment for at least one of them:  . Thus, TCP = 1–RR.
Including reseeding
The relationship between relative risk and TCP becomes more complicated if reseeding is considered. In this case we need to break down the probability of developing brain metastases post treatment, Pt, into components from recurrence and reseeding. Let the probability of recurrence be Pr, the probability of reseeding be Ps and the probability of both occurring simultaneously be Prs. For a given patient who has developed brain metastases at up to 3 years after treatment, there could have been recurrence, reseeding, or both. Therefore, we have:
| (A2) |
Equation A2 assumes that reseeding and recurrence are independent events. This might not be true, as recurrent lesions can lead to reseeding elsewhere in the brain. However, for the purpose of our modelling we can assume this to be true as a patient with recurrent disease is counted as a failure regardless of whether or not the recurrent lesion leads to reseeding elsewhere in the brain. Hence, Ps is the probability of reseeding brain metastases owing to uncontrolled or recurrent primary disease or extracranial metastases. With the assumption that recurrence and reseeding are independent events, Equation A2 becomes:
| (A3) |
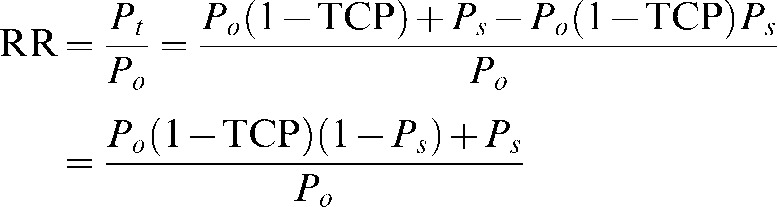
The probability of recurrence Pr is equal to the probability of originally having viable microscopic brain metastasis prior to treatment times the probability of treatment failure or Po(1-TCP). The RR can consequently be determined as follows:
 |
(A4) |
After some straightforward algebra one finds the following equation for TCP:
 |
(A5) |
Note that Equation A5 devolves to TCP = 1–RR if the reseeding rate is taken to be zero, hence for the case when maximal reseeding is considered one arrives at a TCP curve that is a vertically shifted and a scaled version of the TCP curve when reseeding is neglected. The reseeding rate in the actual population is unknown, but we estimate the maximum possible rate by assuming that the brain metastasis incidence at 3 years in the highest dose group in our dose response data is entirely due to reseeding. For the 1999 meta-analysis [4], the relative risk for brain metastases at 3 years in the highest dose group was 0.27. Given a Po of 0.586 from their data, the brain metastasis incidence after treatment Pt is 0.158. If we assume that all metastases are due to reseeding at this dose level and that Pr = 0, we have Ps = 0.158 as our upper limit. Because of the functional form of Equation A5, for intermediate values of Ps the TCP will also take intermediate values. Specifically, the upper and lower limits for Ps give rise to corresponding lower and upper limits for the TCP at a given dose, respectively.
We also assume for this work that the reseeding rate is independent of dose (i.e. that the reseeding of brain metastases is not affected by the prior radiation dose to the brain). The error bars in the dose response plot in Figure 6 were clipped to a maximum TCP of 1 and a minimum TCP of 0.
Dose response with and without reseeding
Given a relationship between TCP and RR, we can fit dose response curves for TCP using the available data for RR. Table 3 shows the TCP and RR for the given dose levels in both the absence of reseeding and in the presence of maximal reseeding (Ps = 0.158). The radiobiological modelling is done in terms of TCP, but results can be translated back into RR using Equation A5.
Table 3. Clinical dose response data showing both the relative risk for brain metastases at 3 years and the tumour control probability.
| Dose in 2.5 Gy fractions | Reference | RR for brain metastasis (at 3 years) | TCP (no reseeding) | TCP (maximal reseeding) |
| 11.5 | [4] | 0.760 | 0.240 | 0.418 |
| 25.5 | [4] | 0.520 | 0.480 | 0.703 |
| 31.2 | [4] | 0.340 | 0.660 | 0.917 |
| 36.5 | [4] | 0.270 | 0.730 | 1.000 |
| 25.0 | [5] | 0.543 | 0.457 | 0.676 |
| 33.8 | [5] | 0.481 | 0.519 | 0.749 |
RR, relative risk; TCP, tumour control probability.
References
- 1.Delattre JY, Krol G, Thaler HT, Posner JB. Distribution of brain metastases. Arch Neurol 1988;45:741–4 [DOI] [PubMed] [Google Scholar]
- 2.Tsukada Y, Fouad A, Pickren JW, Lane WW. Central nervous system metastasis from breast carcinoma. Autopsy study. Cancer 1983;52:2349–54 [DOI] [PubMed] [Google Scholar]
- 3.Ghia A, Tome WA, Thomas S, Cannon G, Khuntia D, Kuo JS, et al. Distribution of brain metastases in relation to the hippocampus: implications for neurocognitive functional preservation. Int J Radiat Oncol Biol Phys 2007;68:971–7 [DOI] [PubMed] [Google Scholar]
- 4.Aupérin A, Arriagada R, Pignon JP, Le Pechoux C, Gregor A, Stephens RJ, et al. Prophylactic cranial irradiation for patients with small-cell lung cancer in complete remission. Prophylactic Cranial Irradiation Overview Collaborative Group. N Engl J Med 1999;341:476–84 [DOI] [PubMed] [Google Scholar]
- 5.Le Péchoux C, Dunant A, Senan S, Wolfson A, Quoix E, Faivre-Finn C, et al. Standard-dose versus higher-dose prophylactic cranial irradiation (PCI) in patients with limited-stage small-cell lung cancer in complete remission after chemotherapy and thoracic radiotherapy (PCI 99-01, EORTC 22003-08004, RTOG 0212, and IFCT 99-01): a randomised clinical trial. Lancet Oncol 2009;10:467–74 [DOI] [PubMed] [Google Scholar]
- 6.Holmes CJ, Hoge R, Collins L, Woods R, Toga AW, Evans AC. Enhancement of MR images using registration for signal averaging. J Comput Assist Tomogr 1998;22:324–33 [DOI] [PubMed] [Google Scholar]
- 7.Lancaster JL, Tordesillas-Gutierrez D, Martinez M, Salinas F, Evans A, Zilles K, et al. Bias between MNI and Talairach coordinates analysed using the ICBM-152 brain template. Hum Brain Mapp 2007;28:1194–205 [DOI] [PMC free article] [PubMed] [Google Scholar]
- 8.Bender ET, Mehta MP, Tome WA. On the estimation of the location of the hippocampus in the context of hippocampal avoidance whole brain radiotherapy treatment planning. Technol Cancer Res Treat 2009;8:425–32 [DOI] [PMC free article] [PubMed] [Google Scholar]
- 9.Kim Y, Tome WA. Risk-adaptive optimization: selective boosting of high-risk tumor subvolumes. Int J Radiat Oncol Biol Phys 2006;66:1528–42 [DOI] [PMC free article] [PubMed] [Google Scholar]