

Abstract
The introduction of modern dual-energy CT (DECT) scanners has enabled contrast material to be distinguished at imaging without the need for a separate unenhanced scan. Images of pulmonary parenchymal contrast enhancement obtained using DECT improve the detection of defects, augmenting our ability to detect pulmonary emboli; however, with these advances new pitfalls are also introduced. In this pictorial review, we present the technique, clinical applications and causes and remedies of false results of dual-energy pulmonary parenchymal enhancement defects in pulmonary embolism.
More than 650, 000 cases of pulmonary embolism (PE) are reported each year, resulting in an estimated 300, 000 annual fatalities. This level of occurrence ranks PE as the third leading cause of death in the USA [1, 2]. Multidetector CT (MDCT) pulmonary angiography has now largely replaced ventilation/perfusion scintigraphy and conventional pulmonary angiography for the evaluation of possible PE [3]; in 2007, MDCT angiography was accepted as the reference standard for diagnosis of acute PE [4]. Unfortunately, conventional MDCT angiography only provides morphological information and its ability to assess subsegmental pulmonary arteries is variable: sensitivities range from 37–96% [5]. The ability to assess subsegmental pulmonary arteries has increased with advances in MDCT technology.
Dual-source CT (DSCT), which uses two orthogonally mounted X-ray tubes and detectors to double the speed of image acquisition, was primarily intended to achieve high temporal resolution for cardiac imaging [6–8]. As each tube can be set at a different tube potential (e.g. 80 kVp for one tube and 140 kVp for the other), DSCT also allows for simultaneous dual-energy CT (DECT) image acquisition and largely excludes the need for interscan changes in contrast enhancement or patient movement between CT acquisitions [9–11]. DECT data can be readily post-processed to determine the amount of iodinated contrast material in any voxel. This is because iodine, as compared with soft tissue, attenuates X-ray spectra very differently at 80 kVp and 140 kVp settings. The image data from both energy levels are combined to form a hybrid image that is equivalent to a scan acquired at 120 kVp, which can be used for diagnostic evaluation of morphology and anatomy. In combination with the iodine map, which is related to the microvascular circulation in the lung, this scan can provide morphological and functional information, thus improving the CT assessment of subsegmental pulmonary arteries.
The term “perfusion” is ambiguous in DECT; although it is frequently strictly defined as “the volume of blood flowing through a cubic centimetre of tissue per second” [12], it has been used more loosely in many publications on pulmonary emboli to refer to visible pulmonary enhancement with injected contrast material. In this looser application, the term lung “perfusion” at DECT does not correspond to blood flow analysis per se. Instead, this term refers to the iodine enhancement at one point in time, which approximates to the pulmonary blood flow or microcirculation [13]. Thus, we will not use the term “perfusion” to describe the DECT pulmonary iodine maps, but instead opt for “contrast enhancement”. In our review, we present the techniques, clinical applications, drawbacks and remedies of DECT in the diagnosis, prognosis and follow-up of PE.
Scanning techniques and image analysis
DECT examinations were performed on a DSCT scanner (Somatom Definition, Siemens Medical Solutions, Forchheim, Germany). Patients were centrally placed in the scanner to ensure that the entire pulmonary parenchyma was covered by the smaller field-of-view of the second tube detector array (the maximum field-of-view of the second tube detector array is 260 mm). In patients with a large body habitus, peripheral lesions can be excluded because data are only acquired by the second tube detector inside this area; thus, dual-energy data manipulation can only be performed in this area. In second-generation DSCT scanners, however, this configuration has been modified with a tube B detector that now covers a 33 cm diameter field-of-view, thus avoiding the previously encountered limitations of dual-energy post-processing for large patients [14]. A contrast-enhanced CT pulmonary angiography (CTPA) scan in dual-energy mode was obtained following the injection of a bolus of iodine contrast medium (Omnipaque, General Electric Healthcare, Milwaukee, WI) followed by a 40 ml saline flush into the antecubital vein via an 18-gauge catheter at 4 ml s–1. Tables 1 and 2 summarise the DECT pulmonary angiography scan protocol details [15]. The radiation dose of dual-energy pulmonary CT was not higher than that of single-source CTPA [16].
Table 1. Scan parameters of intravenous contrast-enhanced portion of dual-energy pulmonary CT angiography.
| Scan mode | Spiral dual-energy with dual source |
| Scan area | Diaphragm to lung apex |
| Scan direction | Caudo-cranial/ cranial-caudo |
| Scan time (s) | 10 |
| Tube voltage A/B (kVp) | 140/80 |
| Tube current A/B (quality ref. mAs) | 51 /213 |
| Dose modulation | CARE Dose4D |
| CTDIvol (mGy) | ∼6 |
| Rotation time (s) | 0.33 |
| Pitch | 0.7 |
| Slice collimation (mm) | 1.2 |
| Acquisition (mm) | 14 × 1.2 |
| Slice width (mm) | 0.75 |
| Reconstruction increment (mm) | 0.7 |
| Reconstruction kernel | D30f |
Note this dual-energy protocol is for a Siemens Definition 64-slice CT scanner. Quality ref. mAs = quality reference mAs, CTDIvol = volume CT dose index.
Table 2. Contrast injection protocol of dual-energy pulmonary CT angiography.
| Iodine concentration 300 mg I ml–1 | Iodine concentration 370 mg I ml–1 | |
| Contrast media volume (ml kg–1) | 1.5 | 1.2 |
| Contrast media flow rate (ml s–1) | 4 | 4 |
| Bolus timing | Bolus tracking | Bolus tracking |
| Bolus tracking threshold (HU) | 100 | 100 |
| ROI position | Pulmonary trunk | Pulmonary trunk |
| Scan delay (s) | 6 | 6 |
| Saline flush volume (ml) | 40 | 40 |
| Saline injection rate (ml s–1) | 4 | 4 |
| Needle size (G) | 18 | 18 |
| Injection site | Antecubital vein | Antecubital vein |
ROI, region-of-interest. Note this dual-energy protocol is for a Siemens Definition 64-slice CT scanner.
From the raw spiral projection data of both tubes, images were automatically reconstructed to three separate image sets: 80 kVp, 140 kVp and fused images with an 80:140 kVp linear weighting of 0.3 (i.e. 30% image information from the 80 kVp image and 70% information from the 140 kVp image). For each image set, the slice thickness was 0.75 mm and the interval was 0.50 mm. Dedicated dual-energy analysis software (Syngommvvp VE23A, Siemens Medical Solutions, Forchheim, Germany) was used to generate blood flow imaging (BFI) in the axial, coronal and sagittal planes, using grey-scale 16-bit and positron emission tomography (PET) Rainbow 16-bit colour coding (red represents high pulmonary enhancement, blue represents low enhancement and black represents a contrast defect); the fused images of both tubes were used for diagnostic reading.
Clinical uses of DECT
Although MDCT pulmonary angiography has been advocated as the first-line imaging modality to detect pulmonary emboli [4], its ability to detect small segmental and subsegmental emboli is known to be limited. In a study by Ritchie et al [17], only 68% of patients with pulmonary emboli (19/28) were initially reported as having PE at the MDCT pulmonary angiogram. In the remaining 32% of cases (9/28) in which PE was not identified, the embolus was at the segmental level or located more distally. The CTPA sensitivity for pulmonary emboli was shown to be 83% in a prospective multicentre Prospective Investigation of Pulmonary Embolism Diagnosis (PIOPED) study [18], which suggests that CTPA fails to diagnose PE in approximately one in every six patients. The benefit of DECT images from BFI is that 3–5 mm diameter subsegmental emboli can create 3–5 cm diameter (one order of magnitude larger) contrast enhancement defects in the distal parenchyma. When DECT contrast enhancement defects are associated with upstream occluded or partially occluded pulmonary artery branches, or associated with the presence of distal, small-sized obstructive clots, then contrast enhancement defects are likely to reflect an alteration of peripheral lung perfusion in the setting of PE [16].
Detection of PE
As 80 kVp images available from the tube B detector optimise the contrast-to-noise ratio within pulmonary vessels, these can help to detect peripheral endoluminal clots. Such clots are known to be better visualised on 80 kVp images than on images acquired at 120 or 140 kV [14]. Importantly, we can use the BFI to search the contrast defect resulting from emboli. Thus, the normal and abnormal appearance of pulmonary BFI should be recognised before assessing the diagnostic ability to detect pulmonary emboli. Normal pulmonary BFI images were defined as showing homogeneous contrast enhancement in the normal range (colour-coded yellow-green or blue) with dependent symmetric lung iodine distribution (Figure 1). Dependent lung perfusion at DECT refers to relatively low contrast enhancement in the ventral regions (colour-coded purple) and relatively higher enhancement in the dorsal regions (colour-coded yellow-green or blue) with the patient in the supine position (Figure 2). Pseudo-high perfusion owing to dense contrast material in the thoracic veins appears as linear radiating areas of pseudo-high contrast enhancement (colour-coded red) and can be associated with adjacent iodine defects (colour-coded black) due to a beam-hardening artefact around the thoracic veins (Figure 3). Gravity-dependent pulmonary perfusion and pseudo-high perfusion owing to dense contrast material in the thoracic veins should not be mistaken for the perfusion abnormalities associated with PE. Contrast enhancement defects that are consistent with PE include those that are peripherally located, wedge-shaped and in a segmental or lobar distribution (Figure 4). All other contrast enhancement defects, such as patchy or band-like defects without segmental distribution or complete loss of colour coding (indicating lack of air-containing voxels owing to consolidation), were inconsistent with PE [19].
Figure 1.

Normal appearance of pulmonary blood flow imaging. (a) Axial blood flow image (BFI) and (b) coronal BFI fused to the corresponding coronal multiplanar image. The images (a) and (b) show homogeneous blood flow distribution in both lungs.
Figure 2.
Gravity-dependent lung perfusion states. A normal pulmonary blood flow image obtained with the patient in the supine position shows relatively low pulmonary contrast enhancement anteriorly (arrow) and relatively high contrast enhancement dependently.
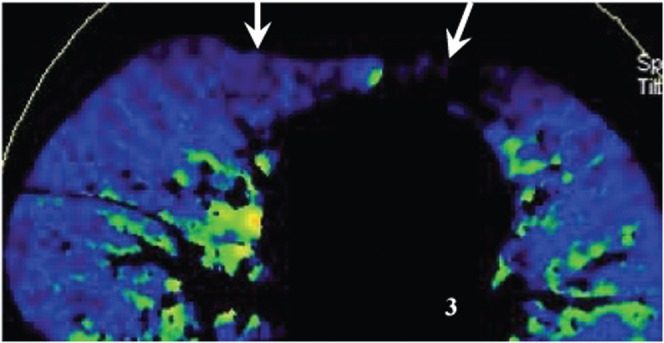
Figure 3.

Pseudo-high perfusion owing to dense contrast material in the thoracic vein. (a) An axial blood flow image shows radiating pseudo-high contrast enhancement and pseudo-iodine defect adjacent to the superior vena cava, owing to streak artefact from high-concentration contrast material. (b) A coronal maximum-intensity projection image shows a higher opacity of the superior vena cava than pulmonary artery.
Figure 4.

Acute pulmonary embolism in a 24-year-old man. (a) Axial, (b) coronal and (c) left sagittal blood flow images show a wedge-shaped contrast enhancement defect in the left lung lower lobe dorsal apical segment (white circle). Pseudo-high contrast enhancement is seen in the anterior portion of the right middle lung anterior to the normal pulmonary contrast enhancement seen in the right middle lobe more posteriorly (arrows). (d) An axial contrast-enhanced CT image shows a corresponding occlusive filling defect representing pulmonary emboli in the left lower lobe segmental pulmonary arteries (arrow) and non-occlusive emboli elsewhere.
DECT angiography not only depicts the contrast enhancement defects resulting from acute PE (Figure 4), but also shows contrast enhancement defects associated with chronic clots (Figure 5) [13, 17, 19, 20, 21]. Recently, Fink et al [19] reported that both the sensitivity and specificity of DECT for the assessment of PE were 100% on a per patient basis. On a per segment basis, the sensitivity and specificity ranged from 60–66.7% and from 99.5–99.8 %; CTPA was used in this study as the standard of reference in 24 patients with suspected PE, 4 of whom actually had PE. Considering scintigraphy as the standard of reference, Thieme et al [20] reported 75% sensitivity and 80% specificity on a per patient basis and 83% sensitivity and 99% specificity on a per segment basis in 13 patients, 7 of whom had PE. Pontana et al [16] also showed that the presence of endoluminal thrombus is associated with pulmonary perfusion defects at DECT. In an experimental study by Zhang et al [22], conventional CTPA identified pulmonary emboli in only 12 and the absence of emboli in 18 pulmonary lobes, corresponding to a sensitivity and specificity of 67% and 100%. By contrast, DECT and BFI each correctly identified pulmonary emboli in 16 of 18 pulmonary lobes and reported the absence of emboli in 11 of 12 lobes, corresponding to sensitivity and specificity of 89% and 92% for detecting pulmonary emboli. Thus, BFI and CTPA have complimentary roles in the diagnosis of PE. In particular, DECT and BFI can increase the sensitivity of CTPA for tiny peripheral emboli (Figure 6). Zhang et al [23] also compared the abilities of DECT and perfusion planar scintigraphy to detect pulmonary emboli. In their study, 24 rabbits were imaged by DECT pulmonary angiography (from which BFI and fusion images were created) and by perfusion scintigraphy 2 h after gelfoam (n = 20) or saline (n = 4) was injected into the femoral vein. Compared with pathological evaluation, CTPA correctly identified PE in 40 lobes and reported the absence of emboli in 80 lobes, corresponding to a sensitivity and specificity of 100%. BFI and fused images correctly identified PE in 40 lobes and the absence of emboli in 78 lobes, corresponding to a sensitivity of 100% and specificity of 98%. Perfusion scintigraphy correctly detected 27 lobes with PE and 65 lobes without PE, corresponding to a sensitivity of 68% and specificity of 81%. Zhang et al [24] found that BFI derived from DECT improves the diagnostic accuracy of PE compared with perfusion planar scintigraphy in an experimental rabbit model. A limitation of their study is that perfusion SPECT would have been superior to perfusion planar scintigraphy for the detection of pulmonary emboli. Comparison of the abilities of DECT, perfusion planar scintigraphy, single-photon emission computed tomography (SPECT) and SPECT-CT fusion images to detect pulmonary emboli is underway in our institute.
Figure 5.

A 63-year-old female with a history of pulmonary embolism. (a) A coronal maximum-intensity projection image shows a right pulmonary artery of normal appearance together with poor opacification of the left inferior pulmonary artery (arrow). These observations suggest a possible pulmonary embolus, but this was difficult to diagnose definitively. (b) The corresponding coronal blood flow image shows multiple segmental contrast enhancement defects bilaterally, which corresponded to (c) the findings of pulmonary perfusion scintigraphy performed one year previously. (d) Axial contrast-enhanced CT shows a mural embolus in the right pulmonary arteries (arrow).
Figure 6.

Fatty pulmonary embolism in a 23-year-old male with a history of femur fracture. (a) Coronal and (b) axial fused blood flow images show diffuse contrast enhancement defects in the dependent posterior portions of the lower lobes bilaterally. (c) A coronal maximum-intensity projection image shows multiple occlusive filling defects in the peripheral posterior lower lobe pulmonary arteries (arrows).
Furthermore, BFI from DECT could assist in the detection of pulmonary emboli that are not evident by conventional MDCT pulmonary angiography. Thieme et al [20] found that corresponding perfusion defects were observed in DECT and scintigraphy in two patients in whom there was no evidence of intravascular clots in angiographic CT images. They proposed that the observed pulmonary perfusion defects probably corresponded to segments of prior embolism with re-perfused segmental vessels and residual peripheral thrombosed vessels that were too small to visualise in CTPA. This assumption was also made in the study by Pontana et al [16] in which four subsegmental perfusion defects were depicted by BFI images, whereas endoluminal thrombi were not visalised in the corresponding arteries by CTPA. We also found a similar so-called false-positive DECT result in one patient with chronic PE in the pulmonary images of BFI (Figure 5). In another patient undergoing anticoagulant therapy, the initial conventional CTPA did not visualise abnormal findings. However, the magnified view of the targeted pulmonary arteries corresponding to contrast enhancement defect in the BFI images showed a subtle subsegmental filling defect (Figure 7). These findings indicate that CTPA in isolation might not be an adequate gold standard to detect all PE, especially small peripheral emboli or chronic PE. However, we do not deny the mainstay role of MDCT in the evaluation of pulmonary emboli. The detection of small emboli is of clinical importance because even small emboli require treatment to prevent chronic PE and pulmonary artery hypertension in several clinical scenarios. In patients with a small embolus and inadequate cardiopulmonary reserve; in patients who have a small embolus and coexisting acute deep venous thrombosis; and in patients with recurrent small emboli possibly owing to thrombophilia [4]. Certainly, the significance of small emboli needs to be studied further and the increased use of BFI might assist with such studies.
Figure 7.

Follow-up of pulmonary embolism in a 46-year-old female with dual-energy CT. (a) A coronal blood flow image fused with the corresponding multiplanar image shows multiple wedge-shaped pulmonary contrast defects corresponding to central filling defects in the lobar and segmental pulmonary arteries. These observations indicate multiple pulmonary emboli at the initial presentation. (b) A coronal blood flow image acquired after the patient received anticoagulant therapy for 1 month shows a persistent, but less prominent, wedge-shaped contrast defect in the left lower lobe apical segment (white circle); however, the corresponding conventional CTPA image does not show any obvious abnormal findings. (c) A magnification of the same image shows a segmental pulmonary artery branch with decreased opacification, suggesting the presence of an unresolved residual embolus (arrow).
Prognosis in patients with acute PE
Rapid risk assessment is critical in patients with acute PE because they will benefit from life-saving thrombolytic therapy or invasive therapies, including catheter-guided thrombosuction or thrombectomy [25]. Right ventricle (RV) dysfunction has been shown to be independently predictive of 30-day mortality. In addition, it has been demonstrated that the ratio between the size of the RV and that of the left ventricle (LV) has a significant positive correlation with the severity of PE or with mortality [26]. The contrast enhancement defects visualised in BFI images appear to have a positive relationship with the patients’ right heart dysfunction [27]. Thieme et al [20] suggested that the findings of pulmonary perfusion defects might be more useful in determining the relevance of PE for blood oxygenation and acute prognosis, such as the development of pulmonary hypertension. Similarly, contrast enhancement defects visualised in BFI images might be a better prognostic marker for therapy monitoring, as it is easier and more intuitively relevant to quantify the extent of perfusion defects than to quantify clot burden. Again, further research is required to investigate the relationship between quantitative DECT contrast findings and prognosis.
Follow-up of PE
Aside from visualising contrast enhancement defects to diagnose PE, DECT can be used for monitoring PE treatment [27]. Following anticoagulant therapy or thrombolysis therapy, complete resolution of pulmonary arterial and corresponding contrast enhancement defects indicate that pulmonary emboli have been dissolved (Figure 8). By contrast, contrast enhancement defects on follow-up BFI images could suggest dissolved emboli in the pulmonary arteries. Such findings should prompt careful interrogation of the CTPA to confirm the presence of partially occlusive or fragmented emboli (Figure 7) so as to further inform therapeutic management.
Figure 8.

A 40-year-old male with pulmonary embolism. (a) A thin-slice axial enhanced CT image and (b) corresponding axial blood flow image show a subtle filling defect in the segmental artery of the right middle lung lobe (arrow) and a corresponding contrast enhancement defect in the right middle lobe (white circle) at the initial CT scan. (c) A thin-slice axial enhanced CT image and (d) corresponding axial blood flow image after anticoagulation therapy show normal pulmonary arteries and homogeneous contrast enhancement state in both lungs, indicating resolution of the pulmonary clot burden.
Pitfalls of image interpretation
In the analysis of BFI images, sources of false-positive results should be kept in mind to avoid misdiagnoses. These pitfalls when interpreting BFI images can relate to artefacts from contrast material, physiological distribution of the contrast material and pulmonary pathology. Streak and beam-hardening effects resulting from high-concentration contrast agent in the thoracic veins and right cardiac chambers can commonly cause heterogeneous artefacts in BFI images (Figure 3); these artefacts must be considered when an unexpected contrast enhancement defect is noted adjacent to an area of high contrast enhancement. Optimisation of contrast medium injection parameters, including the use of a saline chase, can improve the image quality of DECT and increase diagnostic confidence. Cardiac motion can cause apparent lower areas of lung contrast enhancement in the lung parenchyma adjacent to the cardiac chambers. A potential method to improve image quality in the vicinity of the cardiac chambers might be to synchronise data acquisition with electrocardiographic tracing, a technological development currently exclusively available for myocardial “perfusion” analysis [16]; however, such methodology could also potentially introduce stair-step or misregistration artefacts and requires further study. Normal physiological gravity-dependent variation in pulmonary “perfusion” should also be recognised [23, 27]. In addition, the standard CT images should be evaluated for pulmonary pathology, such as emphysema (Figure 9), tumours invading or compressing the pulmonary arteries (Figure 10) and pulmonary consolidation (Figure 11), all of which are result in contrast enhancement defect in BFI images.
Figure 9.

Contrast defect in the blood flow image caused by emphysema. (a) A coronal maximum-intensity projection image shows a filling defect in the right lower pulmonary artery (arrow). (b) A coronal blood flow image shows heterogeneous contrast enhancement in both lungs caused by the emphysema and pulmonary embolism. The emphysema is readily seen on (c) coronal reformatted multiplanar images viewed with lung windows.
Figure 10.

Contrast defect in the pulmonary blood volume image caused by lung carcinoma. (a) A coronal maximum-intensity projection image shows a left lung hilar carcinoma invading the left pulmonary lobar arteries (arrow), resulting in diffuse decreased contrast enhancement of the left lung in the corresponding coronal blood flow image fused with the CT angiogram (b).
Figure 11.

Contrast enhancement defect in the pulmonary blood flow image caused by lung consolidation. (a) An axial blood flow image shows a contrast enhancement defect in the left lower lobe (white circle). (b) The corresponding axial CT image clearly shows pulmonary consolidation in the corresponding left lower lung (white circle).
False-negatives at BFI can result from non-occlusive emboli that have very little effect on the corresponding pulmonary regional contrast enhancement defects in central, lobar and segmental pulmonary arteries (Figure 12). As illustrated in Figures 4, 6 and 12, the occlusive degree of pulmonary arteries will affect contrast enhancement defects in BFI, which deserves further study. But, misdiagnosis resulting from these factors is rare when BFI images are interpreted in conjunction with conventional CTPA, which can reliably detect the lobar and segmental emboli. Nevertheless, small peripheral pulmonary emboli causing minimal contrast enhancement defect alterations can be overlooked even when state-of-the-art MDCT scanners are employed. Also, the considerable reduction in the pulmonary capillary bed often seen in the elderly or patients with emphysema can cause diffuse decreased pulmonary “perfusion” [13].
Figure 12.

A false-negative pulmonary embolism in the blood flow image (BFI). (a) Coronal and (b) sagittal fused BFI do not show the typical triangular contrast enhancement defect; however, typical non-occlusive intraluminal filling defects were found (arrow). Note the small peripheral lung infarct in the right lower lobe (arrowhead).
Conclusion
DECT can provide both anatomical and iodine mapping information of whole lungs. In doing so, this technology has the capacity to improve the diagnostic accuracy of PE through comprehensive analysis of BFI and CTPA obtained during a single contrast-enhanced chest CT scan in a dual-energy mode. In conclusion, DECT has the potential to improve the detection and follow-up of pulmonary emboli.
References
- 1.Laack TA, Goyal DG. Pulmonary embolism: an unsuspected killer. Emerg Med Clin North Am 2004;22:961–83 [DOI] [PubMed] [Google Scholar]
- 2.Tapson VF. Acute pulmonary embolism. N Engl J Med 2008;358:1037–52 [DOI] [PubMed] [Google Scholar]
- 3.Patel S, Kazerooni EA, Cascade PN. Pulmonary embolism: optimization of small pulmonary artery visualization at multidetector row CT. Radiology 2003;227:455–60 [DOI] [PubMed] [Google Scholar]
- 4.Remy-Jardin M, Pistolesi M, Goodman LR, Gefter WB, Gottschalk A, Mayo JR, et al. Management of suspected acute pulmonary embolism in the era of CT angiography: a statement from the Fleischner Society. Radiology 2007;245:315–29 [DOI] [PubMed] [Google Scholar]
- 5.Ghaye B. Peripheral pulmonary embolism on multidetector CT pulmonary angiography. JBR-BTR 2007;90:100–8 [PubMed] [Google Scholar]
- 6.Zhang LJ, Wang YZ, Huang W, Chen P, Zhou CS, Lu GM. In vivo visualization of sinuatrial nodal artery using dual-source CT. Circ J 2008;72:1615–20 [DOI] [PubMed] [Google Scholar]
- 7.Lu GM, Zhang LJ, Guo H, Huang W, Merges RD. Comparison of myocardial bridging by dual-source CT with conventional coronary angiography. Circ J 2008;72:1079–85 [DOI] [PubMed] [Google Scholar]
- 8.Brodoefel H, Burgstahler C, Tsiflikas I, Reimann A, Schroeder S, Claussen CD, et al. Dual-source CT: effect of heart rate, heart rate variability, and calcification on image quality and diagnostic accuracy. Radiology 2008;247:346–55 [DOI] [PubMed] [Google Scholar]
- 9.Johnson TR, Krauss B, Sedlmair M, Grasruck M, Bruder H, Morhard D, et al. Material differentiation by dual-energy CT: initial experience. Eur Radiol 2007;17:1510–7 [DOI] [PubMed] [Google Scholar]
- 10.Wildberger JE, Klotz E, Ditt H, Mahnken AH, Spüntrup E, Günther RW. Multi-slice CT for visualization of acute pulmonary embolism: single breath-hold subtraction technique. Rofo 2005;177:17–23 [DOI] [PubMed] [Google Scholar]
- 11.Wildberger JE, Schoepf UJ, Mahnken AH, Herzog P, Ditt H, Niethammer MU, et al. Approaches to CT perfusion imaging in pulmonary embolism. Semin Roentgenol 2005;40:64–73 [DOI] [PubMed] [Google Scholar]
- 12.Miles KA. Perfusion imaging with computed tomography: brain and beyond. Eur Radiol 2006; (Suppl 7): M37–43 [DOI] [PubMed] [Google Scholar]
- 13.Boroto K, Remy-Jardin M, Flohr T, Faivre JB, Pansini V, Tacelli N, et al. Thoracic applications of dual-source CT technology. Eur J Radiol 2008;68:375–84 [DOI] [PubMed] [Google Scholar]
- 14.Remy-Jardin M, Faivre JB, Pontana F, Hachulla A, Tacelli N, Santangelo T, et al. Thoracic applications of dual energy. Radiol Clin North Am 2010;48:193–205 [DOI] [PubMed] [Google Scholar]
- 15.Seidensticker PR, Hofmann LK. Dual source CT imaging. Heidelberg: Springer Medizin Verlag, 2008:29–33. [Google Scholar]
- 16.Pontana F, Faivre JB, Remy-Jardin M, Flohr T, Schmidt B, Tacelli N, et al. Lung perfusion with dual-energy multidetector-row CT (MDCT) feasibility for the evaluation of acute pulmonary embolism in 117 consecutive patients. Acad Radiol 2008;15:1494–504 [DOI] [PubMed] [Google Scholar]
- 17.Ritchie G, McGurk S, McCreath C, Graham C, Murchison JT. Prospective evaluation of unsuspected pulmonary embolism on contrast enhanced multidetector CT (MDCT) scanning. Thorax 2007;62:536–40 [DOI] [PMC free article] [PubMed] [Google Scholar]
- 18.Stein PD, Fowler SE, Goodman LR, Gottschalk A, Hales CA, Hull RD, et al. Multidetector computed tomography for acute pulmonary embolism. N Engl J Med 2006;354:2317–27 [DOI] [PubMed] [Google Scholar]
- 19.Fink C, Johnson TR, Michaely HJ, Morhard D, Becker C, Reiser M, et al. Dual-energy CT angiography of the lung in patients with suspected pulmonary embolism: initial results. Rofo 2008;180:879–83 [DOI] [PubMed] [Google Scholar]
- 20.Thieme SF, Becker CR, Hacker M, Nikolaou K, Reiser MF, Johnson TR. Dual energy CT for the assessment of lung perfusion — correlation to scintigraphy. Eur J Radiol 2008;68:369–74 [DOI] [PubMed] [Google Scholar]
- 21.Thieme SF, Johnson TRC, Lee C, McWilliams J, Becker CR, Reiser MF, et al. Dual-energy CT for the assessment of contrast material distribution in the pulmonary parenchyma. AJR Am J Roentgenol 2009;193:144–9 [DOI] [PubMed] [Google Scholar]
- 22.Zhang LJ, Zhao YE, Wu SY, Yeh BM, Zhou CS, Hu XB, et al. Detection of pulmonary embolism by dual energy CT: an experimental study in rabbits. Radiology 2009;242:61–70 [DOI] [PubMed] [Google Scholar]
- 23.Zhang LJ, Chai X, Wu SY, Zhao YE, Hu XB, Hu YX, et al. Detection of pulmonary embolism by dual energy CT: correlation with perfusion scintigraphy and histopathological findings in rabbits. Eur Radiol 2009;19:2844–54 [DOI] [PubMed] [Google Scholar]
- 24.Bajc M, Bitzén U, Olsson B, Perez deSá V, Palmer J, Jonson B. Lung ventilation/perfusion SPECT in the artificially embolized pig. J Nucl Med 2002;43:640–7 [PubMed] [Google Scholar]
- 25.Doğan H, Kroft LJ, Huisman MV, van derGeest RJ, de Roos A. Right ventricular function in patients with acute pulmonary embolism: analysis with electrocardiography-synchronized multi-detector row CT. Radiology 2007;242:78–84 [DOI] [PubMed] [Google Scholar]
- 26.Ghaye B, Ghuysen A, Willems V, Lambermont B, Gerard P, D’Orio V, et al. Severe pulmonary embolism: pulmonary artery clot load scores and cardiovascular parameters as predictors of mortality. Radiology 2006;239:884–91 [DOI] [PubMed] [Google Scholar]
- 27.Zhang LJ, Yang GF, Zhao YE, Zhou CS, Lu GM. Detection of pulmonary embolism using dual-energy computed tomography and correlation with cardiovascular measurements: a preliminary study. Acta Radiol 2009;50:892–901 [DOI] [PubMed] [Google Scholar]