Abstract
Our aim was to assess the protective effect of hydrogen-rich water against cisplatin-induced nephrotoxicity in rats using dynamic contrast-enhanced CT (DCE-CT). DCE-CT studies were performed in 30 rats (8 weeks old) on days 0, 2, 4 and 7 using multidetector row CT. The rats were divided into three groups: a control group (n = 6) with free access to standard water and without cisplatin injection, a non-treatment group (n = 12) with free access to standard water and injected with cisplatin (3.6 mg kg–1 body weight) intraperitoneally on day 0 and a treatment group (n = 12) with free access to hydrogen-rich water starting from 7 days before cisplatin injection. The contrast clearance per unit renal volume (K1) was estimated from the DCE-CT data using the Patlak model. The contrast clearance of the entire kidney (K) was obtained by multiplying K1 by the renal volume. The serum creatinine level was also measured on day 7. The K1 and K values normalised by those on day 0 in the treatment group were significantly greater than those in the non-treatment group on days 2, 4 and 7. There were no significant differences in the normalised K value between the treatment and control groups on days 2 and 7. The serum creatinine level in the treatment group was significantly lower than that in the non-treatment group and was not significantly different from that in the control group. This study demonstrated that hydrogen-rich water ameliorates renal dysfunction due to cisplatin-induced nephrotoxicity in rats.
Cis-dichlorodiammineplatinum (II) (cisplatin) is one of the most widely used agents for chemotherapy of cancers. It is well known that cisplatin exhibits nephrotoxicity; it has been reported to cause direct tubular necrosis [1]. Such nephrotoxicity appears to be the major dose-limiting untoward factor associated with cisplatin administration. Thus, it is important to monitor this nephrotoxicity when using cisplatin in a clinical setting. The evaluation of nephrotoxicity is also critical in the course of drug development, because it is one of the major toxicities of drugs. It is also important to find an agent that has a protective effect against cisplatin-induced nephrotoxicity.
Oxidative stress represents an imbalance between the production of reactive oxygen species (ROS) and the activity of antioxidant defence systems [2]. It is thought that oxidative stress plays a critical role in cisplatin-induced nephrotoxicity [3]. Cisplatin stimulates the generation of ROS such as hydroxyl radicals and renal lipid peroxidation [4]. Antioxidants that have protective effects against nephrotoxicity have been extensively explored [5, 6]. Recently, Ohsawa et al [7] found that molecular hydrogen could selectively reduce cytotoxic ROS, such as hydroxyl radicals, and exert therapeutic antioxidant activity in a rat middle cerebral artery occlusion model. In addition, the inhalation of hydrogen gas has been demonstrated to reduce the infarct size in a rat model of myocardial ischaemia–reperfusion injury [8] and suppress hepatic ischaemia–reperfusion injury in mice [9].
Glomerular filtration is the main function of the kidney. Measurement of the glomerular filtration rate (GFR) is important in the evaluation of renal function for the assessment of many renal diseases and their treatment [10]. The conventional iodinated X-ray contrast agents (CAs) have pharmacokinetics similar to those of inulin, generally regarded as the benchmark extracellular fluid marker in physiology [10]. Dynamic contrast-enhanced CT (DCE-CT) has a great potential for measuring physiological parameters [11] because CT can measure changes in the concentration of CA quantitatively, accurately, and with high spatial and temporal resolution by subtracting unenhanced from enhanced CT scans. Consequently, DCE-CT using iodinated CA has been applied to the measurement of GFR [10–12]. The purpose of this study was to investigate the protective effect of hydrogen-rich water against cisplatin-induced nephrotoxicity in rats using DCE-CT.
Methods and materials
Calculation of the clearance of CA in the kidney
The clearance of CA per unit renal volume (K1) was estimated from the concentrations of the CA in the kidney and blood using the Patlak graphical method [13]. The details have been described in Murase et al [12]. The clearance of CA in the entire kidney (K) was calculated by multiplying K1 by the renal volume. It should be noted that K is the GFR in terms of the whole blood.
The time–attenuation curve (TAC) in the aorta was used as an arterial input function (AIF) instead of that in the renal artery, because it was difficult to directly obtain the TAC in the renal artery. The transit time of the CA from the aorta to the renal artery was corrected as follows. First, we manually drew the region of interest (ROI) on the aorta and entire kidney, and then generated the TACs in the aorta and entire kidney ROIs. Second, the transit time between the aorta and the kidney was determined by visually finding the rise points of these TACs. Finally, the transit time was corrected by shifting the TAC in the aorta to that in the entire kidney. The dispersion in AIF between the aorta and the kidney ROIs was not corrected in this study.
The partial volume effect (PVE) on AIF was corrected according to Cenic et al [14]. Briefly, a calibration curve was generated by phantom experiments containing background and contrast tubes with various diameters [11]. From the calibration curve, the recovery coefficient (RC) value was determined, as we knew the standard deviation (SD) of the Gaussian fit to the background-subtracted image profile of the aorta from which the AIF was obtained [11]. The AIF corrected for the PVE was obtained by multiplying the AIF by the RC value obtained above.
Animal experiment protocol
All animal experiments were approved by the animal ethics committee at Osaka University School of Medicine. 30 male Sprague–Dawley rats aged 8 weeks were used. They were purchased from Charles River Japan (Yokohama, Japan) and were maintained under standard conditions. The room temperature was kept at 23 °C and a normal 12-h light/dark cycle was maintained. The rats were divided into three groups: a control group (n = 6, body weight (BW) 284 ± 4 g (mean ± SD)) with free access to standard laboratory food and water and without cisplatin injection, a non-treatment group (n = 12, BW 290 ± 7 g) with free access to standard laboratory food and water and injected with cisplatin (3.6 mg kg–1 BW) intraperitoneally on day 0, and a treatment group (n = 12, BW 263 ± 14 g) with free access to standard laboratory food and hydrogen-rich water starting from 7 days before an intraperitoneal injection of cisplatin (3.6 mg kg–1 BW) on day 0. Hydrogen-rich water sealed in a 200-ml aluminium pouch was kindly provided by I'rom Pharmaceutical (Tokyo, Japan). The process for producing hydrogen-rich water has been described previously [15]. The concentration of dissolved hydrogen was 1.2 ± 0.1 mg l–1 (mean ± SD), as measured using a dissolved hydrogen analyser (DH-35A; DKK-TOA, Tokyo, Japan). Cisplatin was purchased from Nippon Kayaku (Tokyo, Japan).
The DCE-CT studies were performed on days 0, 2, 4 and 7. When performing the DCE-CT studies, the animal was anaesthetised with an intraperitoneal injection of chloral hydrate solution (Sigma Aldrich, St Louis, MO) (4%, 400 mg kg–1 BW) and was placed on the CT table in a prone position. To reduce physiological motion such as respiratory motion, we immobilised the animal with surgical tape.
DCE-CT protocol
The DCE-CT studies were performed using multidetector row CT (Asteion; Toshiba Medical Systems, Tochigi, Japan). For selection of the appropriate transverse level for DCE-CT studies, unenhanced scout scanning through the kidneys was performed with a tube voltage of 120 kV and a tube current of 80 mA. After selection of the transverse level, the DCE-CT study was performed with the same tube voltage and tube current used for scout scanning. The matrix size was 512 × 512 and the field of view (FOV) was 90 mm × 90 mm. Four slices with a thickness of 3 mm were acquired with a gantry rotation speed of 1.5 s.
For the dynamic study, CT scanning was initiated 4 s before administration of CA. A bolus of 150 mg I kg–1 BW of iodinated CA (Iopamiron 300 (300 mg I ml); Bayer Schering Pharma, Osaka, Japan) was administered at a rate of 0.125 ml s–1 through the 26-gauge tail vein catheter using an automatic injector of our own manufacture. Dynamic scanning was continued for 90 s, and transverse images were reconstructed at 1-s intervals, resulting in 90 consecutive images per slice.
After the DCE-CT scanning, helical CT scanning covering the entire kidneys was performed with the same tube voltage, tube current and FOV used for DCE-CT scanning, a slice thickness of 1 mm and a table speed of 5.5 mm/rotation, i.e. a helical pitch of 5.5 for the measurement of renal volumes.
After the final DCE-CT study performed on day 7, rats were killed under anaesthesia and blood was collected from the heart. The serum level of creatinine was measured (SRL, Tokyo, Japan).
Measurement of renal volume
We measured the renal volume as follows. First, we manually delineated the kidney on the contrast-enhanced CT image and calculated the area within the contour. Finally, we calculated the renal volume by summing up the areas from all slices and multiplying it by the slice thickness.
Histopathological observation
After the final DCE-CT study performed on day 7, rats were killed and kidneys were removed for histopathological observation. The resected kidney was sectioned in blocks, fixed in 20% formalin, then dehydrated in graded concentrations of alcohol and embedded in paraffin. The kidney block was cut into 2-μm sections and stained with periodic acid–Schiff (PAS) reagents to demonstrate polysaccharides, neutral mucopolysaccharide and glycoproteins from epithelial tubular membranes. Slices were incubated with periodic acid for 5 min and washed with distilled water. Slices were then incubated with Schiff's reagent for 15 min and counterstained with haematoxylin for 30 s. The histopathological observation was performed using light microscopy.
Statistical analysis
Unless specifically stated, data were represented as mean ± standard error (SE). The paired Student's t-test was used to test for significant differences in the K1 and K values compared with those on day 0. Tukey's multiple comparison test was used to compare the BW, K1 and K values normalised by those on day 0 among the control, non-treatment and treatment groups on days 2, 4 and 7, and the serum creatinine levels on day 7. A p-value less than 0.05 was considered significant.
Results
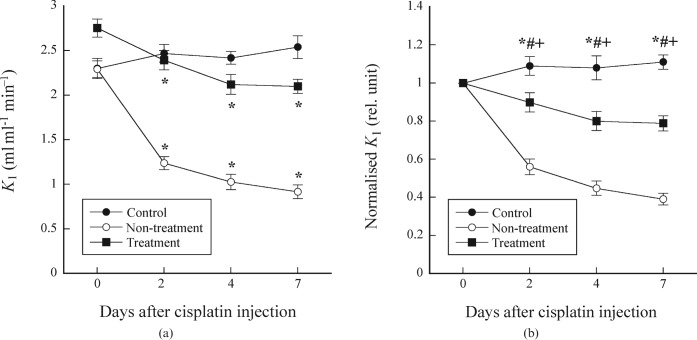
Figure 1a shows the K1 values as a function of days after cisplatin injection in the control, non-treatment and treatment groups, whereas Figure 1b shows the K1 values normalised by that on day 0. In the control group, the K1 value significantly increased on day 7 compared with that on day 0, whereas it significantly decreased on days 2, 4 and 7 compared with day 0 in the non-treatment and treatment groups (Figure 1a). For the normalised K1 value, there were significant differences among the control, non-treatment and treatment groups on days 2, 4 and 7 (Figure 1b).
Figure 1.
(a) K1 values as a function of days after cisplatin injection in the control, non-treatment and treatment groups. *p < 0.05 compared with the K1 value on day 0. (b) K1 values normalised by that on day 0 as a function of days after cisplatin injection in the control, non-treatment and treatment groups. Symbols *, # and + indicate significant differences (p < 0.05) between the control and non-treatment groups, between the control and treatment groups, and between the non-treatment and treatment groups, respectively.
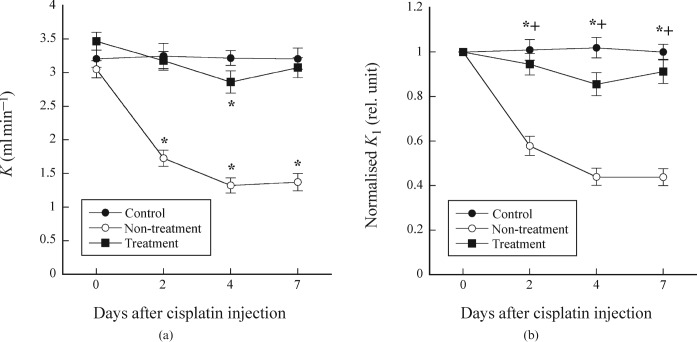
Figure 2a shows the K values as a function of days after cisplatin injection in the control, non-treatment and treatment groups, whereas Figure 2b shows the K values normalised by that on day 0. In the control group, there were no significant differences in the K value on days 2, 4 and 7 compared with day 0. In the non-treatment group, the K value significantly decreased on days 2, 4 and 7 compared with day 0, whereas it significantly decreased only on day 4 in the treatment group (Figure 2a). For the normalised K value, there were significant differences between the control and non-treatment groups and between the non-treatment and treatment groups on days 2, 4 and 7, whereas there were no significant differences between the control and treatment groups (Figure 2b).
Figure 2.
(a) K values as a function of days after cisplatin injection in the control, non-treatment and treatment groups. *p < 0.05 compared with the K value on day 0. (b) K values normalised by that on day 0 as a function of days after cisplatin injection in the control, non-treatment and treatment groups. Symbols * and + indicate significant differences (p <0.05) between the control and treatment groups, and between the non-treatment and treatment groups, respectively.
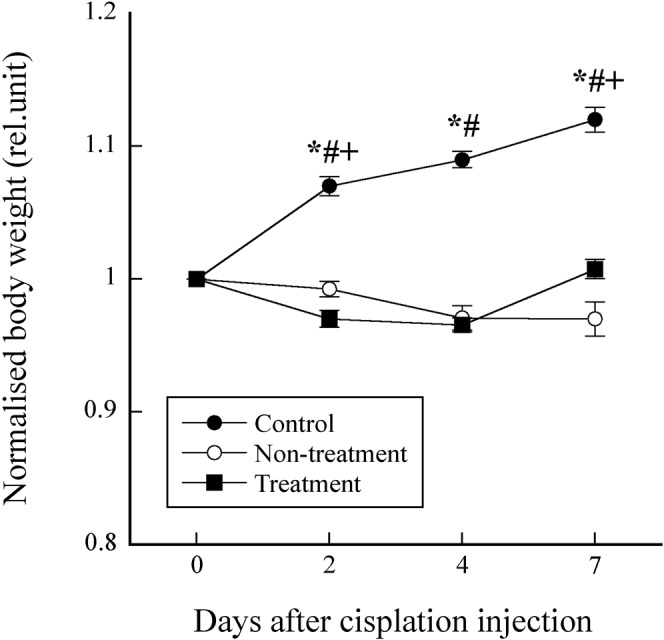
Figure 3 shows the BW normalised by that on day 0 as a function of days after cisplatin injection in the control, non-treatment and treatment groups. There were significant differences among the control, non-treatment and treatment groups, except on day 4 between the non-treatment and treatment groups.
Figure 3.

Body weight normalised by that on day 0 as a function of days after cisplatin injection in the control, non-treatment and treatment groups. Symbols *, # and + indicate significant differences (p <0.05) between the control and non-treatment groups, between the control and treatment groups, and between the non-treatment and treatment groups, respectively.
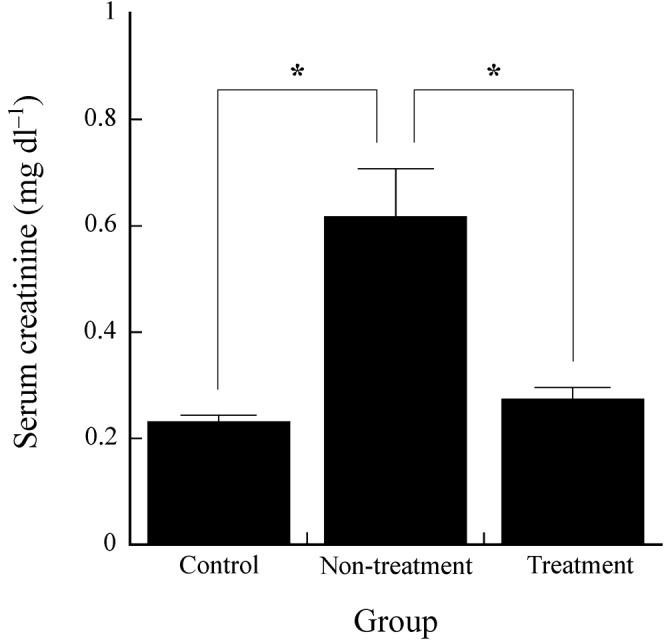
Figure 4 shows the serum creatinine levels in the control, non-treatment and treatment groups. The serum creatinine level in the treatment group (0.27±0.02 mg dl–1) was significantly lower than that in the non-treatment group (0.62±0.09 mg dl–1) and was not significantly different from that in the control group (0.23±0.01 mg dl–1).
Figure 4.

Serum creatinine levels in the control, non-treatment and treatment groups. Asterisks indicate significant difference (p <0.05).
Figure 5a shows the typical PAS stain images obtained from the control, non-treatment (Figure 5b) and treatment groups (Figure 5c). Some tubular dilatation and damage with desquamation of tubular epithelium were observed in the non-treatment group (Figure 5b), whereas the extent of such damage was largely reduced in the treatment group (Figure 5c).
Figure 5.
Light micrographs of renal tissue from the control (a), non-treatment (b) and treatment groups (c) (periodic acid–Schiff (PAS) stain ×200). Calibration bar (100 μm) is also shown.
Discussion
In this study, we quantitatively evaluated the effect of hydrogen-rich water on cisplatin-induced nephrotoxicity in rats by measuring the CA clearance in the kidney (K1 and K) using DCE-CT and the Patlak model [13]. Our results (Figures 2–5) demonstrated that hydrogen-rich water has a protective effect against cisplatin-induced nephrotoxicity.
As previously described, K1 and K are the clearance of CA per unit renal volume and that in the entire kidney, respectively. In clinical practice, the measurement of creatinine clearance (Ccr) remains the most widely used method for obtaining an index of GFR [16]. Although measurement of Ccr requires a carefully timed urine collection (usually 24 h) and blood sampling [16], measurements of CA clearance using DCE-CT require neither urine nor blood sampling and are easy to perform even in animal experiments as done in this study. This method allows repeated measurements in a single animal and simultaneous evaluation of individual renal morphology and function with high spatial resolution. Thus, the present method appears useful for the purpose of this study. The Patlak model has been widely used to measure the GFR with DCE-CT [10, 12]. We also used this model in this study. According to this model, the GFR is measured as the transfer from the arterial blood to the renal tubules. The model also takes into account the fact that no tracer outflow from the ROI during the sampling period is assumed [10, 12]. Therefore, an ROI that encompasses the entire kidney including the cortex and medulla is generally used [10, 12]; thus, the present method is unlikely to be affected by artefacts due to physiological motion, such as respiratory motion, which are problematic in animal experiments [12].
Recently, Nakashima-Kamimura et al [17] reported that hydrogen-rich water improved metamorphosis accompanying decreased apoptosis in the kidney and nephrotoxicity as assessed by serum creatinine and blood urea nitrogen levels. The present study quantitatively assessed the protective effect of hydrogen-rich water against cisplatin-induced nephrotoxicity in terms of CA clearance as previously described and strongly supported the above results of Nakashima-Kamimura et al [17].
Cisplatin-induced nephrotoxicity appears to be mediated, at least partially, through generation of ROS [3]. Hydrogen has potential as an antioxidant in preventive and therapeutic applications [7]. Ohsawa et al [7] found that hydrogen selectively reduced hydroxyl radicals, the most cytotoxic ROS, and effectively protected cells; however, hydrogen did not react with other ROS possessing physiological roles. Thus, hydrogen can be used as an effective antioxidant therapy; owing to its ability to rapidly diffuse across membranes, it can reach and react with cytotoxic ROS and thus protect against oxidative damage. A wide variety of antioxidants have been reported to reveal protective effects against cisplatin-induced nephrotoxicity [5, 6]. These antioxidants, however, generally require high doses to exhibit a significant protective effect, which may cause various side effects. Compared with these antioxidants, hydrogen-rich water appears to be much safer and easier to apply. If too much hydrogen is taken in, the excess would be expired through the lungs. Thus, hydrogen-rich water has great potential for clinical use.
It is known that hydrogen is produced by carbohydrate fermentation in the colon [18]. When unabsorbed carbohydrate enters the colon, it is rapidly fermented to produce short-chain fatty acids by anaerobic colonic bacteria and liberates hydrogen, which normally circulates in the blood [18]. Thus, it appears that hydrogen is physiologically safe for humans at a relatively low concentration and does not cause significant side effects or toxicities. Although no side effects or toxicities due to hydrogen-rich water were observed in this study, further studies on these disturbances will be necessary in order to start using hydrogen-rich water in the clinical setting. For clinical use, whether hydrogen-rich water interferes with the antitumour activity of cisplatin is also an important point. Nakashima-Kamimura et al [17] investigated this interference using cancer cell lines in vitro and tumour-bearing mice in vivo, and reported that hydrogen does not impair the antitumour activity of cisplatin. However, further studies on this interference using human subjects may also be necessary in order to establish the usefulness of hydrogen-rich water in the clinical setting.
In several studies, inhalation of hydrogen gas was reported to protect cerebral [7], myocardial [8] and hepatic ischaemia–reperfusion injury in animal models [9]. Hydrogen gas, however, may not be suitable for practical use, because inhalation of hydrogen gas requires special devices such as a sealed chamber or face mask. To overcome this drawback, several authors investigated whether drinking hydrogen-rich water ad libitum, instead of inhaling hydrogen gas, is effective and applicable for reducing oxidative stress [19–21]. Kajiyama et al [19] reported that drinking hydrogen-rich water may have a beneficial role in the prevention of type 2 diabetes mellitus or impaired glucose tolerance. Zheng et al [20] reported that drinking hydrogen-rich water protects the small intestine against ischaemia–reperfusion injury, and Nagata et al [21] reported that it may be applicable for preventive use in cognitive or other neuronal disorders. In this study, rats drank hydrogen-rich water ad libitum. Drinking hydrogen-rich water is an easier, cheaper and more convenient way of taking hydrogen in daily life than inhalation of hydrogen gas. Thus, drinking hydrogen-rich water will improve quality of life, especially in patients undergoing chemotherapy.
In conclusion, this study demonstrated that hydrogen-rich water ameliorates renal dysfunction due to cisplatin-induced nephrotoxicity in rats. Our method using DCE-CT appears useful for quantitatively evaluating the effect of antioxidants such as hydrogen against drug-induced nephrotoxicity, because it allows repeated and simultaneous evaluation of renal morphology and function.
Acknowledgment
The authors thank Dr Naomasa Kawaguchi (Department of Pathology, Graduate School of Medicine, Osaka University) for his kind help in the part of histopathological evaluation.
References
- 1.Borch RF, Pleasants ME. Inhibition of cis-platinum nephrotoxicity by diethyldithiocarbamate rescue in a rat model. Proc Natl Acad Sci USA 1979;76:6611–14 [DOI] [PMC free article] [PubMed] [Google Scholar]
- 2.Betteridge DJ. What is oxidative stress? Metabolism 2000;49(2 Suppl 1):3–8 [DOI] [PubMed] [Google Scholar]
- 3.Matsushima H, Yonemura K, Ohishi K, Hishida A. The role of oxygen free radicals in cisplatin-induced acute renal failure in rats. J Lab Clin Med 1998;131:518–26 [DOI] [PubMed] [Google Scholar]
- 4.Kuhlmann MK, Burkhardt G, Kohler H. Insights into potential cellular mechanisms of cisplatin nephrotoxicity and their clinical application. Nephrol Dial Transplant 1997;12:2478–80 [DOI] [PubMed] [Google Scholar]
- 5.Osman AM, El-Sayed EM, El-Demerdash E, Al-Hyder A, El-Didi M, Attia AS, et al. Prevention of cisplatin-induced nephrotoxicity by methimazole. Pharmacol Res 2000;41:113–19 [DOI] [PubMed] [Google Scholar]
- 6.Dickey DT, Wu YJ, Muldoon LL, Neuwelt EA. Protection against cisplatin-induced toxicities by N-acetylcysteine and sodium thiosulfate as assessed at the molecular, cellular, and in vivo levels. J Pharmacol Exp Ther 2005;314:1052–8 [DOI] [PubMed] [Google Scholar]
- 7.Ohsawa I, Ishikawa M, Takahashi K, Watanabe M, Nishimaki K, Yamagata K, et al. Hydrogen acts as a therapeutic antioxidant by selectively reducing cytotoxic oxygen radicals. Nat Med 2007;13:688–94 [DOI] [PubMed] [Google Scholar]
- 8.Hayashida K, Sano M, Ohsawa I, Shinmura K, Tamaki K, Kimura K, et al. Inhalation of hydrogen gas reduces infarct size in the rat model of myocardial ischemia-reperfusion injury. Biochem Biophys Res Commun 2008;373:30–5 [DOI] [PubMed] [Google Scholar]
- 9.Fukuda K, Asoh S, Ishikawa M, Yamamoto Y, Ohsawa I, Ohta S. Inhalation of hydrogen gas suppresses hepatic injury caused by ischemia/reperfusion through reducing oxidative stress. Biochem Biophys Res Commun 2007;361:670–4 [DOI] [PubMed] [Google Scholar]
- 10.Tsushima Y. Functional CT of the kidney. Eur J Radiol 1999;30:191–7 [DOI] [PubMed] [Google Scholar]
- 11.Murase K, Tachibana A, Kusakabe Y, Matsuura R, Miyazaki S. A method for quantitative assessment of renal function using dynamic contrast-enhanced computed tomography: evaluation of drug-induced nephrotoxicity in rats. Med Phys 2008;35:5768–76 [DOI] [PubMed] [Google Scholar]
- 12.Murase K, Kitamura A, Tachibana A, Kusakabe Y, Matsuura R, Miyazaki S. doi: 10.1016/j.ejrad.2009.03.006. Quantitative assessment of early experimental diabetes in rats using dynamic contrast-enhanced computed tomography. Eur J Radiol (in press) [DOI] [PubMed] [Google Scholar]
- 13.Patlak CS, Blasberg RG, Fenstermacher JD. Graphical evaluation of blood-to-brain barrier transfer constants from multiple-time uptake data. J Cereb Blood Flow Metab 1983;3:1–7 [DOI] [PubMed] [Google Scholar]
- 14.Cenic A, Nabavi DG, Craen RA, Gelb AW, Lee T-Y Dynamic CT measurement of cerebral blood flow: a validation study. AJNR Am J Neuroradiol 1999;20:63–73 [PubMed] [Google Scholar]
- 15.Sato Y, Kajiyama S, Amano A, Kondo Y, Sasaki T, Handa S, et al. Hydrogen-rich pure water prevents superoxide formation in brain slices of vitamin C-depleted SMP30/GNL knockout mice. Biochem Biophys Res Commun 2008;375:346–50 [DOI] [PubMed] [Google Scholar]
- 16.Cameron JS. Renal function testing. In: Cameron JS, Davison AM, Grunfeld JP, Kerr D, Ritz E, editors. Oxford textbook of clinical nephrology. Oxford: Oxford University Press, 1992: 24–71 [Google Scholar]
- 17.Nakashima-Kamimura N, Mori T, Ohsawa I, Asoh S, Ohta S. Molecular hydrogen alleviates nephrotoxicity induced by an anti-cancer drug cisplatin without compromising anti-tumor activity in mice. Cancer Chemother Pharmacol 2009;64:753–61 [DOI] [PubMed] [Google Scholar]
- 18.Levitt MD, Ingelfinger FJ. Hydrogen and methane production in man. Ann N Y Acad Sci 1968;150:75–81 [DOI] [PubMed] [Google Scholar]
- 19.Kajiyama S, Hasegawa G, Asano M, Hosoda H, Fukui M, Nakamura N, et al. Supplementation of hydrogen-rich water improves lipid and glucose metabolism in patients with type 2 diabetes or impaired glucose tolerance. Nutr Res 2008;28:137–43 [DOI] [PubMed] [Google Scholar]
- 20.Zheng X, Mao Y, Cai J, Li Y, Liu W, Sun P, et al. Hydrogen-rich saline protects against intestinal ischemia/reperfusion injury in rats. Free Radic Res 2009;43:478–84 [DOI] [PubMed] [Google Scholar]
- 21.Nagata K, Nakashima-Kamimura N, Mikami T, Ohsawa I, Ohta S. Consumption of molecular hydrogen prevents the stress-induced impairments in hippocampus-dependent learning tasks during chronic physical restraint in mice. Neuropsychopharmacology 2009;34:501–8 [DOI] [PubMed] [Google Scholar]


