Abstract
Recent and continuous advances in CT, such as the development of multislice CT, have promoted a rapid increase in its clinical application. Today, CT accounts for approximately 10% of the total number of medical radiographic procedures worldwide. However, the growing performance of the new CT generations have increased not only the diagnostic opportunities, but also the radiation dose to the patient. The relative contribution to the collective radiation dose is now estimated to be approximately 50%. Several papers have been published concerning the intensive use of CT and its contribution to the collective dose. However, most of the literature concerns the years 1997–2003 and the dosimetric evaluations are generally limited to the main standard protocols (chest, head and abdomen), deriving the effective dose by the simple application of the diagnostic reference levels. Only specific dosimetric analyses of single and innovative procedures have been published recently. Moreover, few data comes from Italian radiology departments. This paper aims to bridge these gaps. Firstly, it characterises in terms of measured CT dose index (CTDI) two last-generation scanners of the Radiological Department of Aosta Hospital. Secondly, it evaluates the effective dose from most of the CT examinations performed from 2001 to 2008 to compare protocols and technologies in line with the suggestions of the 2007 Recommendations of the International Commission on Radiological Protection, Publication 103. Finally, it estimates the collective dose to the population.
As reported by Brenner et al for the USA and the UK [1], and by Hansen et al for Denmark [2], the use of CT in the last decade has approximately doubled. Similar trends in CT practice have been observed in many other countries [3] and today CT accounts for approximately 10% of the total number of medical radiographic procedures worldwide. This study builds on previous research [4–10] but aims to bridge some of the gaps it leaves.
Methods and materials
The data used in this study were collected between 2001 and 2008 at the Radiological Department of Aosta Hospital. From 2000 to 2005 a General Electric (GE) LightSpeed 16 pro-8 slice and a single-slice CT GE HiSpeed DX/i were operating; the latter was used only for the head protocols and was replaced by a GE LightSpeed VCT 64-slice in 2005.
The mean effective dose to the standard adult man was evaluated by means of the software ImPACT CT Patient Dosimetry Calculator (ver. 0.99x), developed by the ImPACT (Imaging Performance Assessment of CT Scanners) group [11]. This tool uses the National Radiological Protection Board (NRPB) Monte Carlo dose data sets produced in report SR250 [12], which provides normalised organ dose data for irradiation of mathematical phantoms (male, female and hermaphrodite average adult) by a range of CT scanners.
For better matching of the dose distribution for newer scanners, to scanners included in SR250, a standard CT dose index (CTDI) phantom, as defined by Bongartz et al [13], was used to measure values of the free-in-air CTDIair (in mGy/100 mAs) and of the weighted CTDIw.
Then, when mA, rotation time, mAs/rotation, collimation, slice width, pitch, start and end position are entered in the worksheet, the software evaluates the total effective dose, H, to the standard man using the tissue weighting factors, wT, given in International Commission on Radiological Protection (ICRP) 60 [14]:
 |
However, considering that the new wT factors introduced by ICRP 103 [15] can significantly affect the effective dose values, especially for abdomen and chest procedures, effective dose calculations have also been performed by replacing the weighting factors from ICRP 60 [14] with the newest ones from ICRP 103 [15] (see Table 1) in the ImPACT software. The software’s tissue database does not include the salivary glands and some remainder organs (extrathoracic region, gall bladder, lymphatic nodes and oral mucosa); consequently, the doses to these organs were not calculated.
Table 1. ICRP 60 and ICRP 103 weighting factors.
| Organ | wT |
|
| ICRP 60 | ICRP 103 | |
| Gonads | 0.20 | 0.08 |
| Bone marrow (red) | 0.12 | 0.12 |
| Colon | 0.12 | 0.12 |
| Lung | 0.12 | 0.12 |
| Stomach | 0.12 | 0.12 |
| Bladder | 0.05 | 0.04 |
| Breast | 0.05 | 0.12 |
| Liver | 0.05 | 0.04 |
| Oesophagus | 0.05 | 0.04 |
| Thyroid | 0.05 | 0.04 |
| Skin | 0.01 | 0.01 |
| Bone surface | 0.01 | 0.01 |
| Brain | 0.01 | |
| Salivary glands | 0.01 | |
| Remainder | 0.05 | 0.12 |
So, to better use the ImPACT software, we have measured the CTDIair and CTDIw in a phantom, varying the acquisition parameters as illustrated below:
tube voltage from 80 kV to 140 kV;
collimation equal to 1.25 mm, 5 mm, 10 mm, 15 mm and 20 mm for the 8-slice CT; 1.25 mm, 10 mm, 20 mm and 40 mm for the 64-slice CT;
head and body field of view (FOV) definition for the 8-slice CT; small head, head, body and large body FOV definition for the 64-slice CT.
A calibrated pencil-type ionisation chamber (Model TM30009-0494; PTW, Freiburg) with 10 cm sensitive length and accuracy equal to ±5% with a digital exposure meter (Model Diadose E; PTW, Freiburg) was used to measure the CTDI values, given by:
 |
where M represents the electrometer reading in mGy, F is the calibration factor, L is the chamber sensitive length (cm) and T is the nominal slice thickness (cm).
Measurements were performed in standard head and body CT dosimetry phantoms made of cylindrical polymethylmethacrylate (PMMA) 16 cm and 32 cm in diameter and 15 cm in length.
The CTDI values were measured free-in-air along the central axis of the scanner gantry (CTDIair) and along the central (CTDIc) and peripheral (CTDIp) axes of each dosimetry phantom. The weighted CTDI (CTDIw) was then calculated:
 |
where CTDIp represents the average value of all eight peripheral CTDIs. The normalised CTDIw (nCTDIw) in mGy/mAs is the CTDIw normalised to tube current-time product per axial rotation.
To take into account the CT output variation with X-ray collimated beam width, a collimation factor can be evaluated using the CTDIair measurements with different collimations used in the clinical practice, as:
 |
Then, the measured values of the CTDIair, CTDIw and fcoll were added in the software database to improve the accuracy of the dose calculations.
An intensive quality assurance programme has been implemented since 2001 for the CT scanners by the physicists of the Medical Physics Department, which has maintained the deviations of the CTDI values from the baseline less than ±5% according to the Radiation Protection No. 91 [16]. Consequently, the CTDIs measured in this study can be considered representative for the last decade.
Moreover, considering that the CTDI values reported in the literature [17] for the cranial protocols differ by less than 10% between the HiSpeed DX/i and LightSpeed VCT scanners, the results of the CTDI measurements can be reasonably used for the examinations performed between 2000 and 2005 on the HiSpeed CT.
The parameters of the acquisition protocols (kV, mA, noise index, rotation time, collimation, slice width and pitch) of the 46 different examinations implemented on the CT scanners were entered into the ImPACT software, as defined during the commissioning procedure, adapting GE default protocols to the radiologists’ requirements. In Table 2, the protocol parameter settings for the main body areas are reported for both the CT scanners.
Table 2. Parameter settings of the main acquisition protocols implemented on the GE LightSpeed 16 Pro 8-slice (GE-8) and on the GE LightSpeed VCT 64-slice (GE-64).
| Protocol | CT | kV | mA | Noise index | Time (s) | Collimation (mm) | Slice thickness | Pitch |
| Cerebral | GE-8 | 140 | 200 | – | 1 | 10 | 2.5 | 1 |
| 120 | 300 | – | 1 | 10 | 5 | 1 | ||
| GE-64 | 140 | 200 | – | 1 | 20 | 2.5 | 1 | |
| 120 | 300 | – | 1 | 20 | 5 | 1 | ||
| Cervical spine | GE-8 | 120 | 400 | – | 1 | 10 | 2.5 | 0.875 |
| GE-64 | 120 | 250* | 8 | 0.8 | 10 | 0.625 | 0.516 | |
| Chest, high resolution | GE-8 | 140 | 200 | – | 0.8 | 1.25 | 1.25 | 8 |
| GE-64 | 120 | 200 | – | 0.5 | 1.25 | 1.25 | 8 | |
| Chest | GE-8 | 120 | 255* | 12 | 0.8 | 10 | 5 | 1.35 |
| GE-64 | 120 | 130* | 15 | 0.5 | 40 | 5 | 0.984 | |
| Coccyx | GE-8 | 140 | 55* | 15 | 1 | 10 | 2.5 | 0.625 |
| GE-64 | 140 | 200* | 15 | 0.8 | 40 | 1.25 | 0.516 | |
| Hip | GE-8 | 140 | 120* | 14 | 1 | 20 | 5 | 1.35 |
| GE-64 | 120 | 411* | 14 | 0.8 | 40 | 1.25 | 0.984 | |
| Kidney | GE-8 | 120 | 100 | – | 0.7 | 10 | 5 | 0.875 |
| 120 | 250 | – | 0.7 | 10 | 2.5 | 0.875 | ||
| GE-64 | 120 | 100 | – | 0.5 | 40 | 2.5 | 0.516 | |
| 120 | 395* | 18 | 0.5 | 40 | 0.625 | 0.984 | ||
| Lumbar spine | GE-8 | 140 | 55* | 15 | 1 | 10 | 2.5 | 0.625 |
| GE-64 | 140 | 200* | 15 | 0.8 | 40 | 1.25 | 0.516 | |
| Thoracic spine | GE-8 | 120 | 190* | 12 | 1 | 10 | 2.5 | 0.875 |
| GE-64 | 120 | 101* | 20 | 0.8 | 40 | 1.25 | 0.516 | |
| Total abdomen | GE-8 | 120 | 179* | 11.6 | 0.8 | 20 | 5 | 1.35 |
| GE-64 | 120 | 170* | 12 | 0.5 | 40 | 5 | 0.984 |
*Protocols that use automatic exposure control.
If the automatic system of mA control was used, the protocol was reproduced on a RANDO® Phantom (175 cm tall and 75.3 kg male, The Phantom Laboratory, Salem, NY) in order to establish an average value of mA to use in the ImPACT software.
Then, the effective dose to a male and a female adult patient in any exam by both the available CTs was evaluated. Considering that the phantom used in the NRPB report SR250 [12] is based upon a mathematical representation of an average adult, the effective doses to paediatric patients were evaluated applying the corrective coefficients proposed by Khursheed et al [18] to the hermaphrodite adult’s effective dose. Errors incurred in the calculation of effective dose by the use of geometrical phantoms, owing to the anatomically incorrect organ shapes and distributions, were minimised by determining the scan ranges and by matching the fractions of radiosensitive organs irradiated at the scan boundaries in the voxel phantom to the Cristy phantom, as described by Castellano et al [19]. Moreover, the anatomical extent of each scan was also determined, taking into account the helical over-scan, which was assumed to be equal to an extra half- rotation at each end of the imaged volume. Adopting these strategies, it can be assumed that errors in estimating the effective dose to the standard adult patient with the ImPACT software remain within 20%.
Data provided by the RA2000 Siemens Radiological Information System (RIS) in use at the radiological department allowed us to obtain the number and type of CT examinations performed from 2001 to 2008 as a function of the patient’s age and sex.
By multiplying the number of any CT procedures performed per year by the dose obtained by the ImPACT software for that exam, its contribution to the collective dose was evaluated.
Finally, the number of CT examinations for 100 000 inhabitants has been evaluated using the data provided by the Aosta Valley OREPS (Osservatorio Epidemiologico per le Politiche Sociali) of number, sex and age in any different year considered in our study.
Results
Measurements of nCTDIair, nCTDIc, nCTDIp at 10 mm collimation and the calculated nCTDIw are reported in Tables 3 and 4 for the GE LightSpeed 16 Pro and GE LightSpeed VCT 64-slice, respectively. The calculated collimation factors are shown in Table 5.
Table 3. nCTDIair and nCTDIw evaluated for GE LightSpeed 16 Pro.
| kV | Head (mGy/100 mAs) |
Body (mGy/100 mAs) |
||||||
| nCTDIair | nCTDIc | nCTDIp | nCTDIw | nCTDIair | nCTDIc | nCTDIp | nCTDIw | |
| 80 | 10.9 | 6.2 | 6.6 | 6.5 | 8.1 | 1.4 | 3.5 | 2.8 |
| 100 | 18.5 | 11.7 | 12.0 | 11.9 | 14.9 | 4.4 | 6.8 | 6.0 |
| 120 | 27.8 | 18.4 | 18.7 | 18.6 | 23.1 | 5.2 | 10.3 | 8.6 |
| 140 | 40.1 | 27.2 | 27.3 | 27.2 | 34.5 | 8.1 | 16.2 | 13.5 |
nCTDIair, normalised free-in-air CT dose index; nCTDIw, normalised weighted CT dose index; nCTDIc, normalised central CT dose index; nCTDIp, normalised peripheral CT dose index.
Table 4. nCTDIair and nCTDIw evaluated for GE LightSpeed VCT 64-slice.
| kV | Small head (mGy/100 mAs) |
Head (mGy/100 mAs) |
Body (mGy/100 mAs) |
Large body (mGy/100 mAs) |
||||||||||||
| nCTDIair | nCTDIc | nCTDIp | nCTDIw | nCTDIair | nCTDIc | nCTDIp | nCTDIw | nCTDIair | nCTDIc | nCTDIp | nCTDIw | nCTDIair | nCTDIc | nCTDIp | nCTDIw | |
| 80 | 12.9 | 7.0 | 7.6 | 7.4 | 13.1 | 7.4 | 8.9 | 8.4 | 13.1 | 1.7 | 4.4 | 3.5 | 9.5 | 1.5 | 4.0 | 3.2 |
| 100 | 21.1 | 13.0 | 13.4 | 13.3 | 21.5 | 13.7 | 15.6 | 15.0 | 21.6 | 3.5 | 7.8 | 6.4 | 16.7 | 3.3 | 7.5 | 6.1 |
| 120 | 30.6 | 20.0 | 20.7 | 20.5 | 31.2 | 21.1 | 23.6 | 22.8 | 31.3 | 5.8 | 11.7 | 9.7 | 25.3 | 5.6 | 11.6 | 9.6 |
| 140 | 41.4 | 28.0 | 28.2 | 28.1 | 42.2 | 29.5 | 32.3 | 31.4 | 42.2 | 8.6 | 16.6 | 13.9 | 35.4 | 8.4 | 16.8 | 14.0 |
nCTDIair, normalised free-in-air CT dose index; nCTDIw, normalised weighted CT dose index; nCTDIc, normalised central CT dose index; nCTDIp, normalised peripheral CT dose index.
Table 5. Collimation factors evaluated for GE LightSpeed 16 Pro and GE LightSpeed VCT 64-slice.
| GE LightSpeed 16 Pro |
GE LightSpeed VCT 64-slice |
||
| Collimation (mm) | Relative CTDI | Collimation (mm) | Relative CTDI |
| 20 | 0.91 | 40 | 0.85 |
| 15 | 0.99 | 20 | 0.86 |
| 10 | 1.00 | 10 | 1.00 |
| 5 | 1.24 | 1.25 | 1.40 |
| 1.25 | 2.06 | – | – |
CTDI, CT dose index.
The effective dose calculated by the ImPACT software for male and female standard adult patients using the ICRP 103 [15] weighting factors is reported in Table 6 for both the CT scanners and each considered CT protocol. The comparison with the results obtained using the ICRP 60 [14] weighting factors is given in terms of percentage differences.
Table 6. Effective dose evaluated for each examination performed using the two CT procedures at the Radiological Department of Aosta Hospital for male and female standard adult patients.
| Exam type | Exams (protocols) list | Female |
Male |
||||
|
CT 8 slices |
CT 64 slices |
Variation from ICRP 60 |
CT 8 slices |
CT 64 slices |
Variation from ICRP 60 | ||
| (mSv) | (mSv) | (mSv) | (mSv) | ||||
| Vertebral spine | Lumbar spine* | 8.7 | 27.0 | −10% | 7.7 | 23.0 | −4% |
| Lumbar spine (pre- and post-contrast scan)* | 17.4 | 54.0 | −10% | 15.4 | 46.0 | −4% | |
| Thoracic spine* | 14.0 | 10.0 | 2% | 14.0 | 10.0 | 2% | |
| Thoracic spine (pre- and post-contrast scan)* | 28.0 | 20.0 | 2% | 28.0 | 20.0 | 2% | |
| Hip* | 5.8 | 14.0 | −18% | 5.8 | 14.0 | −22% | |
| Hip (pre- and post-contrast scan)* | 11.6 | 28.0 | −18% | 11.6 | 28.0 | −22% | |
| Cervical spine | 5.6 | 5.9 | −5% | 5.6 | 5.8 | −6% | |
| Cervical spine (pre- and post-contrast scan) | 11.2 | 11.8 | −5% | 11.2 | 11.6 | −6% | |
| Coccyx* | 5.2 | 16.0 | −24% | 5.3 | 16.0 | −24% | |
| Coccyx (with contrast)* | 10.4 | 32.0 | −24% | 10.6 | 32.0 | −24% | |
| Total body | Head–chest–abdomen* | 40.0 | 19.1 | −11% | 40.0 | 19.0 | −9% |
| Head–chest–abdomen (post-contrast scan)* | 41.0 | 20.3 | −12% | 41.0 | 20.2 | −11% | |
| Chest–abdomen* | 12.4 | 12.0 | −8% | 12.5 | 12.0 | −8% | |
| Chest–abdomen (post-contrast scan)* | 12.4 | 12.0 | −8% | 12.5 | 12.0 | −8% | |
| Abdomen | Total abdomen* | 6.4 | 5.7 | −15% | 6.2 | 5.5 | −14% |
| Total abdomen (pre- and post-contrast scan)* | 12.8 | 11.4 | −15% | 12.4 | 11.0 | −14% | |
| Abdomen superior (pre- and post-contrast scan)* | 7.8 | 7.6 | −5% | 7.2 | 6.8 | −3% | |
| Abdomen superior* | 3.9 | 3.8 | −5% | 3.6 | 3.4 | −3% | |
| Abdomen inferior (pre- and post-contrast scan)* | 16.2 | 7.0 | −20% | 16.6 | 7.4 | −24% | |
| Abdomen inferior* | 8.1 | 3.5 | −20% | 8.3 | 3.7 | −24% | |
| Kidney (pre- and post-contrast scan)* | 36.0 | 36.0 | −14% | 36.4 | 36.0 | 2% | |
| Virtual colonoscopy | 3.0 | 3.0 | −17% | 2.8 | 2.8 | 0% | |
| Chest | Chest high resolution | 3.7 | 1.2 | 9% | 3.7 | 1.2 | 9% |
| Chest* | 8.6 | 3.8 | 12% | 8.6 | 3.8 | 12% | |
| Chest (pre- and post-contrast scan)* | 17.2 | 7.6 | 12% | 17.2 | 7.6 | 12% | |
| Neck | Neck | 5.8 | 4.3 | −4% | 5.8 | 4.3 | −4% |
| Larynx | 5.8 | 4.3 | −4% | 5.8 | 4.3 | −4% | |
| Larynx (post-contrast scan)* | 5.8 | 4.3 | −4% | 5.8 | 4.3 | −4% | |
| Oral cavity – pharynx | 5.8 | 4.3 | −4% | 5.8 | 4.3 | −4% | |
| Oral cavity – pharynx (post-contrast scan)* | 5.8 | 4.3 | −4% | 5.8 | 4.3 | −4% | |
| Head | Ear | 2.8 | 3.6 | −38% | 2.8 | 3.6 | −38% |
| Ear (post-contrast scan)* | 2.8 | 3.6 | −38% | 2.8 | 3.6 | −38% | |
| Skull | 1.2 | 1.2 | −29% | 1.2 | 1.2 | −29% | |
| Intracranial angiography | 2.4 | 2.4 | −8% | 2.4 | 2.4 | −4% | |
| Paranasal sinus | 0.6 | 1.9 | −27% | 0.6 | 1.9 | −27% | |
| Paranasal sinus (pre- and post-contrast scan)* | 1.2 | 3.8 | −27% | 1.2 | 3.8 | −27% | |
| Face bone | 1.0 | 2.3 | −21% | 1.1 | 2.3 | −21% | |
| Face bone (post-contrast scan)* | 1.0 | 2.3 | −21% | 1.1 | 2.3 | −21% | |
| Cerebral | 1.2 | 1.2 | −29% | 1.2 | 1.2 | −29% | |
| Cerebral (pre- and post-contrast scan)* | 2.4 | 2.4 | −29% | 2.4 | 2.4 | −29% | |
| Eye socket | 0.4 | 1.0 | −41% | 0.4 | 1.0 | −41% | |
| Eye socket (post-contrast scan)* | 0.4 | 1.0 | −41% | 0.4 | 1.0 | −41% | |
*Protocols that use automatic exposure control.
The total number of examinations and the number of examinations per 100 000 inhabitants subdivided for sex and age are reported in Table 7.
Table 7. Number of examinations per 100 000 inhabitants subdivided by year and sex.
| Age | Sex | Number of examinations per 100 000 inhabitants |
|||||||
| 2001 | 2002 | 2003 | 2004 | 2005 | 2006 | 2007 | 2008 | ||
| Total exams | 7850 | 8864 | 9825 | 10343 | 11263 | 11695 | 11940 | 12035 | |
| All | Female | 3612 | 3879 | 4422 | 4667 | 5094 | 5329 | 5554 | 5446 |
| Male | 4238 | 4986 | 5403 | 5676 | 6169 | 6366 | 6386 | 6588 | |
| Years <2 | Female | 4 | 7 | 10 | 8 | 11 | 3 | 2 | 3 |
| Male | 32 | 21 | 14 | 12 | 13 | 8 | 7 | 5 | |
| 2 ≤ years <10 | Female | 16 | 24 | 28 | 21 | 32 | 29 | 12 | 9 |
| Male | 33 | 40 | 32 | 30 | 51 | 25 | 17 | 36 | |
| 10 ≤ years <20 | Female | 89 | 109 | 102 | 87 | 103 | 103 | 146 | 116 |
| Male | 138 | 193 | 172 | 161 | 193 | 161 | 157 | 179 | |
| 20 ≤ years <30 | Female | 197 | 205 | 218 | 270 | 227 | 247 | 205 | 231 |
| Male | 315 | 347 | 353 | 370 | 384 | 356 | 406 | 362 | |
| 30 ≤ years <40 | Female | 319 | 341 | 382 | 412 | 423 | 408 | 427 | 383 |
| Male | 427 | 503 | 604 | 532 | 574 | 575 | 623 | 566 | |
| 40 ≤ years <50 | Female | 401 | 476 | 536 | 488 | 540 | 556 | 558 | 631 |
| Male | 486 | 531 | 610 | 679 | 727 | 720 | 721 | 845 | |
| 50 ≤ years <70 | Female | 1198 | 1227 | 1399 | 1413 | 1572 | 1655 | 1655 | 1649 |
| Male | 1569 | 1752 | 1882 | 1880 | 2084 | 2446 | 2241 | 2355 | |
| Year ≥70 | Female | 1388 | 1490 | 1748 | 1966 | 2185 | 2328 | 2548 | 2425 |
| Male | 1237 | 1598 | 1737 | 2012 | 2143 | 2075 | 2213 | 2241 | |
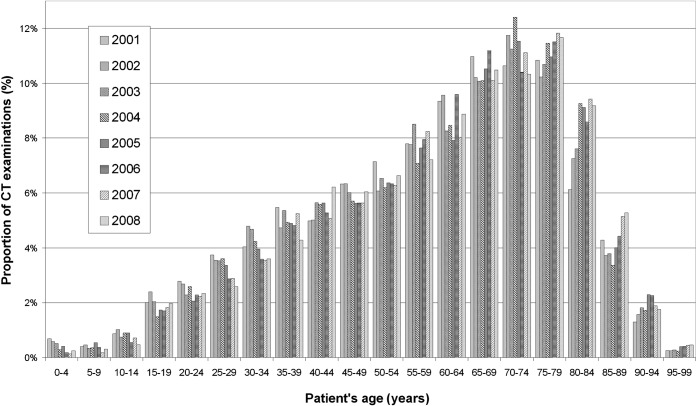
The percentage distribution of the CT procedures by patient age is reported in Figure 1. Data show that approximately 70% of the examinations are related to patients older than 50 years old.
Figure 1.
Analysis by patient's age of the proportion of CT examinations performed between 2001 and 2008 at the Radiological Department of Aosta Hospital.
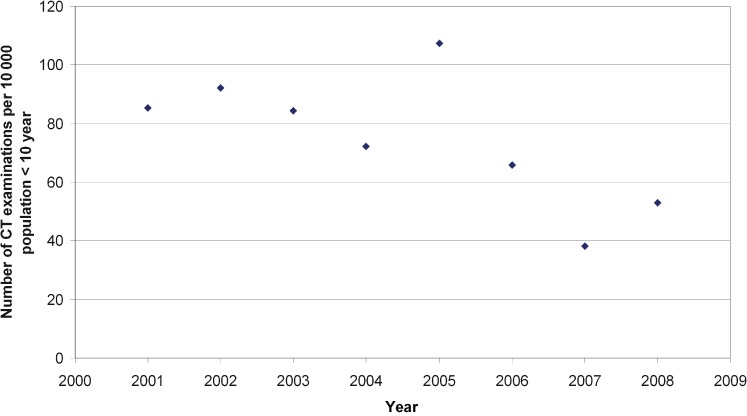
The number of patients younger than 10 years old undergoing CT procedures is illustrated in Figure 2.
Figure 2.
Number of CT examinations performed between 2001 and 2008 on paediatric patients (<10 years) at the Radiological Department of Aosta Hospital.
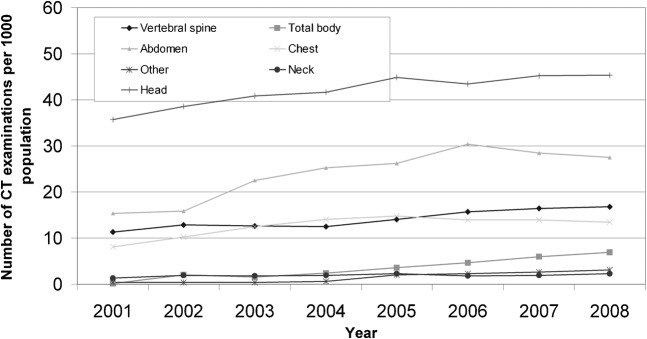
Figure 3 shows the number of the CT examinations for the main procedure types. The percentage increment between 2001 and 2008 is equal to 49%, 232%, 80%, 65%, 68% and 27% for vertebral spine, total body, abdomen, chest, neck and head, respectively.
Figure 3.
Analysis by examination type of the number of CT examinations per 1000 population between 2001 and 2008 at the Radiological Department of Aosta Hospital.
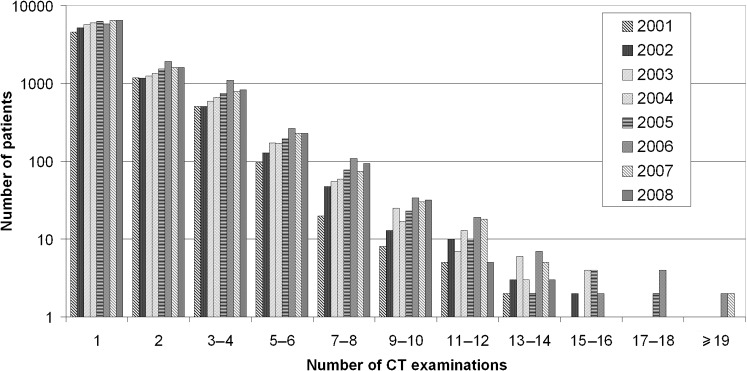
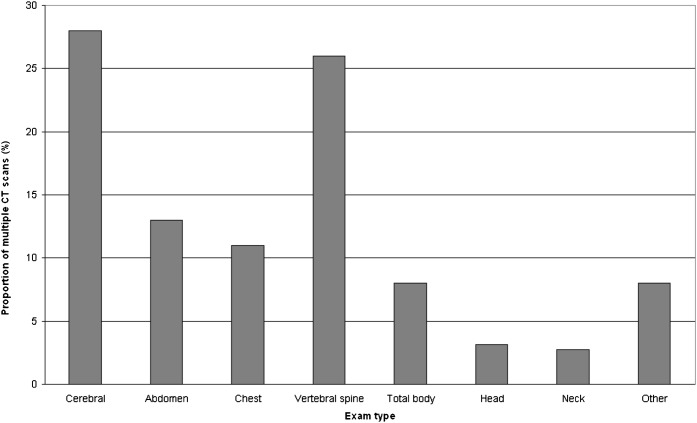
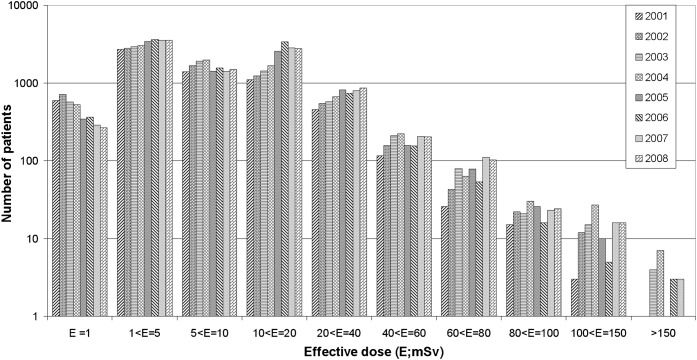
The distribution of the number of CT procedures performed on the same patient in a year is reported in Figure 4 on a logarithmic scale. The distribution of procedure type, considering only patients who have more than six scans per year, is illustrated in Figure 5. The number of patients vs the effective dose is shown in Figure 6 on a logarithmic scale.
Figure 4.
Histogram of the number of CT examinations per patient between 2001 and 2008 at the Radiological Department of Aosta Hospital.
Figure 5.
Histogram of CT examination type performed on the same patient in a year at the Radiological Department of Aosta Hospital, considering only patients that have more than six scans per year.
Figure 6.
Histogram of effective dose distribution for all CT examinations performed between 2001 and 2008 at the Radiological Department of Aosta Hospital.
The annual per caput effective dose to different age-related groups of the Aosta Valley male and female population is illustrated in Table 8.
Table 8. Per caput effective dose (mSv) to different age-related groups of the Aosta Valley male and Female population between 2001 and 2008.
| Age | Sex | 2001 | 2002 | 2003 | 2004 | 2005 | 2006 | 2007 | 2008 |
| Total population | 0.45 | 0.55 | 0.67 | 0.78 | 0.85 | 0.94 | 0.94 | 1.02 | |
| All | Female | 0.39 | 0.44 | 0.56 | 0.66 | 0.74 | 0.83 | 0.83 | 0.89 |
| Male | 0.51 | 0.67 | 0.78 | 0.91 | 0.96 | 1.06 | 1.06 | 1.16 | |
| Years <2 | Female | 0.01 | 0.02 | 0.07 | 0.05 | 0.08 | 0.01 | 0.02 | 0.01 |
| Male | 0.22 | 0.12 | 0.10 | 0.11 | 0.05 | 0.02 | 0.02 | 0.01 | |
| 2 ≤ years <10 | Female | 0.02 | 0.02 | 0.03 | 0.05 | 0.06 | 0.06 | 0.01 | 0.01 |
| Male | 0.02 | 0.05 | 0.06 | 0.04 | 0.08 | 0.02 | 0.01 | 0.08 | |
| 10 ≤ years <20 | Female | 0.08 | 0.08 | 0.07 | 0.10 | 0.10 | 0.12 | 0.18 | 0.18 |
| Male | 0.08 | 0.16 | 0.17 | 0.16 | 0.19 | 0.17 | 0.17 | 0.19 | |
| 20 ≤ years <30 | Female | 0.11 | 0.13 | 0.16 | 0.27 | 0.25 | 0.31 | 0.36 | 0.41 |
| Male | 0.16 | 0.22 | 0.27 | 0.30 | 0.35 | 0.38 | 0.47 | 0.48 | |
| 30 ≤ years <40 | Female | 0.20 | 0.22 | 0.27 | 0.31 | 0.38 | 0.39 | 0.47 | 0.49 |
| Male | 0.23 | 0.29 | 0.42 | 0.39 | 0.42 | 0.46 | 0.67 | 0.59 | |
| 40 ≤ years <50 | Female | 0.38 | 0.47 | 0.54 | 0.54 | 0.66 | 0.70 | 0.72 | 0.92 |
| Male | 0.38 | 0.44 | 0.52 | 0.63 | 0.70 | 0.71 | 0.90 | 1.21 | |
| 50 ≤ years <70 | Female | 0.60 | 0.65 | 0.82 | 0.94 | 1.12 | 1.24 | 1.14 | 1.23 |
| Male | 0.86 | 1.04 | 1.21 | 1.35 | 1.47 | 1.76 | 1.56 | 1.81 | |
| Years ≥70 | Female | 0.91 | 0.98 | 1.34 | 1.61 | 1.68 | 1.96 | 1.93 | 1.93 |
| Male | 1.78 | 2.55 | 2.75 | 3.47 | 3.40 | 3.55 | 3.27 | 3.24 | |
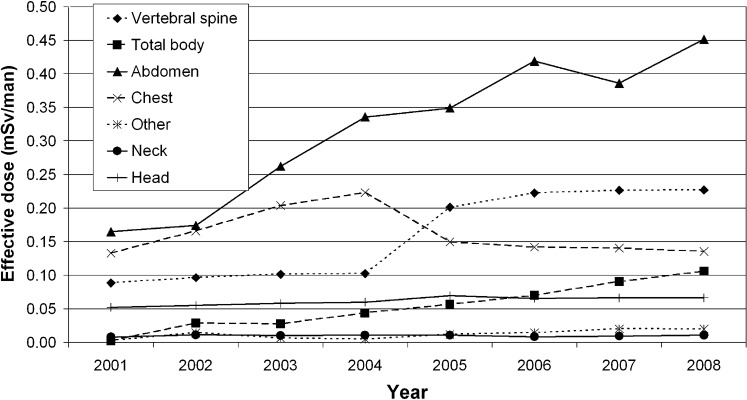
Finally, the contribution of the main clinical protocol to the per caput effective dose is reported in Figure 7.
Figure 7.
Analysis by examination type of the effective per caput dose between 2001 and 2008 in Aosta Valley.
Discussion
The values of nCTDIw measured in head and body phantoms are consistent with those reported in the literature [17]. The relative difference is within ±5%.
The collimation factors show that both the CT scanners have well-matched collimation for larger beam width (fcoll close to 1), but worse collimation for the narrowest beam width. A dose evaluation that does not take into account the collimation factor for the narrowest beam could lead to an underestimation of more than two times. All collimation factors agree well with the ImPACT data.
The comparison between the effective dose obtained for the two available CT scanners shows significant differences in dose for head, chest and vertebral spine that can be correlated to changes in exposure factors such as slice widths and noise index. Moreover, with the advent of the GE LightSpeed VCT-64, new protocols have been introduced, such as “head–chest–abdomen”, involving a large body area or requiring more than one scan and consequently leading to high doses to the patient.
The comparison between the effective doses obtained using the ICRP 103 [15] and ICRP 60 [14] weighting factors shows that the former leads to a general decrease in the effective dose, with an average percentage difference of 14% and differences between male and female patients owing to the different fractions of radiosensitive organs that are irradiated directly. This trend is mainly due to the differences in the wT values of the gonads and thyroid for the vertebral, total body, abdomen and neck protocols. The greatest deviation (up to 41%) observed in the head protocols can be related to the wT values of the brain, which in ICRP 103 [15] is considered a radiosensitive organ with a wT equal to 0.01, while in the ICRP 60 [14], as the remainder organ, it is associated to a wT of 0.025. Moreover, as reported above, the software does not take into account the salivary glands and oral mucosa, so in the head protocols calculations can lead to an underestimation of the effective dose.
The thoracic spine and chest are the only protocols that show a percentage increment in effective dose owing to the different wT value of the breast, which increases from 0.05 in ICRP 60 [14] to 0.12 in ICRP 103 [15].
The trend observed in the number of CT procedures per 1000 inhabitants reported in Figure 3 (from 78 examinations in 2001 to 120 in 2008) is consistent with that assessed for the USA (from 91 in 1991–1996 [3] to 220 in 2007 [1]), for France (from 33 in 1991–1996 [3] to 69–98 in 2002 [5]) and for Denmark (from 3 in 1979 to 55 in 2005 [2]). This may be correlated to the increased number of CT installations all over EU countries [20] (from 14.46 to 17.41 per million of population from 2000 to 2005) and consequently to the increased use of CT procedures for level 1 countries [3].
The greatest contribution to the percentage increase in the CT examinations in the Aosta Valley is represented by vertebral spine, head, total body and abdomen examinations.
The decrease observed in the number of paediatric patient examinations (Figure 2) may be considered the outcome of the efforts made by the radiologists to make the paediatricians aware of radiation protection issues in paediatrics and the corresponding need to use, if possible, a diagnostic method other than radiography.
As far as the population collective dose is concerned, the results show an increment of approximately 100% from 2001 to 2008, which is almost twice that of the number of examinations. This is because most examinations registering the largest numerical increment (abdomen, spine, total body) also show the largest effective dose values. Consistent with the above, using the ICRP 103 [15] weighting factors to estimate effective doses leads to the collective dose decreasing by 11% and 5% for the female and male population, respectively, because of the different contribution of the dose to the gonads in the CT protocols registering a higher examination number and effective dose, such as lumbar spine and kidney.
As suggested by the ICRP 103 [15], the relationship between the effective dose and the probability of delayed radiation effects is critically dependent on the age and sex of the exposed population. Thus, the calculated effective dose values have not been used for assessing radiation risks to the population of patients by simple application of the nominal probability coefficients for radiation-induced cancer given by ICRP, which have been derived for a general population.
The exponentially growing use of CT causes a marked increase in patients receiving multiple CT scans (Figure 4) and consequently high total effective doses (Figure 5). This emphasises the importance of identifying ways that the patient dose can be minimised without affecting the diagnostic information provided. With this aim, appropriate strategies of exposure justification and optimisation will help to contain the effective dose to the patient, as suggested by the ICRP guidances [14, 20] and EU Council Directive 97/43/Euratom [21]. These include selecting the optimum scanning parameters, reducing the number of scan phases, limiting the scan length and using the automated dose modulation. In some cases this could also approximate dose threshold for deterministic effects.
Finally, the role and the importance of the radiological information systems have to be pointed out: the evaluation of the patient’s lifetime cumulative dose from medical sources, of the collective dose to the population and an acceptable benefit/risk analysis. This would not be possible without the availability of comprehensive radiological data that only a radiology information system integrated with the hospital information system can provide.
Conclusions
This study presents detailed information about the number and the distributions of CT examinations performed at the Radiological Department of the Aosta Hospital from 2001 to 2008 and an accurate evaluation of the effective dose correlated to the main CT protocols implemented on two last-generation scanners. Combining these data, we obtained an acceptable estimation of the dose to the population by CT procedures.
We have considered 47 different clinical protocols and two different scanners.
The results concerning the distribution of CT examinations by patient’s age and sex, the number of examinations and the effective per caput dose are in agreement with previous studies performed in other European countries. This confirms the assumption that the Valle d’Aosta region can be considered as representative of level 1 countries (with at least 1 physician per 1000 population, as defined by United Nations Scientific Committee on the Effects of Atomic Radiation (UNSCEAR) [3]).
Our study confirms that CT represents one of the largest contributors to the radiation exposure of the population from diagnostic medical sources. Consequently, appropriate strategies of dose evaluation and optimisation must be integrated into the quality assurance and diagnostic reference levels measurement programmes, which the radiological institutions have generally already implemented. In order that these strategies can achieve this goal, it is essential that efficient and integrated radiological information systems support the clinical activities of the radiological department.
Acknowledgments
The authors express their gratitude to Dr Elisa Richetta for helping in the published database search and for participating in the first revision process of the manuscript. Gratitude is also expressed to Dr P Vittori of the Aosta Valley OREPS (Osservatorio Epidemiologico per le Politiche Sociali) for providing the cancer mortality data.
References
- 1.Brenner DJ, Hall EJ. Computed tomography – an increasing source of radiation exposure. N Engl J Med 2007;357:2277–84 [DOI] [PubMed] [Google Scholar]
- 2.Hansen J, Jurik AG. Analysis of current practice of CT examinations. Acta Oncol 2009;48:295–301 [DOI] [PubMed] [Google Scholar]
- 3.United Nations Scientific Committee on the Effects of Atomic Radiation (UNSCEAR) 2000 Sources and effects of ionizing radiation. New York, NY: United Nations, 2000 [Google Scholar]
- 4.Shannoun F, Zeeb H, Back C, Blettner M. Medical exposure of the population from diagnostic use of ionizing radiation in Luxembourg between 1994 and 2002. Health Phys 2006;91:154–62 [DOI] [PubMed] [Google Scholar]
- 5.Scanff P, Donadieu J, Pirard P, Aubert B. Population exposure to ionizing radiation from medical examinations in France. Br J Radiol 2008;81:204–13 [DOI] [PubMed] [Google Scholar]
- 6.Huda W. Effective doses to adult and pediatric patients. Pediatr Radiol 2002;32:272–9 [DOI] [PubMed] [Google Scholar]
- 7.Shrimpton PC, Hillier MC, Lewis MA, Dunn M. National survey of doses from CT in the UK: 2003. Br J Radiol 2006;79:968–80 [DOI] [PubMed] [Google Scholar]
- 8.Regulla DF, Eder H. Patient exposure in medical X-ray imaging in Europe. Radiat Prot Dosimetry 2005;114:11–25 [DOI] [PubMed] [Google Scholar]
- 9.Aroua A, Trueb P, Vader JP, Valley JF, Verdun FR. Exposure of the Swiss population by radiodiagnostics: 2003 review. Health Phys 2007;92:442–8 [DOI] [PubMed] [Google Scholar]
- 10.Hausleiter J, Meyer T, Hadamitzky M, Huber E, Zankl M, Martinoff S, el al Radiation dose estimates from cardiac multislice computed tomography in daily practice: impact of different scanning protocols on effective dose estimates. Circulation 2006;113:1305–10 [DOI] [PubMed] [Google Scholar]
- 11.London: ImPACT group (Imaging Performance Assessment of CT scanners), Imaging Physics Section of the Medical Physics Department at St George’s Hospital, Tooting; [Google Scholar]
- 12.Jones DG, Shrimpton PC. NRPB-SR250, Chilton; Normalised organ doses for X-ray computed tomography calculated using Monte Carlo techniques. [Google Scholar]
- 13.Bongartz G, Golding SJ, Jurik AG, Leonardi M, van PersijnvanMeerten E, Rodriguez R, et al. European Guidelines for Multislice Computed Tomography. European Commission; 2004 [Google Scholar]
- 14.International Commission on Radiological Protection 1990 Recommendations of the International Commission on Radiological Protection. ICRP Publication 60. Ann ICRP 1991;21:1–201 [PubMed] [Google Scholar]
- 15.International Commission on Radiological Protection The 2007 recommendations of the international commission on radiological protection. ICRP Publication 103. Ann ICRP 2008;37:1–332 [DOI] [PubMed] [Google Scholar]
- 16.Radiation Protection No. 91. Criteria for acceptability of radiological (including radiotherapy) and nuclear medicine installations, European Commission, 1997. http://ec.europa.eu/energy/nuclear/radioprotection/publication/doc/091_en.pdf 30 November 1999. Updated: February 28, 2003. Accessed 7 January 2008. [DOI] [PubMed] [Google Scholar]
- 17.Lewis M, Keat N, Edyvean S. 32–64 slice CT scanner comparison report version 14. ImPACT Report 06013, March 2006. [Google Scholar]
- 18.Khursheed A, Hillier MC, Shrimpton PC, Wall BF. Influence of patient age on normalized effective doses calculated for CT examinations. Br J Radiol 2002;75:819–30 [DOI] [PubMed] [Google Scholar]
- 19.Castellano IA, Dance DR, Evans PM. CT dosimetry: getting the best from the adult Cristy phantom. Rad Prot Dosim 2005;114:321–5 [DOI] [PubMed] [Google Scholar]
- 20.European Commission, Health and Consumers Directorate-General. Directorate C – Public Health and Risk Assessment. C2 – Health Information. http://ec.europa.eu/health/ph_information/dissemination/echi/echi_21_en.pdf Published /Updated: 22 August 2007. Accessed 7 November 2008. [Google Scholar]
- 21.Euratom The European Directive on health protection of individuals against the dangers of ionising radiation in relation to medical exposures. Brussels, Belgium; EU Directive 1997/43/Euratom; 1997 [DOI] [PubMed] [Google Scholar]


