Abstract
The purpose of this study was to develop, implement and evaluate a dedicated metal artefact reduction (MAR) method for flat-detector CT (FDCT). The algorithm uses the multidimensional raw data space to calculate surrogate attenuation values for the original metal traces in the raw data domain. The metal traces are detected automatically by a three-dimensional, threshold-based segmentation algorithm in an initial reconstructed image volume, based on twofold histogram information for calculating appropriate metal thresholds. These thresholds are combined with constrained morphological operations in the projection domain. A subsequent reconstruction of the modified raw data yields an artefact-reduced image volume that is further processed by a combining procedure that reinserts the missing metal information. For image quality assessment, measurements on semi-anthropomorphic phantoms containing metallic inserts were evaluated in terms of CT value accuracy, image noise and spatial resolution before and after correction. Measurements of the same phantoms without prostheses were used as ground truth for comparison. Cadaver measurements were performed on complex and realistic cases and to determine the influences of our correction method on the tissue surrounding the prostheses. The results showed a significant reduction of metal-induced streak artefacts (CT value differences were reduced to below 22 HU and image noise reduction of up to 200%). The cadaver measurements showed excellent results for imaging areas close to the implant and exceptional artefact suppression in these areas. Furthermore, measurements in the knee and spine regions confirmed the superiority of our method to standard one-dimensional, linear interpolation.
The introduction of digital flat detectors (FDs) in cone-beam CT during the last few years has become widely accepted for interventional and intra-operative imaging and has improved both spatial and temporal resolution [1, 2]. FD technology provides a convenient way of imaging high-contrast skeletal and contrast-enhanced vascular structures with very high isotropic spatial resolution [2]. However, in the presence of metallic implants in the field of view, e.g. dental fillings, hip prostheses or platinum detachable coil packages used for embolisation of aneurysms, metal-induced artefacts, such as dark and bright streaks between metallic objects, capping and cupping artefacts, are introduced in the reconstructed image. The non-linear artefacts are mainly caused by the linear reconstruction process and physical effects, such as high quantum noise in the metal shadow, scattered radiation and beam hardening [3, 4]. These artefacts obscure actual structures in the image, reduce image contrast and falsify CT values, resulting in a drastic deterioration in image quality that makes proper interpretation of the image volume difficult or even impossible. Moreover, falsified CT values will lead to errors when using these data for radiation therapy planning [5–7] and for attenuation correction in positron emission tomography (PET)/CT [8, 9].
Many algorithms have been published in the past with promising results which try to correct these obscuring artefacts, such as linear interpolation (LI) [9–12], multidimensional adaptive filtering in the sinogram [9, 13], or modified iterative wavelet reconstruction techniques [14–19]. However, no metal artefact reduction (MAR) algorithm is offered on commercial scanners today. The LI approach developed by Kalender et al [12] was offered for clinical CT as a software option for a few years (from 1987 to 1992) but was withdrawn because of unsatisfactory performance in complex geometries. Another reason is the introduction of interpolation-based artefacts in the corrected images and resolution losses in the close vicinity to the prosthesis after correction, mainly caused by insufficient information used for calculating surrogate data in the sinogram and missing edge information in these areas [9, 10].
We present the first MAR in FDCT imaging. This algorithm utilises the high spatial resolution of FDs to calculate surrogate attenuation values in the raw data space for the metal traces by using a multidimensional interpolation scheme. Evaluation of our method was performed on semi-anthropomorphic phantoms and on a variety of cadaver measurements.
Methods and materials
Metal artefact reduction method for FDCT
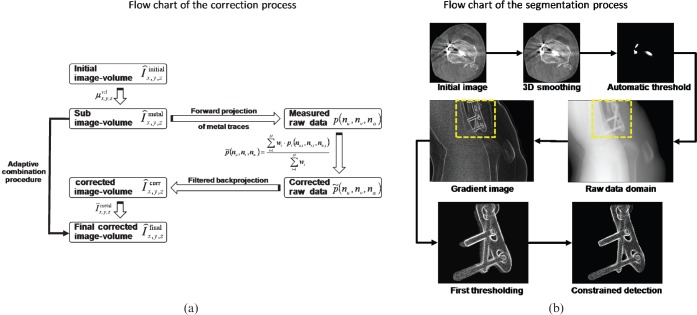
The general approach is based on a three-step correction scheme. First, a standard image volume reconstruction using a Feldkamp algorithm is performed, followed by three-dimensional (3D) metal detection. Second, a perspective forward projection of the subvolumes containing metal generates a mask for detecting the metal traces in each projection. The traces affected by metal are then replaced by a 3D interpolation scheme, using the two dimensions of the FD and the projection direction. Next, a second reconstruction of the modified raw data provides an artefact-reduced image in which the missing metal information is subsequently reinserted. Figure 1a shows a flow chart of the complete correction algorithm.
Figure 1.
(a) Flow chart of the correction algorithm. (b) Flow chart of the segmentation process. Shown are the different steps involved in the constrained prosthesis detection. Even in the case of complex objects, detection achieves good results. 3D, three-dimensional.
Detection of metal implants
In general, CT values of metallic objects are significantly higher than CT values of surrounding tissue. A simple threshold-based segmentation using a fixed threshold is a first good approximation. However, metal artefacts can disrupt the detection process owing to their high CT values and may lead to an over- or under-segmentation in the initial image. This would also lead to inaccurate metal trace detection and as a consequence would impair the correction process. To diminish these effects, we used an automatic, relative threshold to obtain a reliable criterion for metal detection. Mahnken et al [11] proposed a relative threshold based on a simple fraction of the highest CT value in the initial reconstructed image, restricting the segmentation process to CT values greater than an empirical CT value of 3000 HU. Although this provides good results for clinical CT, segmentation in FDCT may be impaired, since CT values are not that accurate compared with clinical CT. Therefore, restricting CT values may lead to an impaired detection process.
Our threshold determination is based on information obtained from a twofold histogram of the initial image volume. First, we smooth every image pixel p3Dσ(x, y, z) by using a 3D Gaussian convolution kernel as defined by
 |
(1) |
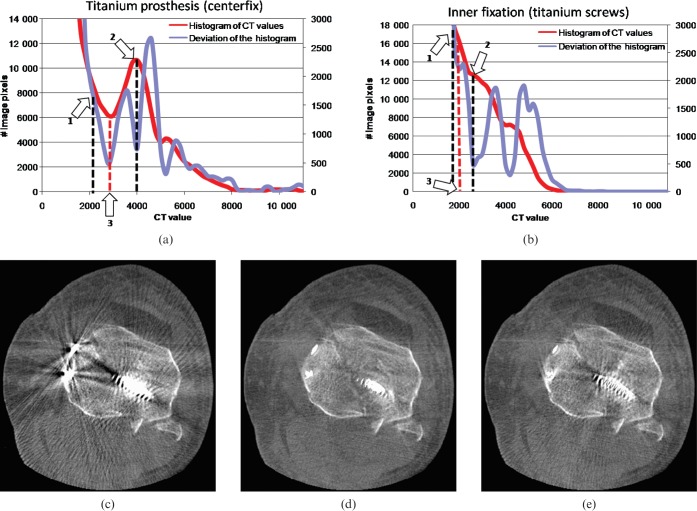
using a half-width size of 0.5 for a normalised Gaussian bell. Second, a twofold histogram of the filtered image volume and the derivative of the histogram are calculated. A first approximation of the adaptive metal threshold is given by the 20% value of the highest attenuation value of the histogram (lower value; see Figure 2a,b, arrow 1). Next, the nearest local maximum on the right hand side (in the direction of higher attenuation values) is chosen as the upper value. After finding both lower and higher values, the local minimum between them, which also coincides with a local minimum in the derivative, is used as the adaptive metal threshold for implant segmentation.
Figure 2.
(a, b) The twofold histogram for the cadaver measurements. (c) The uncorrected image; (d) the corrected image using our twofold histogram-determined threshold; (e) the corrected image using the proposed method in [11]. Arrow 1 shows the starting value for the local maximum determination. Arrow 2 indicates the detected first approximation. Arrow 3 relates to the adaptive threshold used for detection, coinciding with a local minimum of the derivative of the histogram. In both cases, the adaptive threshold lies far beyond 3000 HU (2800 HU for (a), 2200 HU for (b)), (C0/W1000).
Applying the adaptive threshold to the initial image results in a subvolume containing metal only. The subvolume is then used for a purely geometrical forward projection to identify the metal traces in each projection. The geometry used for the forward projection is directly taken from the system′s geometry calibration, therefore minimising misalignment and faulty detection. The detected metal traces in each projection are then further processed by constrained morphological operations to improve the segmentation process in the projection domain. The segmentation in the projection domain can be summarised into three major steps:
gradient calculation of the processed projection;
initial forward projection the thresholded implants; and
constrained dilation and erosion to achieve best fit to the prosthesis.
To achieve best performance in segmentation, a gradient image of each projection is segmented according to the geometrical forward projection. The most difficult step in metal trace detection is the detection of the outer boundaries on which the interpolation starts. Therefore, constrained dilation and erosion were used to adapt the segmentation process where the gradient image served as a constraining mask. The combination of dilation and erosion is performed to close the gaps between the initial segmentation in the projection and the outline of the implant given by the gradient image. A complete flow chart of the segmentation in the raw data is given in Figure 1b.
Multidimensional interpolation (3D LI)
The presented algorithm operates directly on each raw data projection of the FD. The projection itself contains the attenuation values measured by each detector element p and is defined as  where I stands for the intensity detected in the corresponding detector element and
  for the expected intensity without attenuating objects in the line of sight of the X-ray focus and the detector pixel. Each projection represents the raw data measured by the detector with geometric dimension
  . Each pixel value
  of the 3D raw data set is defined by its projection angle α and its position on the detector, where
  and
and  stands for the total number of views. For each pixel value to be interpolated in one projection
  , the nearest attenuation values containing no metal are determined in each direction. The interpolated pixel value
  is calculated as
 |
(2) |
where N denotes the number of unperturbed attenuation values (2 × 3 dimensions) and  the distance-weighting used corresponding to the contribution of each attenuation value to the interpolated value.
  is defined as
 |
(3) |
To maintain an isotropic treatment of interpolation directions, one must weight the distance in projection direction by an isotropic factor γ, since the angular increment dα varies for different scan modes. γ is given as
 |
(4) |
where du, dv are the detector pixel sizes, dα the angular increment and RFD the distance between focus and detector.
Using this highly isotropic formula for calculating surrogate data points has two advantages compared with published methods. First, the influence of each attenuation value contributing to the surrogate data is geometrically the same in each interpolation direction. No published algorithm takes special focus on this issue and interpolates, in the case of clinical CT, with the same weights in each direction. This seems counterintuitive, because angular degrees and detector element spacing vary enormously depending on the scan mode. Second, since the closest attenuation values are always used for calculation of surrogate data points we do not have to take special care of interpolation directions and therefore minimise the resolution losses caused by a wrong selection of interpolation directions.
Combination procedure
Performing a standard Feldkamp reconstruction of the modified raw data yields an artefact-reduced image volume, but without the metal implants. A combination procedure inserts the CT values of the metal implants from the initial image volumes into the corrected images. Therefore, radiologists are able to verify the positioning of the prostheses and examine tissue directly joining the implant.
Measurements
All scans were performed on two FDCT systems. First, a robot-driven C-arm CT system, which was available to us for experimental verifications (Artis zeego; Siemens Healthcare, Forchheim, Germany), was used. The dimensions of the area detector were 40 × 30 cm2 (pixel size of 308 μm at 2 × 2 pixel binning, CsI(Tl) a:Si) and because of the geometry of the FDCT system the field size was given at the centre of rotation with a 12-cm radius. Measurements were performed with standard DYNA-RUN protocol (Axiom Axis; Siemens Healthcare, Forchheim, Germany) using an acquisition angle of 220° (496 projections) and a tube voltage of 120 kV.
Second, a prototype mobile C-arm FDCT system was used for measurements on cadaver data sets with an area detector of 40 × 30 cm2 (pixel size of 388 μm unbinned). The field size of the prototype mobile C-arm system was given at the centre of rotation with a 9.5 cm radius. The reconstruction was performed with the dedicated software ImpactFD (CT Imaging GmbH, Erlangen, Germany) by standard Feldkamp reconstruction [20, 21] using a smooth convolution kernel. The correction algorithm was implemented as an optional pre-correction step in the software tool using C++ as the programming language.
Evaluation
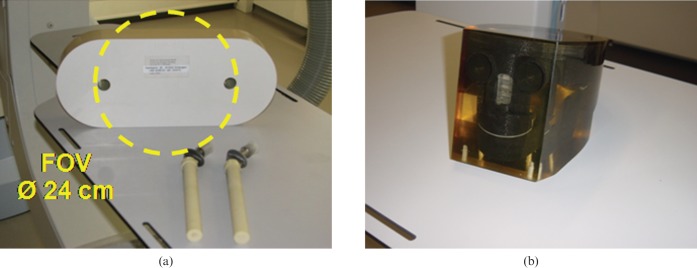
For evaluation we used tissue-equivalent, semi-anthropomorphic phantoms with optional metallic inserts. Measurements of each phantom without inserts provided metal-artefact-free images that were used for a comparison of CT values and image noise to MAR-corrected images in different regions of interest (ROIs). A hip phantom with titanium (Ti) prostheses (Figure 3a) and a head phantom with iron (fe) prostheses (Figure 3b) were used with a set of metallic inserts.
Figure 3.
(a) Anthropomorphic hip phantom with two optional titanium prosthesis and (b) anthropomorphic head phantom.
Evaluation of spatial resolution is a difficult topic in MAR evaluations. Since all methods have the ability to change image resolution, these changes are difficult to display. Standardised spatial resolution investigations, e.g. bar patterns or modulation transfer functions (MTFs), cannot be performed, since thresholding and the correction process would unavoidably eliminate these high-contrast structures. We therefore calculated difference images between the uncorrected and corrected image and investigated the changes in a narrow windowing. General changes in spatial resolution would be indicated by visible object edges or other structural information besides the artefact structures.
Results
First we illustrate the results of the automatic threshold determination. Figure 2a,b shows two twofold histograms for two cadaver measurements. As can clearly be seen, the adaptive threshold lies far beyond a fixed value of 3000 HU generally assumed to correlate to metal parts and differs from measurement to measurement, even if the same material as the prosthesis is present. Arrow 1 in Figure 2a,b correlates to the starting value for the threshold estimation process. Arrow 2 shows the first local maximum in the histogram to the right-hand side and coincides with a local minimum in the derivative of the histogram. Searching the next local minimum on the left-hand side is used as adaptive threshold for segmentation. Figure 2a is calculated to an adaptive threshold of 2800 HU, Figure 2b to an adaptive threshold of 2200 HU. Nevertheless, these values do not necessarily have to be close together, as the evaluation for the head phantom shows, where the adaptive threshold was calculated as 4200 HU. Figure 2c–e shows the uncorrected and corrected images in the knee region using our twofold histogram-based threshold and the threshold determination published in Mahnken et al [11]. Figure 2e shows that not all artefact structures were detected and metal artefacts remain.
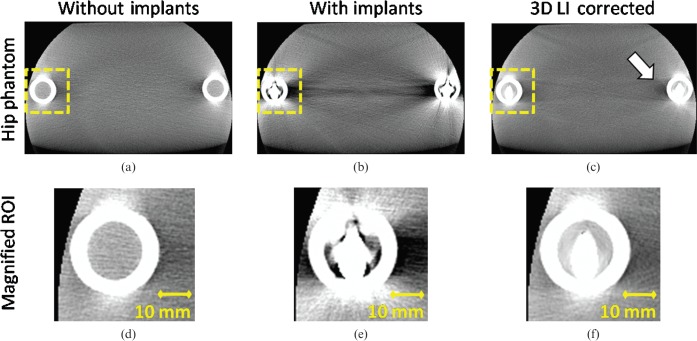
Next, we show the results for our image quality analysis. Figure 4 shows the hip phantom with and without prostheses and the corrected image. The uncorrected image suffers from beam-hardening artefacts, scattered radiation induced cupping artefacts and an elevated noise level, visible as dark and light streaks, especially along lines of highest attenuation. After correction, a more homogeneous CT value distribution as well as reduced image noise is achieved. The femur surrounding the implants as well as the position of the implants is displayed accurately (see magnified ROIs in Figure 4d–f). Although the most severe artefacts are reduced, new artefacts may appear owing to missing edge information in the interpolated areas. The arrow in Figure 4c displays these new artefacts. However, if compared with published interpolation-based MAR methods [9–12], these new artefacts are much less pronounced.
Figure 4.
The hip phantom without (a) and with bilateral optional titanium prostheses before (b) and after correction (c) (angular increment = 0.4°, acquisition angle = 220°) (C0/W1000). Three-dimensional lineas interpolation (3D LI) efficiently removes the dark and light streak artefacts especially between the implants themselves. Slight artefacts between the implant and the femur of the opposite side are introduced (see arrow). (d–f) The magnified regions of interest (ROIs) surrounding the titanium prosthesis. The femur and the position of the implant can be displayed without disturbing artefacts.
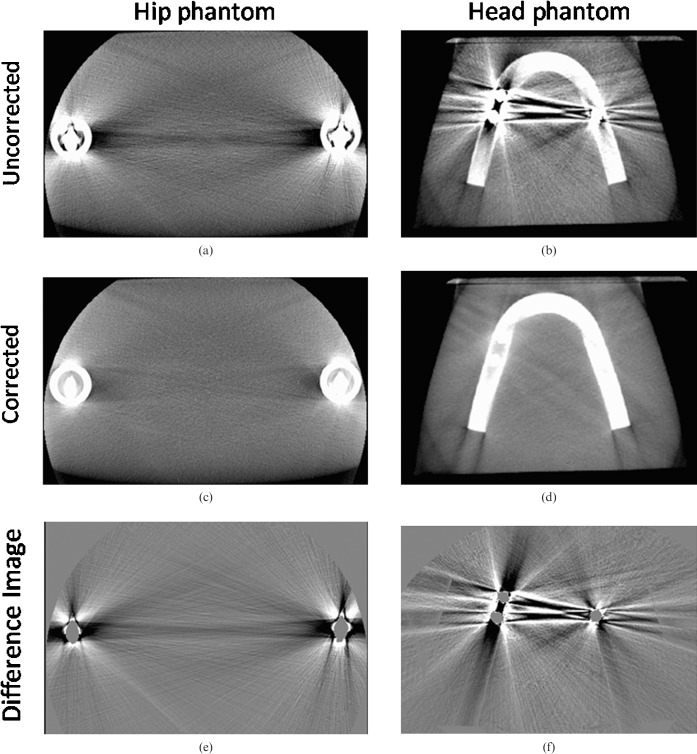
Figure 5a,b shows the uncorrected hip and head phantom. The corresponding corrected images are shown in Figure 5c,d. Figure 5e,f shows explicitly the efficient removal of metal induced artefacts without changing image resolution. Even in a narrower windowing, only streak and noise artefacts are removed and no other structural information can be seen in the difference images. Even the close vicinity to the implants, which interpolation-based methods in general were not able to restore sufficiently, was well corrected without significant resolution losses.
Figure 5.
(a) Uncorrected image of the hip phantom; (b) uncorrected image of the head phantom; (c) corrected image of the hip phantom; (d) corrected image of the head phantom; (e) difference image of the hip phantom; (f) different image of the head phantom (C0/W1000). Both difference images show a sufficient removal of metal-induced artefacts.
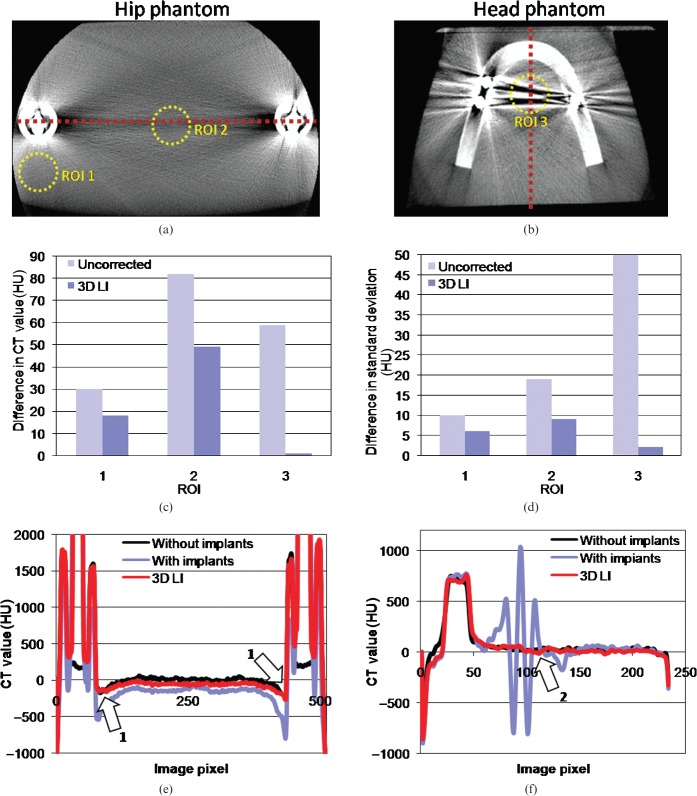
One important aspect that all MAR methods have to fulfil is the accurate displaying of CT values after correction. We compared CT values and image noise of the initial reconstructed image volumes without metal implants (which serve as ground truth) with our MAR-corrected image volumes in different ROIs (Figure 6a,b) and evaluated their conformance as well as the effect of noise suppression. Figure 6c,d shows the results of the CT value consistency test and image noise suppression (shown are the differences to the expected CT values from the ground truth and image noise of each ROI). The corrected images show a reduction of CT value deviations below 40 HU (see ROI 2, Figure 6c); in the best cases a reduction below 10 HU was achieved. On average, a reduction below 22 HU was observed. Image noise was reduced in a similar manner. In particular, areas close to the two prostheses and directions along the largest diameter of the object show a significant decrease of 14% (ROI 1 and ROI 2, up to 100% for ROI 3). After correction, the deviations in image nose are drastically reduced below 5 HU in each ROI.
Figure 6.
(a,b) The used regions of interest (ROIs) for evaluation of CT value accuracy and image noise. The red dashed line depicts the profile plot. Differences in CT values and image noise for each ROI are shown in (c) and (d); (e) and (f) show the profile plots of the hip and head phantom, respectively. After correction, a significant improvement to more benign and therefore true CT values is achieved (c, e and f). (d) The noise reduction in each ROI. After correction, differences to expected image noise is reduced below 6 HU on average (mean of 3 ROIs). Arrows 1 and 2 indicate good agreement with the expected CT values. 3D LI, three-dimensional lineas interpolation.
To emphasise the effect of noise reduction and CT value correction we generated two profile plots (Figure 6e,f). The dashed lines in Figure 6a,b show the profile used for plotting. To clarify the impact of our correction algorithm, we smoothed the initial image with a Gaussian kernel. As arrow 1 indicates in Figure 6e, the CT values of the femur surrounding the titanium prosthesis are corrected to the expected CT values in the reference phantom. Arrow 2 shows the elevation of too low and too high CT values owing to metal artefacts.
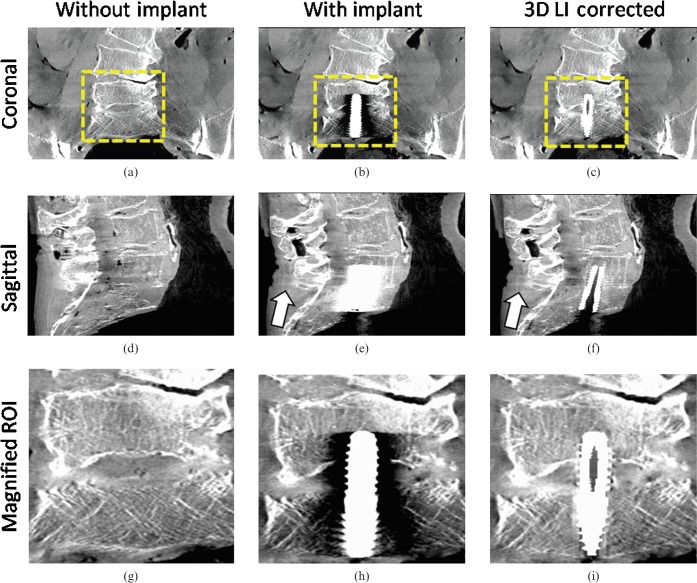
Figure 7 shows the first clinical example on a cadaver measurement in the pelvis region using a titanium screw for fixation between the lumbar vertebra L5 and the sacrum. The measurements were conducted pre- and post-operation to achieve an adequate comparison of image details before and after correction. The uncorrected image in Figure 7b,e,h suffers from strong beam hardening and scattered radiation artefacts. A proper investigation of the position of the implant as well as the L5 and sacrum is almost impossible. After correction, the disturbing artefacts are sufficiently reduced (see Figure 7c,f,i). Notice especially the configuration of the trabecular structure in the magnified ROIs. Our 3D LI method not only corrects the falsified CT values but also recovers the high spatial resolution close to the implant. The slight introduction of new artefacts as depicted by the arrow in Figure 7e,f plays a minor role. These new artefacts are reduced to only a slight darkening between the implant and the spinal process (CT value drop of 5 HU).
Figure 7.
Multiplanar reformation of a cadaver measurement in the pelvis region (pre- and post-operative, angular increment = 0.4°, acquisition angle = 220°) (C0/W1000). (a) Pre-operative image coronal; (b) post-operative image coronal, uncorrected; (c) post-operative image coronal, corrected; (d) pre-operative image coronal; (e) post-operative image sagittal, uncorrected; (f) post-operative image sagittal, corrected; (g) magnified region of interest (ROI) pre-operative; (h) post-operative, uncorrected; (i) post-operative, corrected. The appearance of beam hardening and noise artefacts are satisfactorily reduced. The position of the implant and the trabecular structure of L5 and the sacrum is displayed with high accuracy and without resolution losses. The arrow points at a slight darkening behind the spinal process due to the interpolation scheme. 3D LI, three-dimensional lineas interpolation.
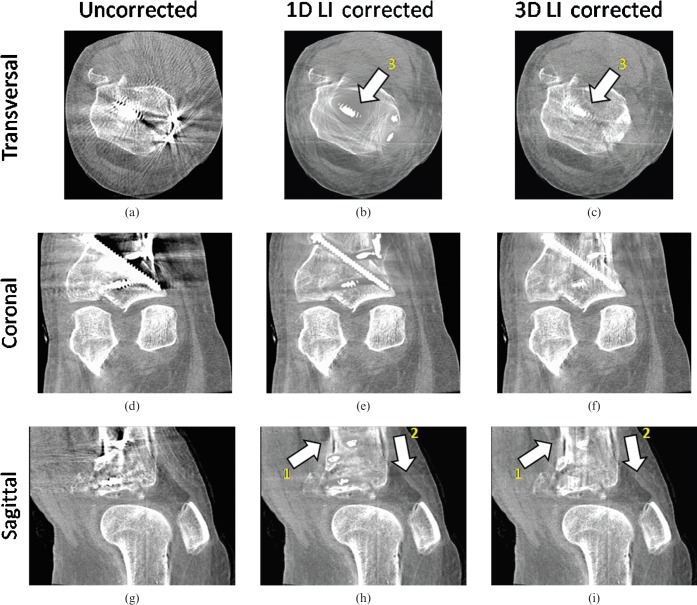
Figure 8 shows a cadaver knee data set containing an internal fixation system with several titanium screws. For performance evaluation we corrected the same image using the method published by Kalender et al [12] (one-dimensional (1D) LI) and compared it with 3D LI. Both correction schemes reduce the artefacts caused by the implants. However, when correcting the initial image with simple 1D LI, areas close to the implants still suffer from artefacts and complete information loss owing to the interpolation. New artefacts introduced by the interpolation scheme are minimised by using our 3D LI method compared with 1D LI (arrows 1 and 2 in Figure 8e,f,h,i). Also, here, the trabecular structure of the bones surrounding the implants shows an improved visibility after correction.
Figure 8.
Multiplanar reformation of a clinical data set in the knee region (angular increment = 0.5°, acquisition angle = 200°) (C0/W1000). (a) Original transversal; (b) one-dimensional (1D) linear interpolation (LI) transversal; (c) three-dimensional (3D) LI transversal; (d) original coronal; (e) 1D LI coronal; (f) 3D LI coronal; (g) original sagittal; (h) 1D LI sagittal; (i) 3D LI sagittal. Applying our metal artefact reduction (MAR) algorithm to the knee data set, strong streak artefacts between the metal implants are sufficiently reduced. Arrow 1 indicates the suppression of new artefacts due to the interpolation scheme by using 3D LI. Arrow 2 shows that 3D LI introduces less new artefacts than 1D LI. Arrow 3 shows the advantage of using 3D LI instead of 1D LI. Areas close to the metallic implant can be restored more accurately by using 3D LI.
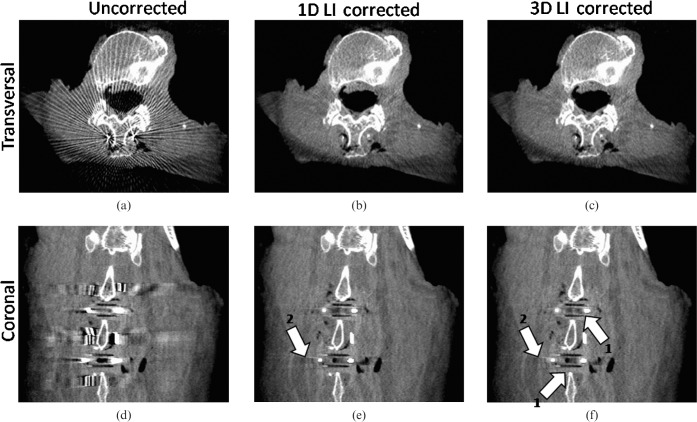
While increasing angular increments for acquisition, aliasing artefacts are increased as well. Figure 9 shows a multiplanar reformation of a cadaver measurement of two interspinal distraction implants (inter spinal distraction implant (IDI), polyether ether ketone (PEEK): aluminium–titanium) used for fixation of the lumbar vertebra. The original image in Figure 9a suffers from strong aliasing artefacts radiating from the small metallic objects as well as beam hardening artefacts close to the metal itself. After correction (Figure 9b,c), these artefacts are completely removed and a proper analysis of surrounding tissue as well as the position of the IDIs between the lumbar vertebra is enabled (Figure 9e,f). The darkening and resolution losses induced by 1D LI are not as pronounced as in Figure 8 owing to the smaller implant size and consequently a smaller error induced by the interpolation scheme in the raw data. However, the darkening that appears after correction using 1D LI (arrow 2 in Figure 9e) can be reduced by using 3D LI.
Figure 9.
Multiplanar reformation of a cadaver measurement in the spine region using two interspinal distraction implants for fixation of the lumbar vertebra (angular increment = 0.6°, acquisition angle = 220°) (C0/W1000). (a) Original transversal, (b) one-dimensional (1D) linear interpolation (LI) transversal, (c) three-dimensional (3D) LI transversal, (d) original coronal, (e) 1D LI coronal, (f) 3D LI coronal. Aliasing artefacts caused by small metallic objects are completely corrected, the introduction of new artefacts is not visible. Arrow 1 indicates the unobscured visibility of the two interspinal distraction implants used for fixation. Arrow 2 shows the decreased darkening next to the implant when using 3D LI compared with 1D LI.
Discussion
Our presented correction method achieves an improvement of image quality in metal artefact-deteriorated images and outperforms the established 1D interpolation method in terms of spatial resolution restoration and CT value accuracy. It reduces scatter, beam hardening and aliasing artefacts to a level similar to images recorded without metallic inserts and thus corrects for the main causes contributing to metal artefacts. The availability of 3D data for interpolation allows a more accurate calculation of each artificial attenuation value in the raw data compared with published algorithms without having to adjust interpolation directions. The high isotropic treatment of each interpolation direction weights every non-metal pixel according to its contribution for the surrogate data points. Our segmentation algorithm detects the metal traces in the raw data fully automatically and makes the algorithm easy to handle without any pre-sets or mandatory values.
3D LI achieves excellent performance in the vicinity of the metal prostheses. Image details and contrast are highly improved after correction and the high spatial resolution is well preserved. Especially for visualising bone structures close to metallic parts, 3D LI may be of great value for intra-operative imaging or follow-up analysis of the accurate placement and positioning of metal prosthesis, e.g. hip prostheses or inner fixations. A general resolution loss in the close vicinity as published in other interpolation-based MAR papers to the implant was not visible. This may be due to the higher spatial resolution of the FD compared with clinical CT. It allows a more precise interpolation of the implants without having to interpolate large areas to sufficiently remove the metal traces (clinical CT uses interpolation widths from the implant to the surrounding tissue of up to 5 pixels (5 × 0.6 mm = 3 mm) to ensure proper detection [11, 22] where we were able to use the nearest non-metal attenuation value owing to our precise metal trace detection, which corresponds to an interpolation width of only 308 μm for a 2 × 2 detector pixel binning.
The need for interpolating in higher dimensions becomes obvious when comparing results to simple 1D LI. Although results were promising, resolution losses in the close vicinity occurred, as well as distinct new artefacts after correction. The availability of 3D data decreased the number of new artefacts owing to a more precise interpolation and also softened the characteristics of the latter. The drop below 5 HU of new artefacts is an exceptional achievement compared with clinical CT, especially when considering that standard image noise for FDCT images often reaches values of up to ±40 HU [2, 4].
This study represents the first testing of MAR on several complex orthopaedic cases. While most published algorithms were only tested on simple phantom measurements and verified on a single clinical case, we were able to show results for not only fairly complex phantom measurements but moreover showed the applicability for interventional FDCT imaging on several realistic cases, e.g. the correction of images containing several surgical screws for fixation, which is still considered to be one of the most complex cases for any MAR correction.
The main drawback of the correction scheme is the modification of the original raw data. Although promising results were achieved with 3D LI, we cannot completely exclude the fact that other artefacts may arise from the modification of raw data. To completely evaluate the influences on image quality and diagnostics, extensive clinical studies are the focus of our ongoing research using 3D LI for correction and comparing pre- and post-operative images. New hybrid MAR correction techniques are even able to further decrease the appearance of new artefacts, as was shown for interventional clipping and coiling events by Prell et al [23]. Also, the automatic segmentation has to be evaluated further. Although the results obtained in all studied cases were convincing, further evaluation has to be conducted, especially focusing on the transition between implant and surrounding tissue as well as the precision of detection.
Conclusion
The proposed algorithm showed promising results for intra-operative and interventional FDCT imaging and may improve the diagnostic value of metal artefact-affected images. We were able to show that MAR can also be made available for FDCT. The high spatial resolution of FDCT can be restored even in areas with huge information losses owing to beam hardening, scattered radiation and noise artefacts caused by the implants. Clinical studies by experienced radiologists are still pending.
References
- 1.Jaffray DA, Siewerdsen JH. Cone-beam computed tomography with a flat-panel imager: initial performance characterization. Med Phys 2000;27:1311–23 [DOI] [PubMed] [Google Scholar]
- 2.Kalender WA, Kyriakou Y. Flat-detector computed tomography (FDCT). Eur Radiol 2007;17:2767–79 [DOI] [PubMed] [Google Scholar]
- 3.Hsieh J. Image artifacts, causes, and correction. Goldman LW, Fowlkes JB, Medical CT and ultrasound, current technology and applications Madison, WI: Advanced Medical Publishing; 1995, 487–518 [Google Scholar]
- 4.Kalender WA. Computed tomography, 2nd edition. Munichn Publicis MCD Verlag, 2005. [Google Scholar]
- 5.Prabhakar R, Ganesh T, Rath GK, Julka PK, Sridhar PS, Joshi RC, et al. Impact of different CT slice thickness on clinical target volume for 3D conformal radiation therapy. Med Dosim 2009;34:36–41 [DOI] [PubMed] [Google Scholar]
- 6.Riegel AC, Ahmad M, Sun X, Pan T. Dose calculation with respiration-averaged CT processed from cine CT without a respiratory surrogate. Med Phys 2008;35:5738–47 [DOI] [PMC free article] [PubMed] [Google Scholar]
- 7.O'Neill BD, Salerno G, Thomas K, Tait DM, Brown G. MR vs CT imaging: low rectal cancer tumour delineation for three-dimensional conformal radiotherapy. Br J Radiol 2009;82:509–13 [DOI] [PubMed] [Google Scholar]
- 8.Kamel EM, Burger C, Buck A, von Schultess GK, Goerres GW. Impact of metallic dental implants on CT-based attenuation correction in a combined PET/CT scanner. Eur Radiol 2003;13:724–28 [DOI] [PubMed] [Google Scholar]
- 9.Watzke O, Kalender WA. A pragmatic approach to metal artifacts reduction in CT: merging of metal artifact reduced images. Eur Radiol 2004;14:849–56 [DOI] [PubMed] [Google Scholar]
- 10.Watzke O. Metallartefaktreduktion in der Computertomographie. Kalender WA, editor. Berichte aus dem Institut für Medizinische Physik, 8Germany: Aachen, Shaker Verlag, 2000 [Google Scholar]
- 11.Mahnken AH, Raupach R, Wildberger JE, Jung B, Heusen N, Flohr TG, et al. A new algorithm for metal artifact reduction in computed tomography: In vitro and in vivo evaluation after total hip replacement. Invest Radiol 2003;38:769–75 [DOI] [PubMed] [Google Scholar]
- 12.Kalender WA, Hebel R, Ebersberger J. Reduction of CT artifacts caused by metallic implants. Radiology 1987;164:576–7 [DOI] [PubMed] [Google Scholar]
- 13.Kachelriess M, Watzke O, Kalender WA. Generalized mulit-dimensional adaptive filtering (MAF) for conventional and spiral single-slice, multi-slice and cone-beam CT. Med Phys 2001;28:457–90 [DOI] [PubMed] [Google Scholar]
- 14.Wang G, Snyder DL, O'Sullivan JA, Vannier MW. Iterative debluring for metal artifact reduction. IEEE Trans Med Imaging 1996;15:657–67 [DOI] [PubMed] [Google Scholar]
- 15.Wang G, Vannier MW, Cheng PC. Iterative X-ray cone-beam tomography for metal artifact reduction and local region reconstruction. Microsc Microanal 1999;5:58–65 [DOI] [PubMed] [Google Scholar]
- 16.Wang G, Frei T, Vannier MW A. fast iterative algorithm for metal artifact reduction in X-ray CT. Acad Radiol 2000;7:607–14 [DOI] [PubMed] [Google Scholar]
- 17.De Man B, Nuyts J, Dupont P, Marchal G, Suetens P. Reduction of metal streak artifacts in X-ray computed tomography using a transmission maximum a posteriori algorithm. IEEE Trans Nucl Sci 2000;47:997–81 [Google Scholar]
- 18.Zhao S, Robertson DD, Wang G, Whiting B, Bae KT. X-ray CT metal artifact reduction using wavelets: an application for imaging total hip prostheses. IEEE Trans Med Imaging 2000;19:1238–47 [DOI] [PubMed] [Google Scholar]
- 19.Zhao S, Kyongtae TB, Whiting B, Wang G. A wavelet method for metal artifact reduction with multiple metallic objects in the field of view. JOXRST 2002;10:67–76 [Google Scholar]
- 20.Feldkamp LA, Davis LC, Kress JW. Practical cone beam algorithm. J Optical Society America A 1984;1:612–19 [Google Scholar]
- 21.Parker DL. Optimal short scan convolution reconstruction for fanbeam CT. Med Phys 1982;9:254–7 [DOI] [PubMed] [Google Scholar]
- 22.Müller J, Buzug TM. Spurious structures created by interpolation-based CT metal artifact reduction. Med Imaging 2009; SPIE 7258, 72581Y. [Google Scholar]
- 23.Prell D, Kyriakou Y, Struffert T, Dörfler A, Kalender WA. Metal artifact reduction for clipping and coiling in interventional C-arm CT. AJNR Am J Neuroradiol 2009:31:634–9 [DOI] [PMC free article] [PubMed] [Google Scholar]


