

Abstract
Objectives
A second-order repair kinetics model is developed to predict damage repair rates following low or high linear energy transfer (LET) irradiations and to assess the amount of unrepairable damage produced by such radiations. The model is a further development of an earlier version designed to test if low-LET radiation repair processes could be quantified in terms of second-order kinetics. The newer version allows calculation of both the repair rate of the proportion of DNA damages that repair according to second-order kinetics and the proportion of DNA damages that do not repair.
Methods
The original and present models are intercompared in terms of their goodness-of-fit to a number of data sets obtained from different ion beams. The analysis demonstrates that the present model provides a better fit to the data in all cases studied.
Results
The proportions of unrepairable damage created by radiations of different LET predicted by the new model correspond well with previous studies on the increased effectiveness of high-LET radiations in inducing reproductive cell death. The results show that the original model may underestimate the proportion of unrepaired damage at any given time after its creation as well as failing to predict very slow or unrepairable damage components, which may result from high-LET irradiation.
Conclusion
It is suggested that the second-order model presented here offers a more realistic view of the patterns of repair in cell lines or tissues exposed to high-LET radiation.
A number of experimental [1] and theoretical [2] investigations provide evidence that radiations of different linear energy transfer (LET) produce different types of DNA damage and that a larger proportion of complex damage is being created by higher LET. There is also evidence that different types of DNA damage are associated with different repair rates, with more complex damage taking longer to repair (if at all) [3,4]. It has been reported [5,6] that highly complex DNA breaks imply in some cases such a massive loss of DNA coding that the chances of correct repair are very low.
For a given particle type, the relative biological effectiveness (RBE) increases with LET until reaching a maximum and then decreases. Belli et al [7] have recently studied the repair characteristics of double-strand breaks (DSBs) produced by radiations of different LET, arriving at the conclusion that the increase in RBE for cell inactivation with LET might be related to the increasing proportion of unrepaired DSB rather than the proportion of induced DSB. A similar conclusion was reached by Barendsen [1,8,9], who studied the LET dependency of different types of DNA strand breaks and suggested different candidates of DNA damage to explain cell inactivation. Other authors also have found a correspondence between unrepaired DNA strand breaks and cell lethality (e.g. Ritter et al [10], Goodhead et al [11] and more recently Eguchi-Kasai et al [12]), but none of them provided information on the specific nature of the unrepairable DNA strand breaks.
In practical terms, DNA DSBs with very slow repair rate (repair half-lives longer than the actual length of the radiotherapy treatment) can be considered unrepairable damage. An accurate description of the repair kinetics of cells exposed to high-LET radiations would require the knowledge of the proportion of non-repairable DNA damage incurred in those cells. The knowledge of this proportion would allow, on the one hand, a more precise calculation of the interfractional time required for full repair of the repairable DNA damage in high-LET radiotherapy, and, on the other, the possibility to establish a correlation between unrepairable DNA damage and the RBE of different particles for cell inactivation. In this paper an extended version of the models proposed by Fowler [13,14] and Dale et al [15] is presented. The extended model is capable of differentiating between unrepairable and repairable damage and can be used to determine the final proportion of the former and the repair half-time of the latter at any given LET and particle type.
Methods and materials
Modelling assumptions
Fowler [13,14] proposed that in order for a repair process to be described in terms of second-order repair kinetics (SORK), the reciprocal of the proportion of remaining DNA damage should increase linearly with increasing time allowed for repair.
However, not all the experimental data analysed by Fowler [13,14] showed such a linear increase in the reciprocal damage with time, allegedly owing to the different proportions of different types of DNA strand breaks present in the biological sample that have different repair rates. Sachs et al [16] have proposed that, given the fact that most repair pathways lead to the same dependence of response on dose and/or dose protraction as given by the standard linear quadratic (LQ) formalism, it is feasible to identify just those pathways which dominate the biologically important end points and then use these as the representatives of the repair kinetics of the system under study. The real problem is how to identify the dominant repair pathway among several overlapping processes.
The method proposed by Fowler [13,14] could be used to recognise those cases where SORK dominates the repair process. When the repair data cannot be fitted by a straight reciprocal line, two general cases of divergence can be found:
When the reciprocal number of unrepaired DSBs predicted by SORK (1/n(t)linear(SORK)) is smaller than the measured number (1/n(t)measured), such as in the case of the grey points in Figure 1, then n(t)linear(SORK) > n(t)measured, which means that the DNA damage is being resolved faster than predicted by SORK. The limit to this case corresponds to complete repair at a given (finite) time T, i.e. n(T) = 0⇒1/n(T) = ∞. This would correspond to the case in which the repair enzymes can repair all of the damage, as is the case with first-order kinetics, where there is an inherent assumption of an infinite pool of repair “drivers” which allow for complete repair.
However, if the number of reciprocal unrepaired DBS predicted by SORK is larger than the measured number, i.e. 1/n(t)linear(SORK) > 1/n(t)measured, then n(t)linear(SORK) < n(t)measured and the experimental repair rate is slower than that predicted by SORK. If the repair enzymes have difficulty in coping with the damage, owing to either the large amount or the complex nature, then at a limit time, T, there would be very slow or unrepairable damage seen which would cause the data points to tend asymptotically to 1/nunrepaired(T), at which value the system behaves as if saturated, as represented by the black points in Figure 1 (points in Figure 1 are for explanatory purposes and do not correspond to any real experimental data.)
Figure 1.
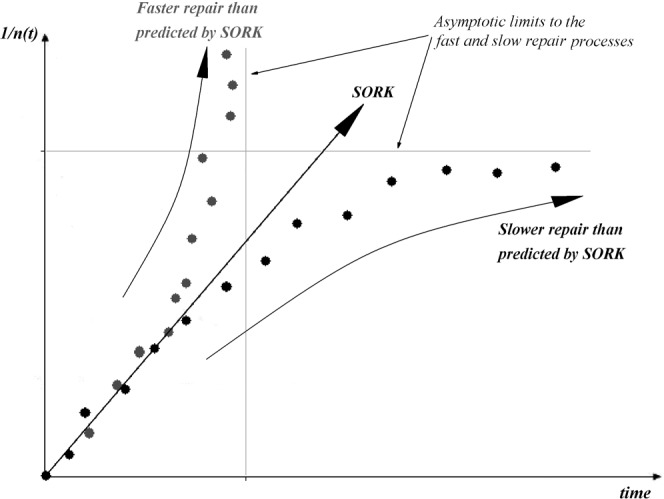
Cases where repair kinetics does not follow a second-order repair description. The lines and data points are schematic and do not represent any experimental data. As time increases, the grey data points reflect a larger reciprocal amount of unrepaired damage than the straight line representing pure second-order repair kinetics (SORK), i.e. 1/nlinear(SORK)<1/nmeasured, which implies that nlinear(SORK)>nmeasured and therefore as time increases, the amount of unrepaired damage predicted by SORK is larger than that actually measured, indicating that there is more (faster) repair than that predicted by SORK. On the contrary, as time increases, the black data points reflect a lower reciprocal amount of unrepaired damage than that predicted by the SORK line, thus: 1/nlinear(SORK)>1/nmeasured⇒nlinear(SORK)<nmeasured, implying that in this case there is less (slower) repair as time increases than that predicted by SORK. See text for detailed explanation.
The existence of very slow-repairing components after high-LET irradiation implies that the reciprocal plots will be non-linear with the data behaving according to Case 2 above. High-LET data thus provide a situation where repairable damage exists alongside a proportion of unrepairable damage, the latter being greater than observed in the case of low LET radiation. We therefore propose that once the unrepairable fraction is subtracted from the total amount of damage produced by high LET radiations, the repair process is mainly described by SORK (Figure 2).
Figure 2.
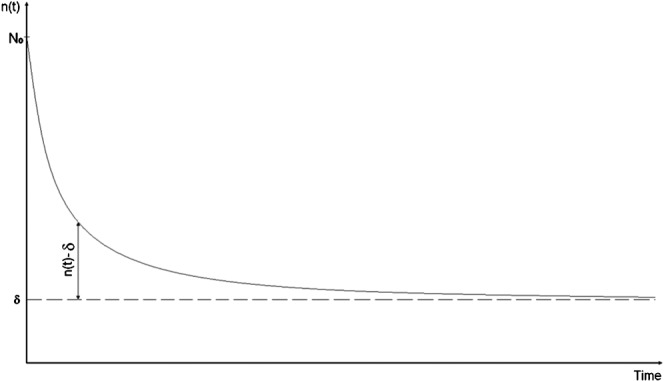
Graphical explanation of our hypothesis: once the non-repairable (or slow repairing) component (δ) has been removed, the remaining damage follows second-order repair kinetics.
Extension of the reciprocal repair model to all radiations types
Before describing the mathematical apparatus behind the model presented below, a remark about the appropriateness of the use of LET as a quantification of radiation quality in the present analysis is necessary. DNA lesion complexity and its correlation with RBE requires the knowledge of the specific ionisation pattern (or track structure) of each type of particle, which would imply that the use of LET cannot be justified. However, several authors [1,6] have made several detailed studies on the efficiency of producing different types of DNA damage for different radiation qualities, with these specified in terms of LET. This could be justified on the bases that, in general, it can be said an increase of the lesion complexity is accompanied by an increase of LET for each individual particle, and a difference in the RBE to induce cell inactivation for different particles with the same LET (as reported by Goodhead et al [17]) emphasise the importance of bearing in mind their different track structure, which cannot be measured in terms of LET. However, the current paper does not try to specify the level of complexity of the unrepairable DNA damage and only assumes that DSB (whatever its complexity might be) is the potential cause of cell reproductive death; therefore, the results in this article are reported in terms of LET.
The following assumptions based on experimental observations are considered in the new model:
The relative number of single-strand breaks (SSBs) decreases with increasing LET while the relative number of complex DSBs increases [2,18-20]. If the repair efficiency remains the same at any given LET, this would mean that the contribution of fast repair components tend to diminish with increasing high LET, with any slow repair components appearing more dominant.
When cell lines of different repair capability are exposed to radiation, the fraction of unrepairable damage (whether SSBs, DSBs or any complex mixture of them) is smallest at low LET for those lines with the highest capability of repair. As LET is increased, the fraction of unrepairable damage increases regardless of the repair capability of the cells.
If there is a dominant repair process, the use of its kinetic equations alone to describe the overall repair characteristics of the entire system is a feasible approximation.
Lesions are considered, in general, repairable or unrepairable, and it is assumed that a certain number (δ) of unrepairable lesions will always be present.
According to these assumptions, the repairable damage (i.e. n(t) – δ) will be removed at a rate described by:
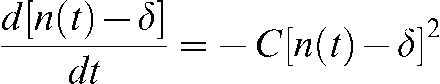 |
(1) |
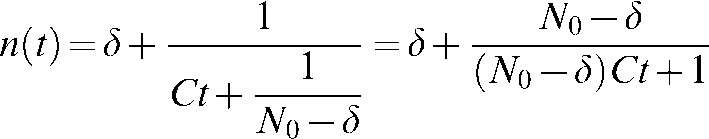
where C corresponds to the repair rate constant and n(t) corresponds to the unrepaired damage at any given time. Appendix A shows the solution to this differential equation, given as:
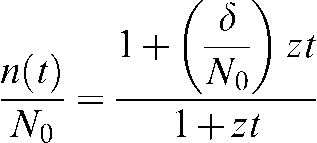 |
(2) |
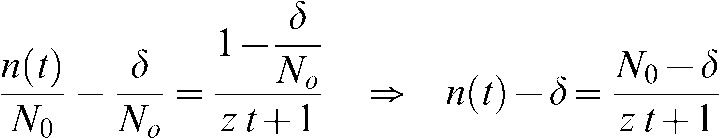
where N0 represents the initial amount of DNA damage at t = 0 h, δ/N0 represents the fraction of unrepairable damage present at any given time and z[ = (N0–δ)C] is the repair constant of the repairable lesions with units of h−1.
Equation 2 is similar in form to the equation reported by Fowler [13] for low-LET radiations where it was assumed that all breaks were repairable, i.e. δ = 0:
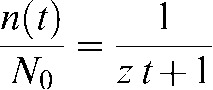 |
(3) |
It can be seen (Appendix A) that the remaining fraction of repairable breaks in Equation 2 is expressed as a fraction of the original population minus the unrepairable fraction (1 – δ/N0).
Statistical analysis
One of the objectives of this analysis was to compare the predictions obtained from the conventional Equation 3 and the extended Equation 2 models using raw data not subjected to any alteration (e.g. conversion into reciprocal of the unrepaired damage, weighting regime, etc) by the two models. In doing so, any possible bias introduced in the analysis by the transformation was avoided.
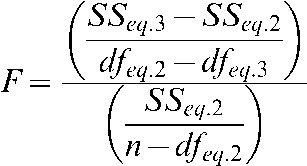
The value of the respective parameters used in Equations 2 and 3 to best fit the data were obtained using non-linear regression analysis (using R; http://www.r-project.org/). Since these are nested models with differing numbers of parameters, the Fisher test (F-test) was then applied in order to assess which model (as described by Equations 2 or 3) provided the best overall fit. The null hypothesis in this type of test is that the simplest model (fewer parameters) fits the data better than the model with more parameters and, for this hypothesis to be true with a certain level of confidence, the calculated F-value** from the regression analysis needs to be below a critical value of the F distribution (Fc), which is tabulated by David [21]. For instance, in order to accept the null hypothesis (i.e.δ= 0) with a 90% confident level, the calculated F-value from the regression of Equations 2 and 3 on a data set with six points would need to be below the critical value: Fc(dfeq.2−dfeq.3= 1,n−dfeq.2= 4, 90%) = 4.54, where dfeq.2 is the number of degrees of freedom in Equation 2 ( = 2 corresponding to z and δ), dfeq.3 is the number of degrees of freedom in Equation 3 ( = 1 corresponding to z) and n is the number of points of the data set ( = 6 in this case). However, in the present analysis it was considered more informative to calculate the corresponding confidence level to a critical value equal to the F-value obtained from the regression analysis. In this way, if the reader takes 90% as the only acceptable confidence level for data sets with six points, all those cases with the same number of data points where the confidence level is below 90% will not satisfy the rejection criteria and the null hypothesis will have to be accepted, meaning δ = 0 for those specific data sets. The conclusions derived from the present analysis are based on assuming an 85% confidence level for data sets with 5≤n≤7, 90% confidence level for data sets with 8≤n≤10 and 95% confidence level for data sets with n≥11.
Results
Analysis of the fit by Equation 2 and Equation 3 to repair data corresponding to different biological systems exposed to ions
Figures 3 and 4 show repair data for different cells exposed to different type of particles. More specifically, Figure 3a,b shows the repair kinetics of DSB Gbp−1 Gy−1 produced in normal human skin fibroblast GM5758 cells [22] exposed to nitrogen ions of different LET. Figure 3c shows the repair kinetics of DSB Gbp−1 Gy−1 produced in V79-753B cells exposed to protons [7], while Figure 3d corresponds to that produced by deuterons [7].
Figure 3.

Repair kinetics of double-stranded breaks (DSB) in GM5758 normal human fibroblast cells exposed to nitrogen: (a) 80 keV μm–1 and 125 keV μm–1; (b) 175 keV μm–1 and 225 keV μm–1 [22]. (c) Repair kinetics of DNA DSB in V79-753B cells exposed to protons [7], and (d) same cells exposed to deuterons [7]. The solid and dashed lines correspond to fits using Equations 2 and 3, respectively.
Figure 4.

Repair kinetics of DNA breaks in (a) Scid (SC3VA2) and hybrid (RD13B2) cells exposed to 50 keV μm–1 [23], (b) human epithelioid P3 cells exposed to fast neutrons [24], whereas (c) and (d) correspond to V79-753 cells exposed to helium ions [7].
Figure 4a shows the repair of DSB produced in two cell lines of different repair capacity, SC3VA2 and RD13B2, exposed to 290 MeV per nucleon carbon ions [23], and Figure 4b shows the repair kinetics of DSB cell−1 Gy−1 induced in human epithelioid P3 cells exposed to JANUS 0.85 MeV neutrons [24]. Figure 4c,d corresponds to the repair kinetics of DSB Gbp−1 Gy−1 produced in V79-753B cells [7] exposed to helium ions (the 40 keV μm–1 line corresponds).
Although the input data are reported in terms of fractions of DSB per Gbp or per cell, the results of the present analysis are expressed relative to the initial amount of damage, so the conclusions derived from these results are relevant to the repair kinetic characteristics of each individual type of cell. Finally, Figure 5 shows how the predicted fraction of unrepairable damage (δ/N0) by Equation 2 increases with LET, as observed in figures in Figures 3 and 4.
Figure 5.

Increased proportion of unrepairable damage (δ/N0) with linear energy transfer for different cell lines and particle types.
Statistical analysis of the difference between reported and predicted values of repair rates obtained from the conventional and extended models
Table 1 shows the values of the parameters for each model once they are fit to the data, as well as the values of half-repair time and fraction of unrepaired damage reported by the authors of the data. The standard error associated with these values is also reported. Although Figures 3 and 4 have been plotted in the original time unit in which the data were reported, all repair rates in Table 1 are reported in hours.
Table 1. Fraction of unrepairable damage and repair half-lives obtained from the non-linear fit of Equations 2 and 3 to the data, as well as the corresponding reported values by the authors of the data.
| Calculated±standard error | Reported | Cell line used and reference | |||
| Carbon | Shimasaki et al | δ/N0 | 0.36±0.04 | 0.39 | Scid cells (SC3VA2) [23] |
| z−1(δ ≠ 0) | 1.37 | Not reported | |||
| z−1(δ = 0) | 4.48 | ||||
| Shimasaki et al | δ/N0 | 0.19±0.04 | 0.23 | Hybrid cells (RD13B2) [23] | |
| z−1(δ ≠ 0) | 0.52 | Not reported | |||
| z−1(δ = 0) | 1.11 | ||||
| Protons | 11 keV μm–1 | δ/N0 | 0±0.05 | 0.21±0.03 | V79-753B [7] |
| z−1(δ ≠ 0) | 0.61 | 0.67±0.12 | |||
| z−1(δ = 0) | 0.61 | ||||
| 31keV μm–1 | δ/N0 | 0.45±0.05 | 0.59±0.05 | ||
| z−1(δ ≠ 0) | 0.65 | 0.6±0.3 | |||
| z−1(δ = 0) | 2.15 | ||||
| Neutrons | Peak et al | δ/N0 | 0.21±0.13 | 0.25 | Human epithelioid P3 cells [24] |
| z−1(δ ≠ 0) | 0.41 | 1.5 | |||
| z−1(δ = 0) | 0.61 | ||||
| Deuterons | 13 keV μm–1 | δ/N0 | 0.007±0.033 | 0.23±0.04 | V79-753B [7] |
| z−1(δ ≠ 0) | 0.58 | 0.54±0.08 | |||
| z−1(δ = 0) | 0.58 | ||||
| 62 keV μm–1 | δ/N0 | 0.43±0.04 | 0.54±0.03 | ||
| z−1(δ ≠ 0) | 0.54 | 0.52±0.1 | |||
| z−1(δ = 0) | 1.86 | ||||
| Helium | 40 keV μm–1 | δ/N0 | 0.08±0.04 | 0.06±0.06 | V79-753B [7] |
| z−1(δ ≠ 0) | 0.31 | τfast = 0.27±0.07 τslow = 6.8±6.1 | |||
| z−1(δ = 0) | 0.42 | ||||
| 53 keV μm–1 3He2+ | δ/N0 | 0.15±0.02 | 0.37±0.02 | ||
| z−1(δ ≠ 0) | 0.69 | 0.67±0.08 | |||
| z−1(δ = 0) | 0.98 | ||||
| 53 keV μm–1 4He2+ | δ/N0 | 0.23±0.019 | 0.39±0.03 | ||
| z−1(δ ≠ 0) | 0.56 | 0.6±0.1 | |||
| z−1(δ = 0) | 1.01 | ||||
| 81 keV μm–1 | δ/N0 | 0.35±0.029 | 0.49±0.02 | ||
| z−1(δ ≠ 0) | 0.59 | 0.63±0.07 | |||
| z−1(δ = 0) | 1.49 | ||||
| 123 keV μm–1 | δ/N0 | 0.41±0.17 | 0.68±0.03 | ||
| z−1(δ ≠ 0) | 1.74 | 1.46±1.33 | |||
| z−1(δ = 0) | 3.94 | ||||
| Nitrogen | 80 keV μm–1 | δ/N0 | 0.03±0.012 | 0.05±0.02 | GM5758 [22] |
| z−1(δ ≠ 0) | 0.44 | τfast = 0.28±0.03 τslow = 2.7±0.5 | |||
| z−1(δ = 0) | 0.48 | ||||
| 125 keV μm–1 | δ/N0 | 0.06±0.02 | 0.07±0.04 | ||
| z−1(δ ≠ 0) | 0.67 | τfast = 0.22±0.08 τslow = 2.7±0.5 | |||
| z−1(δ = 0) | 0.83 | ||||
| 175 keV μm–1 | δ/N0 | 0.11±0.03 | 0.12±0.04 | ||
| z−1(δ ≠ 0) | 0.47 | τfast = 0.25±0.12 τslow = 2.1±1.5 | |||
| z−1(δ = 0) | 0.66 | ||||
| 225 keV μm–1 | δ/N0 | 0.14±0.05 | 0.12±0.02 | ||
| z−1(δ ≠ 0) | 0.60 | τfast = 0.2±0.07 τslow = 4.1±1.4 | |||
| z−1(δ = 0) | 0.95 |
Two features become clear after an analysis of Table 1:
The fraction of unrepairable damage predicted from Equation 2 is very close to (but always lower than) the reported experimental values of unrepaired damage in each data set. It would be expected that the longer the sampled repair time, the closer these two fractions would be, and the closer the slopes of the solid and the dashed lines in Figure 6. It is only at infinite repair time that the reported unrepaired damage and the calculated unrepairable damage would be totally correlated, so the value of r2 would also be expected to increase the longer the experimental repair time.
The half-repair times predicted by Equation 2 are much closer to the reported half-life times than those predicted by Equation 3, which justifies the need to consider the existence of a fraction of unrepairable damage, particularly in the case of high-LET radiations. The better prediction of the repair kinetic parameters when δ is assumed ≠ 0 is observed in Table 2, where the results of the F-test are shown.
Figure 6.

Correlation between the reported unrepaired fraction of DNA damage by the authors of the data and the predicted unrepairable damage (δ/N0) by Equation 2.
Table 2. Results of the null hypothesis test (F-test) applied to the data in order to determine what value of δ (either equal to 0 or different than 0) better explains the data.
| n | F | p | Corresponding confidence level to the calculated F-value | Hypotheses testa | ||
| Carbon | Shimasaki et al. (SC3VA2) [23] | 7 | 28.80 | 3.02 × 10⁻³ | Fc(1,5,99.7%) | δ≠0 |
| Shimasaki et al. (RD13B2) [23] | 7 | 23.48 | 4.69 × 10⁻³ | Fc(1,5,99.5%) | δ≠0 | |
| Protons | 11 keV μm–1 | 5 | 1.23 × 10⁻¹⁵ | 1.00 | Fc(1,3,∼0%) | δ = 0 |
| 31 keV μm–1 | 5 | 30.73 | 0.01 | Fc(1,3,98.8%) | δ≠0 | |
| Neutrons | Peak et al [24] | 9 | 1.63 | 0.24 | Fc(1,7,75.8%) | δ = 0 |
| Deuterons | 13 keV μm–1 | 5 | 0.05 | 0.84 | Fc(1,3,16.3%) | δ = 0 |
| 62 keV μm–1 | 5 | 36.40 | 9.13 × 10⁻³ | Fc(1,3,99.1%) | δ≠0 | |
| Helium | 40 keV μm–1 | 6 | 3.94 | 0.12 | Fc(1,4,88.2%) | δ≠0 |
| 53 keV μm–1 [3He2+] | 5 | 61.80 | 4.29 × 10⁻³ | Fc(1,3,99.6%) | δ≠0 | |
| 53 keV μm–1 [4He2+] | 5 | 88.59 | 2.54 × 10⁻³ | Fc(1,3,99.7%) | δ≠0 | |
| 81 keV μm–1 | 5 | 58.77 | 4.61 × 10⁻³ | Fc(1,3,99.5%) | δ≠0 | |
| 123 keV μm–1 | 5 | 1.78 | 0.27 | Fc(1,3,72.6%) | δ = 0 | |
| Nitrogen | 80 keV μm–1 | 6 | 6.16 | 6.81 × 10⁻² | Fc(1,4,93.2%) | δ≠0 |
| 125 keV μm–1 | 6 | 6.23 | 6.72 × 10⁻² | Fc(1,4,93.3%) | δ≠0 | |
| 175 keV μm–1 | 6 | 12.17 | 2.52 × 10⁻² | Fc(1,4,97.5%) | δ≠0 | |
| 225 keV μm–1 | 6 | 8.20 | 4.58 × 10⁻² | Fc(1,4,95.4%) | δ≠0 |
The last column corresponds to the result of the hypothesis test for predetermined confidence intervals associated to the number of points in each data set. The larger the number of points, the higher the confidence level must be in order to reject the null hypothesis (which in this case represents δ = 0), for instance, for n≥11, Y% must be ≥95%.
n, number points included in each data set; F, calculated value of F using the formulation included in the footnote in the text after Equation 2 and 3 have been fitted to the data; p, p-value commonly used to indicate statistical significance of the null hypothesis; Fc(1,X,Y%), confidence level of a critical F-value (Fc) equals the F-value.
an = 5–7⇒CL = 85%, n = 8–10⇒CL = 90%, n≥11⇒CL = 95%.
According to Figures 3 and 4, it seems that at the very end of range (largest LETs) for certain particles (such as protons, deuterons and helium), Equation 3 seems to fit the data sufficiently well and thus it would be more difficult to justify (from a statistical point of view) the use of an extra parameter. This could be the reason the F-test predicts δ/N0 = 0 for helium with LET = 123 keV μm–1 in Table 2.
Discussion
We have demonstrated that the proposed model is able to better predict the “slowing down” of repair with time after irradiation using only two parameters, which can be obtained from simple non-linear regression analysis. Furthermore, it offers a better estimation of the repair rate and allows determination, for any radiation quality, of the fraction of very slow (or potentially unrepairable) repair component. It is true that by increasing the number of degrees of freedom from one (in the case of Equation 3) to two (in Equation 2) a better fit to the data would be expected. However, the extra parameter added brings into consideration the non-repairable effects that high-LET radiations have on the repair process, so the extra parameter is necessary to complete the original model (Equation 3) if it is to be used in the assessment of repair in high-LET radiotherapy.
The functionality of δ/N0 with LET is shown in Figure 5. One important feature is that different particles with the same LET will produce different levels of unrepairable damage, as one would expect from their different track structure. This resembles the results from Goodhead et al [17], where it was shown that protons and α-particles with the same LET have different biological effectiveness (measured in terms of the ratio of the linear coefficients of the LQ model). Similarly, Cherubini et al [25] found that the maximum RBE shifts to higher LETs for the heavier isotopes of the same atomic number (e.g. deuterons compared with protons and 4He ions compared with 3He ions), which was also measured and modelled by Furusawa et al [26].
Although it is still controversial to assume that the amount of unrepaired damage is correlated to RBE for cell inactivation, Figure 5 also shows the increased efficiency of high-LET radiations to induce unrepairable DNA damage. Ritter et al [10] reported that, over an LET range of 1–1953 keV μm–1, there was an excellent correlation between the relative efficiency of exponential (single-hit) cell killing (i.e. RBEmax) and the induction of non-rejoining DNA strand breaks (NRBs) in V79 S171 cells exposed to a variety of low-energy heavy ions, as measured on alkaline sucrose gradients (ASGs). The same correlation was also found for Chang human liver cells [27] and Chinese hamster CH2B2 cells [28]. Goodhead et al [11] performed a similar correlation study between the relative efficiency of cell kill induction at very high doses (∼RBEmin) and the production of NRBs, and found that there was a good correlation but not as good as in the case of RBEmax and NRBs (especially for LET ≥70 keV μm–1). In all of these studies, unrepaired damage is treated in general terms and without specifying the type(s) of DNA damage(s) it may concern, as ASG technique detects three classes of DNA damage as breaks: SSBs, DSBs and alkali-labile lesions. Thus, although a good correlation between radiosensitivity and non-repaired DSB (measured using ASG) has been reported by Dikomey et al [29] for several mammalian cell lines exposed to X-rays and by other teams for other sources of radiation (α-particles [30], neutrons [31]), the specific type of DNA damage or combination of damages inducing the increase in cell inactivation RBE with LET is still controversial. However, in the same way one could postulate that the repair process can be described in terms of a dominant repair pathway that follows SORK, we could also postulate that δ represents a “dominant type of unrepairable damage” that will be ultimately responsible for the increased radiosensitivity of the cell with LET. This would provide the opportunity to treat δ/N0 as a parameter proportional to RBE for cell kill and to measure RBE in terms of the repair kinetics of the cellular DNA. Assuming DSB is the dominant type of unrepairable damage and that this unrepairable damage is the main cause of cell death [10,32,33], several authors have reported a quadratic relationship between dose and the unrepaired fraction of DSB after different repair periods [30,34,35], hence the relationship between δ/N0 and RBE for cell inactivation could be formulated as:
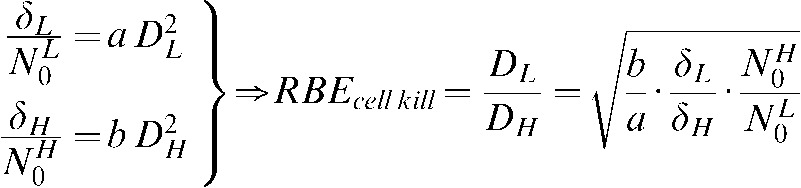 |
(4) |
where a and b are obtained from the quadratic fit to the experimental data on residual DSBs at different dose levels for low- and high-LET radiations. Experimental data would be required to corroborate the validity of this alternative methodology to calculate RBE values based on the characteristic repair kinetics of the biological system under study.
At the moment it is impossible to know how much other types of DNA damage, such as residual SSBs and misrepair, contribute to the final fate of the cell, although different authors [30,36,37] have suggested that these contributions are likely to be much lower than that from residual DSBs. Anyhow, residual SSB, DSB and misrepair, are all different expressions of unrepairable damage and therefore δ/N0, since it is derived from experimental data, may reflect the outcome of several possibilities.
Repair kinetics must also be considered when using alternative fractionation schemes in radiotherapy, and there is an increasing interest in using hypofractionation to treat specific sites with proton and carbon ions. According to the discussion so far, the use of larger doses of these radiations will increase the fraction of unrepairable DNA damage due to, first, the increase in LET along the Bragg peak or spread-out Bragg peak (SOBP), and second, due to the quadratic increase of the fraction of unrepairable damage with dose. The increase of the unrepairable damage will imply a smaller repairable fraction, which in turn will imply shorter half-repair times as LET and dose increases. For instance, in the case of helium-4 ions, Table 1 predicts unrepairable fractions of 0.23±0.019 for 53 keV μm–1, 0.35±0.029 for 81 keV μm–1 and 0.41±0.17 for 123 keV μm–1. If for n number of half repair times Equation 2 predicts an unrepaired fraction of 1 + (δ/N0)n/1 + n, then the number of half-lives required to reduce the repairable fraction (1–(δ/N0)) by 95% would be 19. As the half-lives for 53 keV μm–1, 81 keV μm–1 and 124 keV μm–1 are 0.56 h, 0.86 h and 0.54 h, respectively (Table 1), the required total times to allow 95% repair for each of these radiation qualities is 20.14 h, 16.34 h and 10.26 h, respectively. The decrease in the total repair time required to produce the same level of repair as LET increases could seem counterintuitive, but it is simply a reflection of the decreasing amount of repairable damage as the radiation quality increases. It is therefore necessary to know the amount of unrepairable damage at each individual LET in order to establish the minimum interfractional time, which would be the time corresponding to the tissue being exposed to the lowest LET in the beam. However, this effect might be counterbalanced by the faster repair kinetics of late-reacting tissues than that of early-reacting tissues. The increase in dose per fraction in hypofractionated regimes will increase the unrepairable damage both on the low- and the high-LET sections of the beam, so, to increase the gradient of unrepairable damage (based on an increase of dose gradient) towards the target volume in hypofractionated regimes, a larger number of beams would be required.
Acknowledgments
This study was funded in full by the Cyclotron Trust, UK (www.neutrontherapy.co.uk). The authors want to thank Professor Bleddyn Jones for his comments and suggestions about the manuscript.
Appendix
Equation 1 is formulated in the main text as: 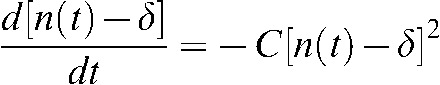 . This equation can be solved using the following transformation:
 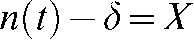 , where δ is the intrinsic number of unrepairable DNA breaks at any time. Then Equation 1 becomes:
 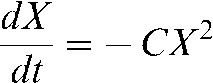 , which can be rearranged and resolved as follows
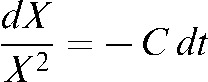 |
(A1) |
and taking integrals on both sides of equation A1, and solving the integrals, we arrive to 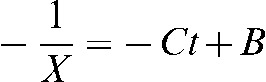 where we substitute the value of X and rearrange to arrive to:
 |
(A2) |
The value of the integral constant B is found at t = 0: 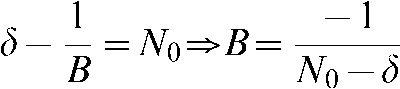
 |
(A3) |
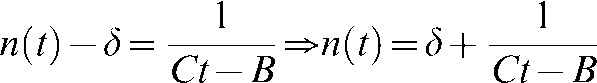
In most cases, repair kinetic data is reported in terms of fractions of the total initial amount of unrepaired DNA breaks, i.e. in terms of the fraction of repairable breaks (n(t)/N0) and the fraction of unrepairable DNA breaks (δ/N0), which allows Equation A3 to be transformed as follows:
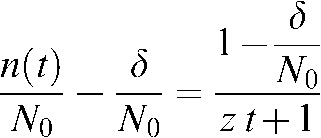 |
(A4) |
where, z = ( N0–δ)C is the repair constant of the repairable lesions with units of h−1. This expression can also be trivially reorganised to finally arrive to:
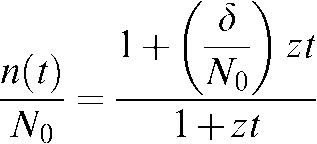 |
(A5) |
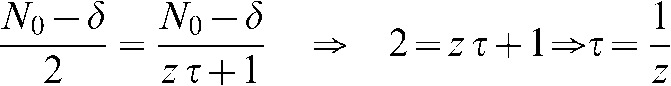
To obtain the half-repair time (τ) characteristic of the damage produced, Equation A4 can be re-arranged as follows:
 |
(A6) |
Thus, if we define t = τ when 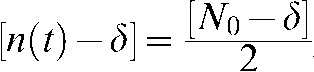 , Equation A4 becomes:
 |
Footnotes
 |
References
- 1.Barendsen GW. The relationships between RBE and LET for different types of lethal damage in mammalian cells: biophysical and molecular mechanisms. Radiat Res 1994;139:257–70 [PubMed] [Google Scholar]
- 2.Kozubek S, Krasavin EA. Cell sensitivity to irradiation and DNA repair processes. II. The cell sensitivity to ionizing radiation of different LETs. Neoplasma 1984;31:685–95 [PubMed] [Google Scholar]
- 3.Frankenberg-Schwager M. Review of repair kinetics for DNA damage induced in eukaryotic cells in vitro by ionizing radiation. Radiother Oncol 1989;14:307–20 [DOI] [PubMed] [Google Scholar]
- 4.Roots R, Holley W, Chatterjee A, Irizarry M, Kraft G. The formation of strand breaks in DNA after high-LET irradiation: a comparison of data from in vitro and cellular systems. Int J Radiat Biol 1990;58:55–69 [DOI] [PubMed] [Google Scholar]
- 5.Ward JF. Biochemestry of DNA lesions. Radiat Res 1985;104:S103–S111 [PubMed] [Google Scholar]
- 6.Prise KM. Use of radiation quality as a probe for DNA lesion complexity. Int J Radiat Biol 1994;65:43–8 [DOI] [PubMed] [Google Scholar]
- 7.Belli M, Cherubini R, Dalla Vecchias M, Dini V, Moschini G, Signoretti C, et al. DNA DSB induction and rejoining in V79 cells irradiated with light ions: a constant field gel electrophoresis study. Int J Radiat Biol 2000;76:1095–104 [DOI] [PubMed] [Google Scholar]
- 8.Barendsen GW. Mechanisms of cell reproductive death and shapes of radiation dose–survival curve of mammalian cells. Int J Radiat Biol 1990;57:885–96 [DOI] [PubMed] [Google Scholar]
- 9.Barendsen GW. Parameters of linear-quadratic radiation dose effect relationships: dependence on LET and mechanisms of reproductive cell death. Int J Radiat Biol 1997;71:649–55 [DOI] [PubMed] [Google Scholar]
- 10.Ritter MA, Cleaver JE, Tobias CA. High-LET radiations induce a large proportion of non-rejoining DNA breaks. Nature 1977;266:653–5 [DOI] [PubMed] [Google Scholar]
- 11.Goodhead DT, Thacker J, Cox R. Non-rejoining DNA breaks and cell inactivation. Nature 1978;272:379–80 [DOI] [PubMed] [Google Scholar]
- 12.Eguchi-Kasai K, Murakami M, Itsukaichi H, Fukutsu K, Kanai T, Furusawa Y, et al. The role of DNA repair on cell killing by charged particles. Adv Space Res 1996;18:109–18 [DOI] [PubMed] [Google Scholar]
- 13.Fowler JF. Is repair of DNA strand break damage from ionizing radiation second-order rather than first order? A simpler explanation of apparently multiexponential repair. Radiat Res 1999;152:124–36 [PubMed] [Google Scholar]
- 14.Fowler JF. Repair between dose fractions: A simpler method of analyzing and reporting apparently biexponential repair. Radiat Res 2002;158:141–51 [DOI] [PubMed] [Google Scholar]
- 15.Dale RG, Fowler JF, Jones B. A new incomplete-repair model based on a ‘Reciprocal-time’ patter of sublethal damage repair. Acta Oncol 1999;38:919–29 [DOI] [PubMed] [Google Scholar]
- 16.Sachs RK, Hahnfeld P, Brenners J. The link between low-LET dose-response relations and the underlying kinetics of damage production/repair/misrepair. Int J Radiat Biol 1997;72:351–74 [DOI] [PubMed] [Google Scholar]
- 17.Goodhead DT, Belli M, Mill AJ, Bance DA, Allens LA, Hall SC, et al. Direct comparison between protons and α-particles of the same LET: I. Irradiation methods and inactivation of asynchronous V79, HeLa and C3H 10T1/2 cells. Int J Rad Biol 1992;61:611–24 [DOI] [PubMed] [Google Scholar]
- 18.Kampf G, Eichhorn K. DNA strand breakage by different radiation qualities and relations to cell killing: further results after the influence of α-particles and carbon ions. Stud Biophys 1983;93:17–26 [Google Scholar]
- 19.Kampf G, Regel K, Eichhorn K, Abel H. Radiation-induced DNA strand breaks in dependence on radiation quality and oxygen and their repair in mammalian cells. Stud Biophys 1977;61:53–60 [Google Scholar]
- 20.Zaider M. A mathematical formalism describing the yield of radiation-induced single- and double-strand DNA breaks, and its dependence on radiation quality. Rad Res 1993;134:1–8 [PubMed] [Google Scholar]
- 21.David FN. The moments of the z and F distributions. Biometrica 1949;36:394–403 [PubMed] [Google Scholar]
- 22.Stenerlow B, Hoglund E, Carlsson J, Blomquist E. Rejoining of DNA fragment produced by radiation of different linear energy transfer. Int J Radiat Biol 2000;76:549–57 [DOI] [PubMed] [Google Scholar]
- 23.Shimasaki T, Ihara M, Furusawa Y, Okumura Y. Induction of DNA double strand breaks in scid cells by carbon ions. Radiat Prot Dosim 2002;99:155–7 [DOI] [PubMed] [Google Scholar]
- 24.Peak MJ, Wang L, Hill CK, Peak JG. Comparison of repair of DNA double-strand breaks caused by neutron or gamma radiation in cultured human cells. Int J Radiat Biol 1991;60:891–8 [PubMed] [Google Scholar]
- 25.Cherubini F, Dalla R, Vecchia M, Favaretto S, Moschini G, Tiveron P, et al. Cell inactivation, mutation and DNA damage induced by light ions: dependence on radiation quality. In: Goodhead DT, O’Neill P, Menzel HG, editors. Microdosimetry an interdisciplinary approach. London, UK: The Royal Society of Chemistry, 1997: 191–4 [Google Scholar]
- 26.Furusawa Y, Fukutsu K, Aoki M, Itsukaichi H, Eguchi-Kasai K, Ohara H, et al. Inactivation of aerobic and hypoxic cells from three different cell lines by accelerated 3He-, 12C- and 20Ne-ion beams. Rad Res 2000;154:485–96 [DOI] [PubMed] [Google Scholar]
- 27.Todd PW. Heavy-ion irradiation of human and Chinese hamster cells in vitro. Radiat Res 1975;61:288–97 [PubMed] [Google Scholar]
- 28.Skarsgard LD, Kihlman BA, Parker L, Pujara CM, Richardson S. Survival, chromosome abnormalities, and recovery in heavy-ion and X-irradiated mammalian cells. Radiat Res Suppl 1967;7:208–21 [PubMed] [Google Scholar]
- 29.Dikomey E, Flentje M, Dahm-Daphi J. Comparison between the alkaline unwinding technique and the neutral filter elution using CHO, V79 and EAT cells. Int J Radiat Biol 1995;67:269–75 [DOI] [PubMed] [Google Scholar]
- 30.Blocher D. DNA double-strand break repair determines the RBE of a-particles. Int J Radiat Biol 1988;54:761–71 [DOI] [PubMed] [Google Scholar]
- 31.Euguchi-Kasai K, Murakami M, Itsukami H, Fukutsu K, Kanai T, Furusawa Y, et al. The role of DNA repair on cell killing by charged particles. Adv Space Res 1996;18:109–18 [DOI] [PubMed] [Google Scholar]
- 32.Dugle DL, Gillespie CJ, Chapman JD. DNA strand breaks, repair, and survival in x-irradiated mammalian cells. Proc Natl Acad Sci USA 1976;73:809–12 [DOI] [PMC free article] [PubMed] [Google Scholar]
- 33.Painter RB, Young BR, Burki HJ. Non-repairable strand breaks induced by 125I incorporated into mammalian DNA Proc Natl Acad Sci USA 1974;71:4837–8 [DOI] [PMC free article] [PubMed] [Google Scholar]
- 34.Frankenberg-Schwager M, Frankenberg D, Blocher D, Adamczyk C. The linear relationship between DNA double-strand breaks and radiation dose (30 MeV electrons) is converted into a quadratic function by cellular repair. Int J Radiat Biol 1980;37:207–12 [DOI] [PubMed] [Google Scholar]
- 35.Frankenberg-Schwager M, Frankenberg D, Blocher D, Adamczyk C. Repair of DNA double-strand breaks in irradiated yeast cells under nongrowth conditions. Rad Res 1980;82:498–510 [PubMed] [Google Scholar]
- 36.Jeggo PA. The fidelity of repair of radiation damage. Radiat Prot Dosim 2002;99:117–22 [DOI] [PubMed] [Google Scholar]
- 37.Olive PL. The role of DNA single- and double-strand breaks in cell killing by ionizing radiation. Radiat Res 1998;150:S42–S51 [PubMed] [Google Scholar]