Abstract
Ultrasound examination of the gallbladder is accepted as the primary imaging modality in the assessment of gallbladder disease, with inherent superiority in comparison to other imaging modalities. Contrast-enhanced ultrasound is established as a reliable tool in the detection and characterisation of focal liver lesions. It is less well recognised in gallbladder and biliary disease but can be a valuable complement to baseline ultrasound examination. Contrast-enhanced ultrasound provides the advantages of real-time, repeatable, multiplanar imaging without compromising patient safety or exposing patients to radiation. It can provide specific information as pathology often becomes more conspicuous following the administration of contrast, allowing detailed assessment of benign and malignant conditions arising in the gallbladder and biliary tree. This review illustrates the application of contrast-enhanced ultrasound in the evaluation of a variety of gallbladder and biliary duct diseases. The examination allows clearer delineation of the disease process and more confident diagnosis.
The introduction of microbubble contrast agents and the development of contrast-specific imaging techniques have advanced the capability of ultrasound (US) imaging [1, 2]. Studies have shown that the application of contrast-enhanced ultrasound (CEUS) substantially improves the detection and the characterisation of focal liver lesions when compared with conventional US [3, 4]. In addition, studies have also demonstrated significant concordance between findings at CEUS and those of computed tomography (CT) and magnetic resonance (MR) imaging [5].
CEUS has the advantages of providing real-time, reproducible, multiplanar imaging without compromise to patient safety [6] or exposure to radiation. More importantly, microbubble contrast agents give an accurate assessment of blood flow within a lesion and are the only completely intravascular contrast agent used in radiological imaging. Guidelines for the characterisation of focal liver lesions using CEUS have been published, aiding investigators to evaluate these focal liver lesions [7].
The current manuscript focuses on the application of CEUS in the evaluation of patients with biliary disease processes, emphasising its advantages over conventional US. We discuss technical considerations, describe indications for CEUS and illustrate the features and limitations of CEUS in the evaluation of bile duct and gallbladder pathology.
Microbubble contrast agents
Microbubble contrast agents are specific for the blood pool; <10 μm microbubbles are not filtered by the lungs, are too large to enter the interstitial fluid and circulate in the vascular compartment after an intravenous injection. They are stable in the circulation for sufficient time for imaging, typically up to 6–8 min. When microbubbles pass through an acoustic field, they respond to the alternating compression and rarefaction cycles of the US by expanding and contracting markedly, resulting in oscillation. The US frequency that generates the maximum expansion of the microbubble, and thus the greatest scattering of the incident waves, is called the resonance frequency. This frequency is contrast-agent specific and is determined primarily by microbubble diameter. It is opportune that the range of frequencies used for abdominal US imaging (3–5 MHz) corresponds to the resonant frequency of 3–5 μm microbubbles.
The response of microbubbles to insonation depends on the intensity of the incident waves, measured by the mechanical index (MI). At low MI below an acoustic power threshold, microbubbles exhibit linear oscillation and produce a US signal with the same frequency as that of the sound that excited them. As the US intensity increases, the expansion phase of the microbubbles is greater than the compression phase and these non-linear vibrations generate harmonic frequencies. When the acoustic pressure reaches a certain threshold, there is disruption of the microbubble shell and free gas is released; this burst of echogenic gas produces a contrast-specific signal called simulated acoustic emission. This release of free gas generates a wide-band harmonic signal that rapidly disperses as the gas diffuses away.
Contrast-enhanced imaging techniques almost exclusively use low MI to generate an image. Low-MI pulse-inversion imaging suppresses the normal tissue echoes; thus, the baseline pre-contrast image appears "dark", and consequently all subsequent post-contrast administration echogenicity is attributed to the presence of the microbubbles. The use of low MI minimises microbubble destruction and allows real-time observation for the duration of the presence of microbubbles in the blood pool. When a region of interest has been observed under low-MI imaging, a brief moment of high-MI imaging destroys the microbubbles resident in that region of view; this releases free gas, thereby producing a brief, intense increase in signal intensity followed by rapid loss of contrast enhancement. Upon returning to low-MI mode, the region of interest is refilled with microbubbles. This provides a second opportunity to observe enhancement patterns in the region of interest.
Like iodinated contrast agents, microbubbles allow different dynamic phases of contrast enhancement to be identified in the liver parenchyma: the arterial phase begins 10–20 s after injection and lasts 25–35 s; the portal phase begins at 30–35 s and lasts up to 100–110 s from the beginning of microbubble injection; and the late phase begins after the portal phase and lasts up to 5–8 min. Because the biliary system has a single arterial supply from the hepatic artery that forms branches, the patterns of enhancement in the gallbladder and bile ducts differ. Enhancement is assessed by comparing the echogenicity of a lesion with the background echogenicity of liver parenchyma. Positive enhancement is recognised as echogenicity equal to or greater than that of the liver and negative enhancement as echogenicity less than that of the liver.
The images in this article were obtained using SonoVue™ (Bracco SpA, Milan, Italy) as the microbubble contrast agent and a Siemens Acuson Sequoia (Siemens, Mountain View, CA) US machine using a low-MI technique termed Cadence™ contrast pulse sequencing (CPS™). SonoVue™ microbubbles are composed of a sulphur hexafluoride gas with a phospholipid shell and have diameters in the range 1–10 μm (median 2 μm). The contrast agent is metabolised by the liver and the sulphur hexafluoride gas is exhaled via the lungs. SonoVue™ is usually administered as a bolus intravenous injection of 2.4 ml followed by a 10 ml saline flush.
The gallbladder
US examination of the gallbladder is a common investigation that has excellent potential in assessing inflammatory and calculus disease. The high-resolution capabilities of US allow clear depiction of gallstone and gallbladder polyps that are often not seen on CT or MR imaging, albeit with the proviso that US has inherent limitations in the difficult patient. With malignant gallbladder disease, CT is often more informative, but CEUS may play a role by providing further information not evident on other imaging modalities.
Gallbladder sludge
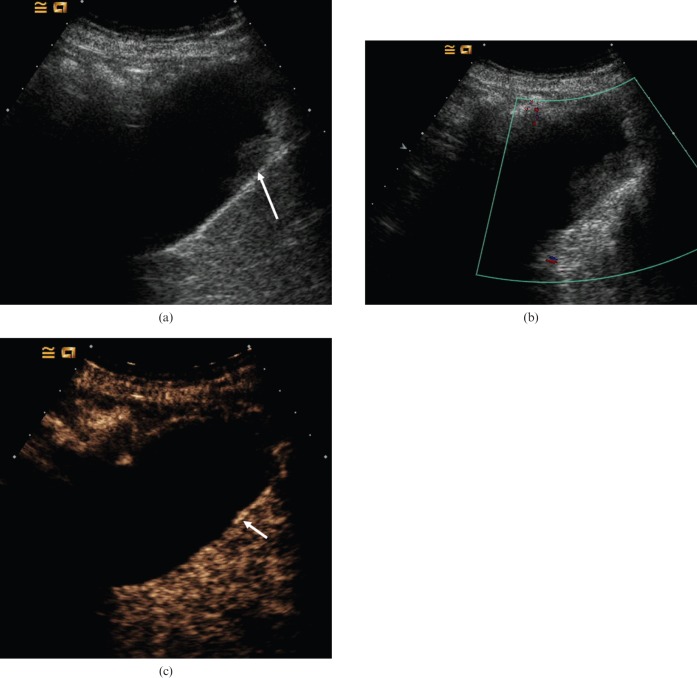
Biliary sludge was first described with the advent of US in the 1970s. It is defined as a mixture of particulate matter and bile that occurs when the solutes in bile precipitate [8]. Microbubble contrast agents remain entirely intravascular and hence any abnormality in a vascular supply will demonstrate some enhancement following contrast administration. This property is of value when attempting to distinguish true lesions of the gallbladder wall from adherent debris or sludge, i.e. debris or pseudotumour within the gallbladder will not be enhanced (Figure 1).
Figure 1.
Biliary sludge. (a) Baseline US image depicts echogenic material within the gallbladder (arrow). This does not exhibit movement on change in patient posture. (b) Colour Doppler US demonstrates no noticeable vascularity. (c) Late arterial-phase CEUS obtained 30 s after administration of microbubble contrast demonstrates that there is no enhancement of the echogenic material, i.e. the contents of the gallbladder remain dark, indicating that it is non-vascular and simply represents adherent biliary sludge. The gallbladder wall enhances (arrow) and is seen separately from the lesion, confirming no mural abnormality.
Acute cholecystitis
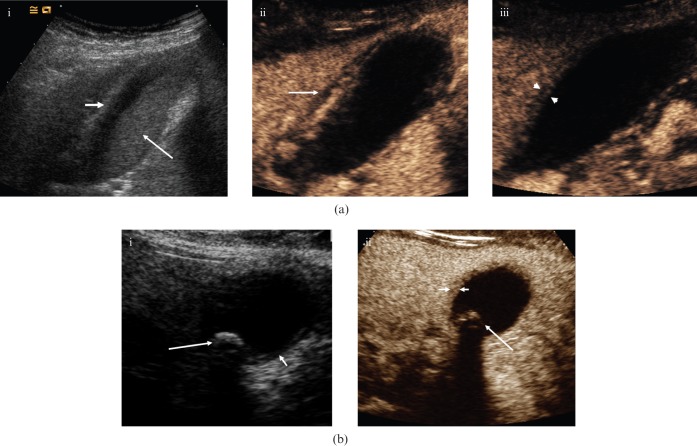
Acute cholecystitis is inflammation of the gallbladder typically caused by a calculus obstructing the cystic duct. The acalculous variety occurs in about 5–10% of patients who have acute cholecystitis [9]. Predisposing factors to acalculous cholecystitis include prolonged fasting, chronic infection, recent surgery, ischaemia, trauma or burns; it may also be caused by obstruction of the cystic duct by extrinsic inflammation, lymphadenopathy or metastases. The imaging features of acalculous cholecystitis are those of acute cholecystitis except for the absence of calculi and the frequent presence of gallbladder sludge. The symptoms associated with acute cholecystitis include right upper quadrant pain and tenderness, often with a positive sonographic Murphy sign (maximum tenderness during compression with the transducer placed over the gallbladder), and fever. The use of CEUS will clearly depict the thickened gallbladder wall against the liver parenchyma, particularly in the late phase when "wash-out" has occurred. During the arterial phase, enhancement of the cystic artery and gallbladder wall will be seen earlier than enhancement of the adjacent liver parenchyma (Figure 2).
Figure 2.
Acute cholecystitis. (a) (i) Baseline longitudinal US of a 37-year-old female depicts a moderately distended gallbladder, hazy delineation of the thickened (>3 mm) gallbladder wall (small arrow) and echogenic debris within the gallbladder (large arrow). (ii) CEUS 30 s after administration of microbubble contrast depicts an initially hypervascular gallbladder wall. There is improved delineation of pericholecystic fluid (arrow). Note the lack of enhancement of the echogenic sludge within the gallbladder. (iii) CEUS at 86 s. In the late phase, the gallbladder wall shows less enhancement and is hypovascular (between arrowheads) relative to the adjacent liver parenchyma. This enables more accurate measurement of wall thickness. (b) (i) Axial baseline US image of a 30-year-old female with acute cholecystitis; thickening of the gallbladder wall (short arrow) and gallstones are present (long arrow). (ii) CEUS at 80 s shows the differential enhancement of the gallbladder wall (short arrows), allowing accurate assessment of mural thickness. Note the lack of enhancement of biliary sludge and the clear demarcation of the solitary calculus (long arrow).
Adenomyomatosis
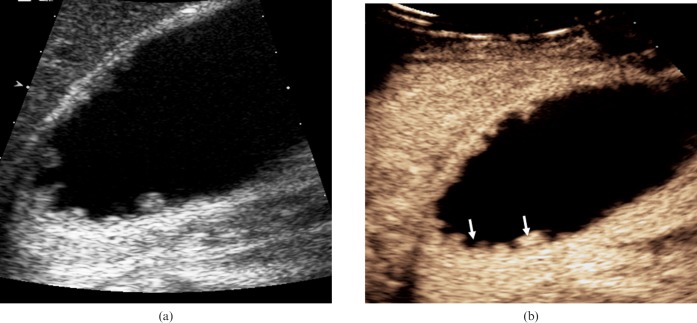
Adenomyomatosis of the gallbladder occurs in up to 5% of cholecystectomy specimens [10]. Adenomyomatosis has no malignant potential and may involve the gallbladder in a focal, segmental or diffuse form. The condition is usually asymptomatic and is often diagnosed as an incidental finding on imaging. Adenomyomatosis is characterised pathologically by proliferation of the surface epithelium and hypertrophy of the muscularis propria of the gallbladder wall, with invagination of the mucosa into the thickened muscularis forming Rokitansky–Aschoff sinuses. Adenomatous hyperplasia is seen on baseline US as focal or diffuse thickening of the gallbladder wall. As this may be a non-specific finding, the radiological diagnosis is largely dependent on the visualisation of Rokitansky–Aschoff sinuses. The US appearance of an intramural diverticulum depends on its composition; it is anechoic when only bile is present and echogenic if it contains cholesterol or stones. The characteristic feature is the V-shaped "comet tail" reverberation artefact seen emanating from the small echogenic foci in the gallbladder wall [11]. The enhancing gallbladder wall is better visualised following microbubble contrast administration, which aids the depiction of the non-enhancing intramural diverteculum and thus facilitates correct diagnosis (Figure 3).
Figure 3.
Adenomyomatosis. (a) Longitudinal baseline US shows segmental mural thickening in a 37-year-old asymptomatic male patient in keeping with a diagnosis of adenomyomatosis. (b) CEUS 23 s after administration of microbubble contrast demonstrates enhancement of the thickened gallbladder wall with anechoic diverticula (arrows).
Polypoid lesions of the gallbladder
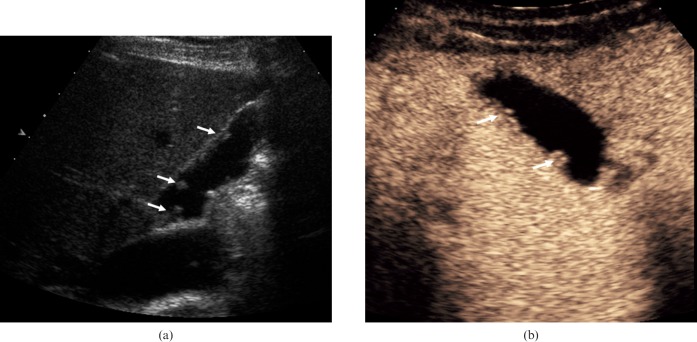
Gallbladder polyps are a frequent incidental finding at US with prevalence rates reported as ranging from 4% to 7% [12, 13]. US has a high sensitivity for the depiction of polypoid lesions with a sensitivity quoted at over 90% [14], higher than that of CT; the majority are cholesterol polyps [15]. The current rationale for following up gallbladder polyps is based on the polyp to carcinoma sequence, comparable to the sequence for colonic malignancy, in which an adenomatous polyp progresses to become a gallbladder malignancy; this is not a universally accepted view [16]. Distinguishing a potentially pre-malignant adenoma from a benign cholesterol polyp is not possible on the basis of US features alone. Size less than 10 mm, multiplicity and increased echogenicity are suggestive of benign cholesterol polyps. Increasing size on sequential US examinations, focal thickening of the gallbladder wall or nodularity adjacent to a polypoid mass should raise concern regarding malignancy. CEUS may aid the detection and assessment of lesions. Real-time enhancement of individual polyps facilitates their detection and distinguishes them from mural folds, 1n;enhancing gallbladder contents or sludge. Hence, improved delineation of polyp morphology, size and number is possible with the use of CEUS, and these characteristics are useful in assessing the requirement for possible surgical resection (Figure 4).
Figure 4.
Gallbladder polyps. (a) Longitudinal baseline US in a 58-year-old male depicts several echogenic lesions arising from the gallbladder wall (arrows). (b) CEUS image at 45 s after administration of microbubble contrast demonstrates vascularity of the lesions (arrows) and a normal adjacent gallbladder wall.
Gallbladder carcinoma
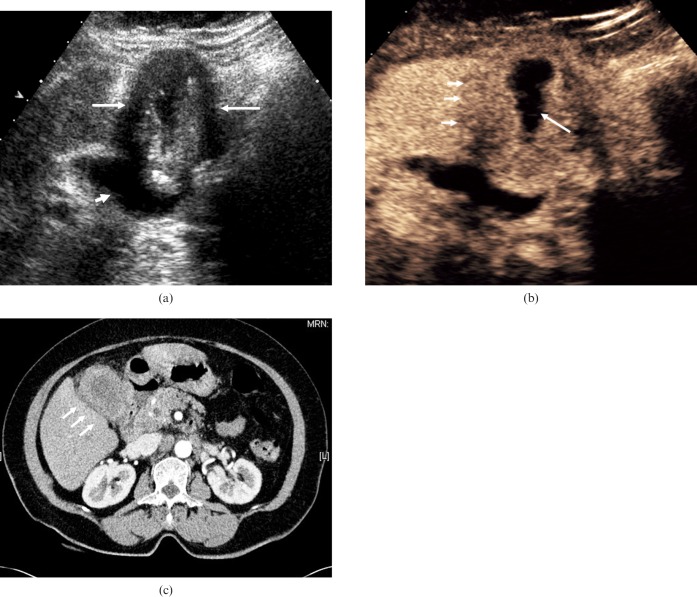
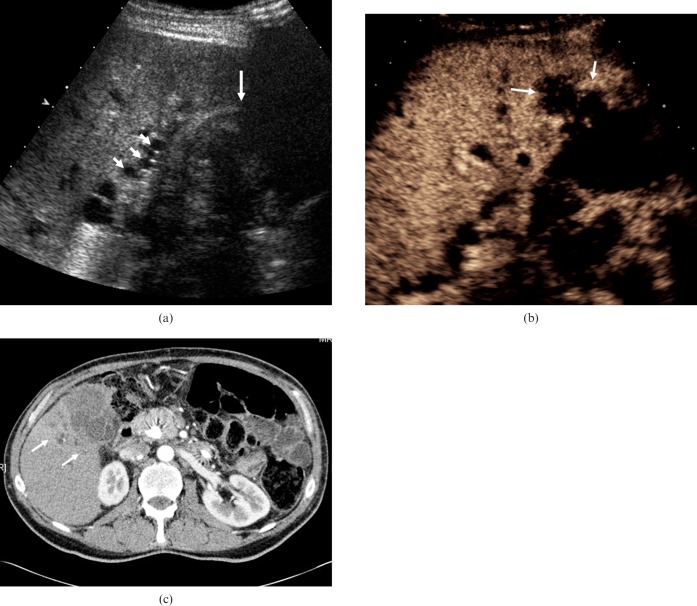
Carcinoma of the gallbladder is a malignant epithelial neoplasm arising from the mucosa. It is the fifth most common malignancy of the gastrointestinal tract and has an association with gall stones. Gallbladder carcinoma is found incidentally in up to 3% of cholecystectomy specimens; of these, 90% are adenocarcinoma and the remaining 10% are squamous cell or anaplastic [9]. Gallbladder carcinoma has various imaging appearances, ranging from a polypoid intraluminal lesion to a soft-tissue mass infiltrating the gallbladder fossa and surrounding structures. Diffuse mural thickening can mimic chronic cholecystitis, but findings that are associated with gallbladder carcinoma, such as the invasion of adjacent structures, secondary bile duct dilatation and liver metastases, may support in this differentiation (Figures 5 and 6).
Figure 5.
Adenocarcinoma of the gallbladder. (a) Baseline longitudinal US in a 68-year-old woman presenting with pain, depicting gross gallbladder fundus mural thickening contiguous with an intraluminal soft-tissue mass (long arrows). The neck of the gallbladder is normal (short arrow). This may be a florid example of cholecystitis with biliary sludge, but adenocarcinoma of the gallbladder is a possibility. (b) CEUS at 28 s after administration of microbubble contrast demonstrates vascularity of the thickened gallbladder wall with a smooth interface with the liver surface (short arrows). There is a gallbladder lumen (long arrow). (c) Axial contrast-enhanced CT at the level of the gallbladder fossa shows circumferential gallbladder mural thickening without hepatic invasion (short arrows); histology confirmed adenocarcinoma of the gallbladder without infiltration of the liver.
Figure 6.
Adenocarcinoma of the gallbladder. (a) Baseline US in a 57-year-old man presenting with obstructive jaundice depicts a soft-tissue mass in an ill-defined gallbladder (long arrow) and evidence of bile duct dilatation (short arrows). (b) CEUS image obtained 90 s after administration of microbubble contrast demonstrates a hypovascular mass centred on the gallbladder fossa, with invasion into the hepatic parenchyma (arrows). The late-phase hypovascularity suggests malignancy and differs from the persistent enhancement in cholecystitis. (c) Axial contrast-enhanced CT at the level of the gallbladder fossa demonstrates a mass with invasion into the adjacent liver parenchyma (arrows), appearances that correlate well with those seen at CEUS.
Microbubble contrast administration may assist in the interpretation of these findings; in the case of polypoid lesions, improved visualisation and the pattern of early-phase hyperenhancement relative to the hepatic parenchyma and adjacent gallbladder wall may reveal suspicious features. Where the morphology of the tumour is more mass-like or there is diffuse mural thickening, hyperenhancement followed by rapid washout of contrast agent within 35 s of contrast agent administration is highly suggestive of gallbladder malignancy [17]. Disruption of the gallbladder wall integrity, a feature absent in benign gallbladder diseases, has been demonstrated in up to 85% of gallbladder carcinomas [17]. Improved mural visualisation following contrast administration and the malignant feature of late-phase hypovascularity relative to the hepatic parenchyma may provide sharp demarcation of tumour outline. Features such as the extent of direct hepatic invasion and liver metastases may be made more apparent by microbubble contrast US.
Biliary tree
Biliary duct dilatation
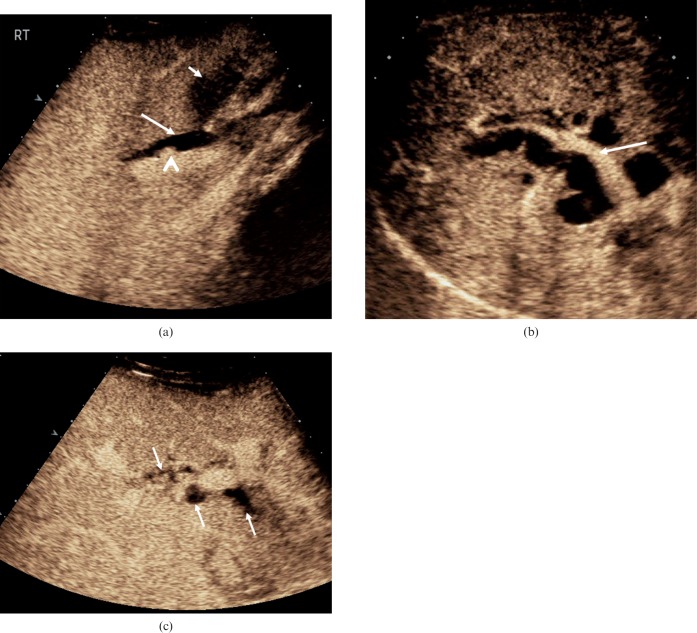
Contrast-enhanced US has potential for the assessment of biliary dilatation and biliary obstruction. On post-contrast images, both intra- and extra-hepatic duct dilatation becomes more conspicuous. Dilated bile ducts can be followed along their course within the liver parenchyma, and this improves the visualisation of filling defects such as intrahepatic gall stones or soft-tissue masses (Figure 7).
Figure 7.
Biliary duct dilatation. (a) The common hepatic duct is dilated (long arrow) in this 28-year-old female following recent passage of a biliary calculus. Enhancement is seen in the hepatic artery adjacent to the duct (arrowhead). In addition, inflammatory changes in the gallbladder wall are evident (short arrow). (b) Intrahepatic duct dilatation secondary to carcinoma of the head of the pancreas in a 78-year-old male. The portal vein demonstrates enhancement (arrow) with the surrounding dilated bile ducts demonstrating no enhancement. (c) Focal biliary dilatation (arrows) in the graft liver following liver transplantation in a 52-year-old male with an occluded hepatic artery. Ischaemic changes in the bile ducts are probably responsible for this appearance.
Biliary duct abscesses
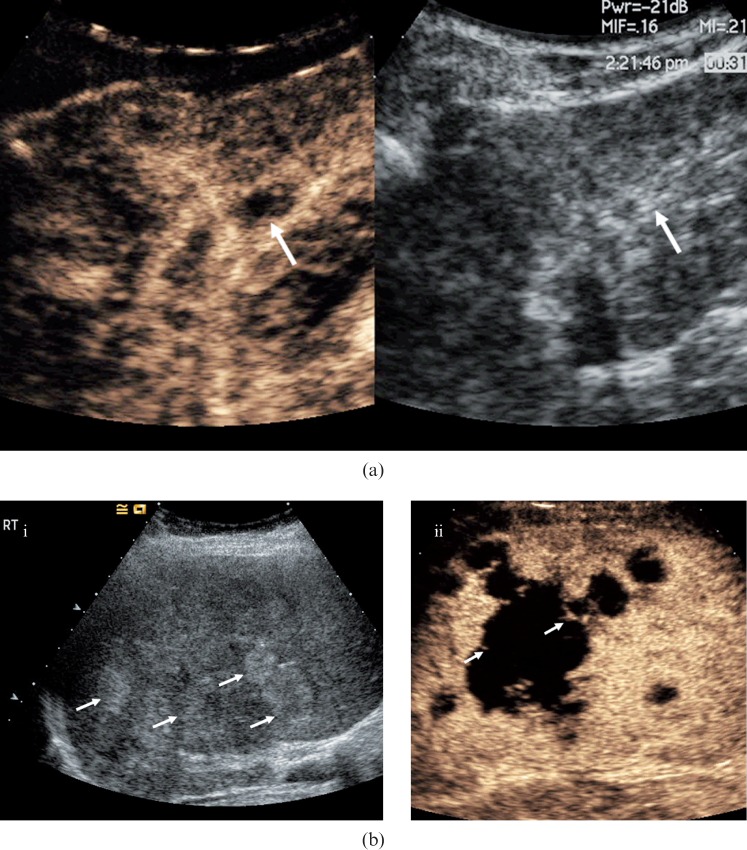
Biliary duct abscesses can occur following liver transplantation, if hepatic artery thrombosis leads to bile duct ischaemia and infection, or as a late manifestation of inadequately treated ascending cholangitis [18]. Vessels and enhancement are usually completely absent from the inner liquid portion of abscesses as intralesional vessels are destroyed or displaced by the colliquative process (Figure 8). As the abscess evolves, fine internal septa that are visible on CEUS may form.
Figure 8.
Biliary inflammatory disease. (a) Infective cholangitis in a 35-year-old male patient. On the dual-mode image on the right, the greyscale appearance is of increased echogenicity around the bile ducts. More evident areas of bile duct dilatation, probably small communicating biliary abscesses, are visualised following the administration of microbubble contrast (arrow). (b) (i) On the baseline image from this 72-year-old female patient, multiple highly reflective focal lesions are identified in the right lobe of the liver (arrows). (ii) CEUS at 27 s after microbubble contrast administration demonstrates low-reflective focal lesions with septations (arrows), inkeeping with the formation of biliary hepatic abscesses.
Biliary hamartomas
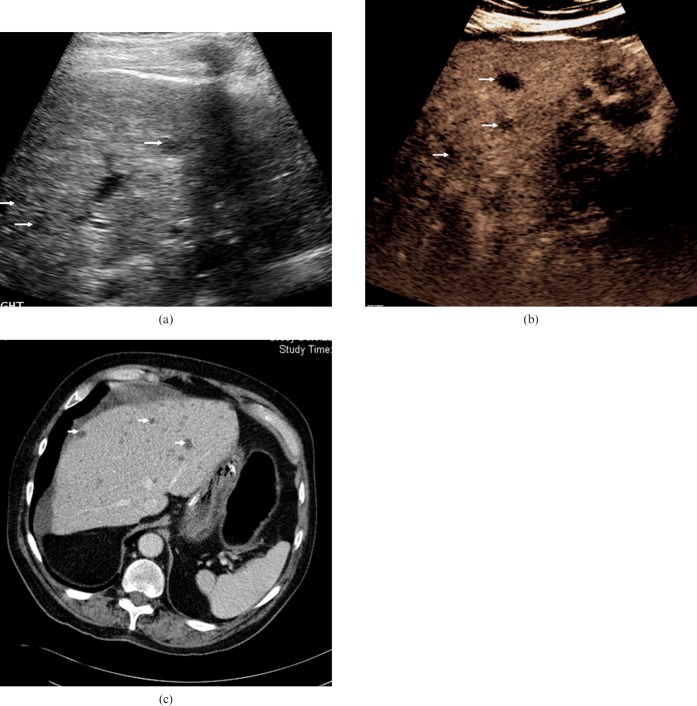
Multiple biliary hamartomas (von Meyenberg complexes) are an uncommon benign biliary neoplasm often detected incidentally on imaging [19]. Typically, multiple biliary hamartomas can mimic metastatic disease. The lesions fail to show microbubble contrast enhancement through all the vascular phases because biliary hamartomas lack normal sinusoidal architecture. Unfortunately, the enhancement pattern does not allow biliary hamartomas to be differentiated precisely from malignant deposits, but CEUS provides a useful adjunct in the assessment of patients with multiple focal liver lesions and does allow improved visualisation. MR imaging is considered the optimum modality for demonstrating features of multiple biliary hamartomas [20], and correlative MR imaging may obviate the need for biopsy in asymptomatic, otherwise healthy patients. Ultimately, given the variable imaging characteristics of multiple biliary hamartomas, diagnosis might require histopathological analysis, particularly if there is a known primary malignancy (Figure 9).
Figure 9.
Biliary hamartomas. (a) Baseline US examination in an 81-year-old male presenting with liver lesions identified by CT prior to a hemi-colectomy for a bowel malignancy. A number of low-reflective well-circumscribed lesions are visible (arrows). (b) The lesions become more conspicuous (arrows) in the late-phase following microbubble contrast administration (after 90 s). The lesions are indistinguishable from metastatic liver disease but biliary hamartomas were confirmed by biopsy and histology. (c) Contrast-enhanced CT at the level of the coeliac axis confirms multiple low-attenuation lesions throughout the right lobe of the liver (arrows).
Biliary cystadenoma
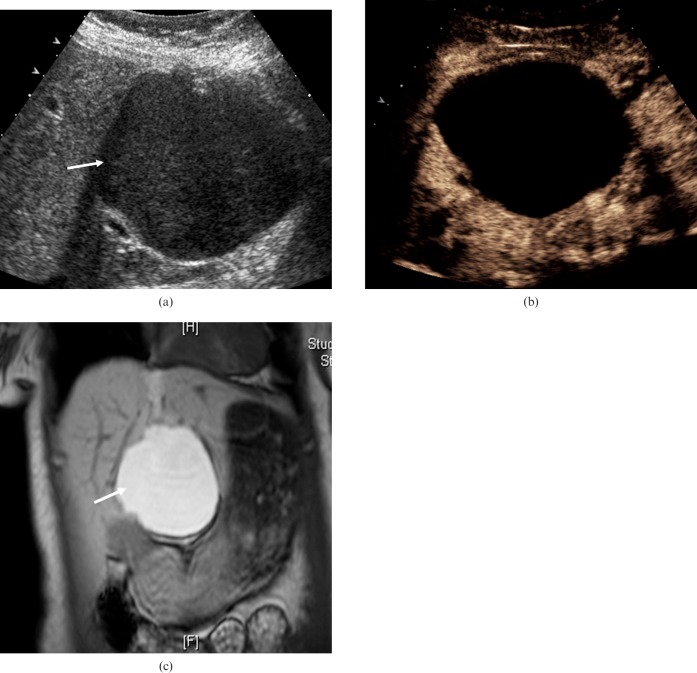
Biliary cystadenoma is a rare, benign (pre-malignant), uni- or multilocular cystic tumour that may occur in the liver, extra-hepatic biliary tree or gallbladder. Typically a solitary tumour, biliary cystadenomas occur predominantly in middle-aged women and may recur after excision with the potential to develop into a cystadenocarcinoma. The typical US appearance is a well-defined, multiloculated, avascular anechoic mass. The cyst fluid may contain low-level echoes from blood products or proteinaceous fluid [21] (Figure 10). Highly echogenic septations, enhancing tumour nodules and papillary projections may be visible on CEUS.
Figure 10.
Biliary cystadenoma. (a) Transverse US image of the liver of a 64-year-old female patient with a biliary cystadenoma shows a well-defined structure (arrow) demonstrating posterior acoustic enhancement and containing complex internal echoes. (b) CEUS at 30 s after the administration of microbubble contrast demonstrates enhancement of the rim component and a lack of enhancement centrally within the lesion, confirming its cystic nature. (c) T1 coronal MR imaging sequence depicts a high-signal lesion within segment 4 of the liver (arrow) indicative of a cyst with potential mucinous or colloid matrix.
Cholangiocarcinoma
Cholangiocarcinoma is an adenocarcinoma that arises from intra- or extra-hepatic bile duct epithelium. Cholangiocarcinoma is the most common tumour of the bile ducts and the second most prevalent liver cancer after hepatocellular carcinoma. Recognised risk factors include biliary lithiasis, primary sclerosing cholangitis, inflammatory bowel disease, clonorchiasis, choledochal cyst and Caroli's disease. Cholangiocarcinoma is classified as either intrahepatic or extra-hepatic, and intrahepatic cholangiocarcinoma is further classified as either hilar or peripheral. Peripheral cholangiocarcinoma classically manifests as a large, well-defined hepatic mass with lobulated margins and peripheral rim enhancement at both contrast-enhanced CT and dynamic MR imaging [22]. Hilar cholangiocarcinoma may be infiltrative, exophytic or polypoid. Extra-hepatic cholangiocarcinomas are infiltrative, causing a focal stricture of the bile duct.
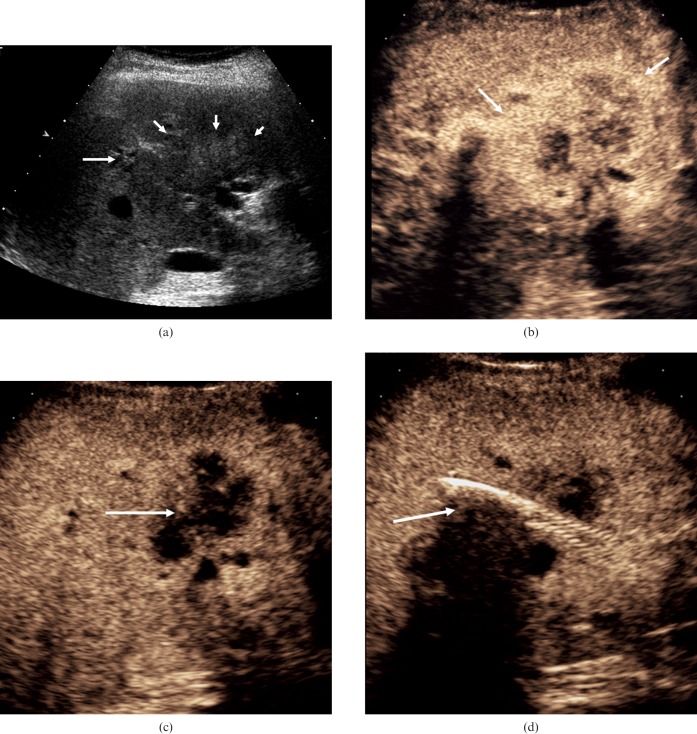
On CEUS, during the arterial phase there is irregular rim-like hyperenhancement in the periphery of the tumour, which lasts until the portal phase in the majority of cholangiocarcinomas [23, 24]. Diffuse heterogeneous hyperenhancement is the second most common appearance [24]. Absence of contrast enhancement is observed in the portal-late phase with intrahepatic cholangiocarcinoma displaying a persistent heterogeneous hypoechoic appearance relative to that of the enhanced liver parenchyma (Figure 11) [25]. Hilar cholangiocarcinoma has a tendency to grow axially along and into the ducts and to invade the liver parenchyma. On conventional US, these invasive foci may not be appreciated as they are isoechoic to the hepatic parenchyma. CEUS may depict these foci as grape-like clusters that follow the biliary tracts into the liver [25]. Portal vein encasement and invasion may also be established. These features may aid in determining tumour resectability. CEUS has good spatial resolution and may be used to stage the hilar infiltrative type tumour locally. Features such as ductal and vascular invasion are often more apparent following contrast administration. Hepatic metastatic nodules often are more apparent when contrast is used.
Figure 11.
Cholangiocarcinoma. (a) Baseline US illustrates an ill-defined echogenic heterogeneous mass at the porta hepatis (short arrows) with proximal dilatation of the intrahepatic bile ducts (long arrow). (b) CEUS at 20 s after microbubble contrast administration demonstrates peripheral irregular rim-like enhancement (arrows). (c) CEUS at 87 s after microbubble contrast administration demonstrates absence of enhancement within the tumour (arrow). (d) A metallic stent has been placed in the common bile duct for palliative reasons but is not functioning adequately. The CEUS image at 110 s demonstrates evidence of tumour invasion into the biliary stent (arrow).
Limitations and pitfalls
Contrast-enhanced US may be utilised to further evaluate B-mode US findings. With CEUS, as with other modalities, however, the observable enhancement patterns often reflect the pathological process rather than a specific disease entity. Hence, a conclusive diagnosis still requires histo-pathological confirmation. Contrast-enhanced US has limited depth penetration (as a consequence of using low-MI imaging) and consequently specificity and sensitivity are markedly reduced in an attenuating liver (steatosis) and for deep-sited lesions, particularly in those patients with a high body mass index. Limitations that exist for normal US examinations also exist for CEUS. Intercostal scanning and placing the patient in the left lateral decubitus position brings the liver and biliary system closer to the transducer and can help to overcome these limitations. Technically suboptimal studies or lesions with atypical enhancement still require further investigation.
Summary
Contrast-enhanced US is established as a reliable tool in the detection and characterisation of focal liver lesions. Contrast-enhanced US is less well established but highly useful in the evaluation of gallbladder biliary duct disease, and ongoing work is set to better define its role [26, 27]. Contrast-enhanced US is non-invasive, has no radiation exposure and can be used in renal impairment. Furthermore, CEUS is particularly useful in those patients for whom the use of contrast agents in CT or MR imaging is contraindicated. The recognition of specific contrast enhancement characteristics is fundamental to the use of CEUS.
References
- 1.Burns PN, Hope Simpson D, Averkiou MA. Nonlinear imaging. Ultrasound Med Biol 2000;26:S19–S22 [DOI] [PubMed] [Google Scholar]
- 2.Burns PN. Optimising ultrasound imaging instruments for contrast agents. In: Nanda NC, Schlief R, editors. Advances in echo imaging using contrast enhancement. Boston, USA: Kluwer Academic Publishers, 1997: 139–70 [Google Scholar]
- 3.Larsen LPS, Rosenkilde M, Christensen H, Bang N, Bolvig L, Christiansen T, et al. The value of contrast enhanced ultrasonography in detection of liver metastases from colorectal cancer: a prospective double-blinded study. Eur J Radiol 2007;62:302–7 [DOI] [PubMed] [Google Scholar]
- 4.Yarmenitis SD, Karantanas A, Bakantaki A, Papantoniou Y, Gourtsoyiannia N. Detection of colorectal cancer hepatic metastases with contrast-enhanced ultrasound: comparison with conventional B-mode ultrasound. Dig Dis 2007;25:86–93 [DOI] [PubMed] [Google Scholar]
- 5.Burns PN, Wilson SR. Focal liver masses: enhancement patterns on contrast-enhanced images — concordance of US scans with CT scans and MR images. Radiology 2006;242:162–74 [DOI] [PubMed] [Google Scholar]
- 6.Piscaglia F, Bolondi L. The safety of SonoVue in abdominal applications: retrospective analysis of 23188 investigations. Ultrasound Med Biol 2006;32:1369–75 [DOI] [PubMed] [Google Scholar]
- 7.Claudon M, Cosgrove D, Albrecht T, Bolondi L, Bosio M, Calliada F, et al. Guidelines and good clinical practice recommendations for contrast enhanced ultrasound (CEUS) — update 2008. Ultraschall Med 2008;1:28–44 [DOI] [PubMed] [Google Scholar]
- 8.Ko CW, Sekijima JH, Lee SP. Biliary sludge. Ann Intern Med 1999;130:301–11 [DOI] [PubMed] [Google Scholar]
- 9.Gore RM, Yaghmai V, Newmark GM, Berlin JW, Miller FH. Imaging benign and malignant disease of the gallbladder. Radiol Clin North Am 2002;40:1307–23 [DOI] [PubMed] [Google Scholar]
- 10.Williams I, Slavin G, Simpson P, de Lacey G. Diverticular disease (adenomyomatosis) of the gallbladder: a radiological pathological survey. Br J Radiol 1986;59:29–34 [DOI] [PubMed] [Google Scholar]
- 11.Raghavendra BN, Subramanyam BR, Balthazar EJ, Horii SC, Megibow AJ, Hilton S. Sonography of adenomyomatosis of the gallbladder: radiologic–pathologic correlation. Radiology 1983;146:747–52 [DOI] [PubMed] [Google Scholar]
- 12.Jorgensen T, Jensen KH. Polyps in the gallbladder. A prevalence study. Scand J Gastroenterol 1990;25:281–6 [PubMed] [Google Scholar]
- 13.Collett JA, Allan RB, Chisholm RJ, Wilson IR, Burt MJ, Chapman BA. Gallbladder polyps: prospective study. J Ultrasound Med 1998;17:207–11 [DOI] [PubMed] [Google Scholar]
- 14.Yang HL, Sun YG, Wang Z. Polypoid lesions of the gallbladder: diagnosis and indications for surgery. Br J Surg 1992;79:227–9 [DOI] [PubMed] [Google Scholar]
- 15.Terzi C, Sokmen S, Seckin S, Albayrak L, Ugurlu M. Polypoid lesions of the gallbladder: Report of 100 cases with special reference to operative indications. Surgery 2000;127:622–7 [DOI] [PubMed] [Google Scholar]
- 16.Morson B. President's address. The polyp-cancer sequence in the large bowel. Proc R Soc Med 1974;67:451–7 [PMC free article] [PubMed] [Google Scholar]
- 17.Xie XH, Xu HX, Xie XY, Lu MD, Kuang M, Xu ZF, et al. Differential diagnosis between benign and malignant gallbladder diseases with real-time contrast-enhanced ultrasound. Eur Radiol 2010;20:239–48 [DOI] [PubMed] [Google Scholar]
- 18.Rockey DC. Hepatobiliary infections. Curr Opin Gastroenterol 2001;17:257–61 [DOI] [PubMed] [Google Scholar]
- 19.Berry JD, Boxer ME, Rashid HI, Sidhu PS. Microbubble contrast enhanced ultrasound characteristics of multiple biliary hamartomas (von Meyenberg complexes). Ultrasound 2004;12:95–7 [Google Scholar]
- 20.Tohme-Noun C, Cazals D, Noun R, Menassa L, Valla D, Vilgrain V. Multiple biliary hamartomas: magnetic resonance features with histopathologic correlation. Eur Radiol 2008;18:493–9 [DOI] [PubMed] [Google Scholar]
- 21.Levy AD, Murakata LA, Abbott RM, Rohrmann CA., Jr From the archives of the AFIP: benign tumors and tumor-like lesions of the gallbladder and extrahepatic bile ducts: radiologic–pathologic correlation. Radiographics 2002;22:387–413 [DOI] [PubMed] [Google Scholar]
- 22.Han JK, Choi BI, Kim AY, An SK, Lee JW, Kim TK, et al. Cholangiocarcinoma: pictorial essay of CT and cholangiographic findings. Radiographics 2002;22:173–87 [DOI] [PubMed] [Google Scholar]
- 23.Tanaka S, Ioka T, Oshikawa O, Hamada Y, Yoshioka F. Dynamic sonography of hepatic tumors. AJR Am J Roentgenol 2001;177:799–805 [DOI] [PubMed] [Google Scholar]
- 24.Chen LD, Xu HX, Xie XY, Lu MD, Xu ZF, Liu GJ, et al. Enhancement patterns of intrahepatic cholangiocarcinoma: comparison between contrast-enhanced ultrasound and contrast-enhanced CT. Br J Radiol 2008;81:881–9 [DOI] [PubMed] [Google Scholar]
- 25.Khalili K, Metser U, Wilson SR. Hilar biliary obstruction: preliminary results with Levovist-enhanced sonography. AJR Am J Roentgenol 2003;180:687–93 [DOI] [PubMed] [Google Scholar]
- 26.Onofrio M, Vecchiato F, Cantisani V, Barbi E, Passamonti M, Ricci P, et al. Intrahepatic peripheral cholangiocarcinoma (IPCC): comparison between perfusion ultrasound and CT imaging. Radiol Med 2008;113:76–86 [DOI] [PubMed] [Google Scholar]
- 27.Aimoto T, Uchida E, Kawahigashi Y, Nakamura Y, Matsushita A, Katsuno A, et al. Improvement of intraoperative frozen section diagnosis in patients with biliary strictures by Levovist injection into the bile duct on color Doppler ultrasonography. World J Surg 2008;32:88–92 [DOI] [PubMed] [Google Scholar]


