Abstract
Accurate determination of tumour size in lung adenocarcinoma with bronchoalveolar features (BAC) is important for the determination of TNM (tumour, nodes, metastasis) scores used in staging, prognosis and therapy response assessment. However, tumour sizes derived using lung window (LW) CT or soft-tissue/mediastinal window (MW) CT often give different results. This study examines which measurement correlates best with actual tumour size and which best identifies advanced disease. This retrospective study included 43 BAC patients who underwent surgical resection with mediastinal lymphadenectomy <4 weeks post CT scan. The largest unidimensional tumour diameter on each CT window was compared with actual histopathological tumour size (HP). LW, MW and HP size measurements and a recently described CT parameter – the modified tumour shadow disappearance rate (mTDR) = (1 – [MW/LW]) – were then used to determine which parameter best discriminated between the presence or absence of advanced disease. There was no difference between HP and LW sizes, but MW significantly underestimated HP size (p<0.0001). Unlike MW (p = 0.01) and mTDR (p = 0.001), neither HP (p = 0.14) nor LW (p = 0.10) distinguished between patients with or without advanced disease. On receiver operating characteristic (ROC) analysis at a cut-off of ≤0.13, the sensitivity and specificity of mTDR for detecting advanced disease were 69% and 89%, respectively. In patients with tumours ≤3 cm, only mTDR remained a significant predictor of advanced disease (p = 0.017), with best cut-off at ≤0.20, giving a sensitivity and specificity of 71% and 94%, respectively. MW better predicts advanced disease than LW and might also need to be recorded for RECIST (response evaluation criteria in solid tumours) assessment for T staging of BAC; however, mTDR appears to be an even better predictor and should also be used.
The commonest histological subgroup of lung cancers is adenocarcinoma [1], being found in 40% of cases. Current emphasis is on accurately subdividing this cancer into separate histological subtypes [2–4] to determine patient prognosis and therapy options. These histological subtypes include [2, 4] bronchoalveolar carcinoma (BAC; representing a more benign spectrum), adenocarcinoma (the more malignant spectrum) or the most common group of mixed subtypes (40%), which contains a mixture of both [4, 5].
CT, alone or in combination with positron emission tomography (PET), has a crucial role in patient work-up; this technology can provide accurate tumour T stage using unidimensional response evaluation criteria in solid tumours (RECIST) [6] or the older bidimensional (World Health Organization (WHO) guidelines) criteria [7, 8]. For serial measurements, neither set of criteria specifies which CT window (lung or soft tissue/mediastinal) should be used as long as the same setting is used in all examinations. However, BAC and solid adenocarcinoma of the lung have different attenuation characteristics on CT; thus, it matters which window should be used to define the T stage of the tumour. There is already evidence from Asian centres, particularly in Japan, to suggest that measurement of tumour dimensions using the mediastinal window (MW) is the better prognostic indicator [9, 10].
In the 1990s, several groups in Japan [3, 11] found that ground-glass opacity (GGO), defined as a misty obscure component of lung attenuation (hazy opacity) seen on the lung window (LW) image of high-resolution CT [12], usually represented the more benign BAC. If GGO represented more than 50% of a T1 tumour, then the lung cancer had not spread to hilar lymph nodes and could be treated with curative intent by local excision [13, 14]. The lack of a precise definition or standard method to measure GGO restricts its general use in clinical decision making for lung cancer treatment planning [15]. An alternative method, initially proposed by Takamochi et al [16] was the simpler tumour shadow disappearance rate (TDR) [16–18], which utilised the difference in area of the lung tumour on lung (TL) and soft-tissue windows (TS) using the formula (1 – TS/TL). This parameter assumed that the soft-tissue component is the more aggressive adenocarcinoma and that the LW component is a sum of all the benign (including GGO) and aggressive components. Direct comparison of TDR and GGO has shown that TDR might be the better predictor of the BAC component [19]. Aoki et al [14] calculated the percentage of GGO as follows: ([DGGO – D]/DGGO)×100, where DGGO is the greatest diameter of the tumour including the GGO area and D is the greatest diameter of the tumour without the GGO area. Their results showed that the GGO component correlated well with histological prognostic factors, such as lymph node metastasis, vessel invasion and survival. Patients with a GGO component of more than 50% had a significantly better prognosis.
Using a Western population, the first aim of this current study was to determine which of the two CT-derived measurements of the primary lesion best correlated with tumour size on histopathological examination. The study focused on patients with lung adenocarcinoma with varying degrees of BAC, the subgroup of adenocarcinomas where this distinction is most relevant. Our second aim was to assess whether modified TDR (mTDR), derived using a simpler unidimensional measurement on the lines developed by Aoki et al [14], could predict the presence or absence of advanced disease better than either lung or mediastinal window measurements alone.
Methods and materials
Patient population
The patient population used for this study was derived from all patients seen at this institution between 2001 and 2006 who met three criteria: (i) a diagnosis of adenocarcinoma of the lung with bronchoalveolar features, (ii) had undergone a staging PET-CT examination and (iii) had a complete surgical resection of the primary tumour including ipsilateral hilar nodes and routine mediastinal lymphadenectomy. The only exclusion criteria were pre-operative chemotherapy or radiotherapy. These inclusion criteria were met by 48 patients. Of these, 43 patients had their operation within 4 weeks of staging PET-CT examination and were included in the study. Unlike most previous studies, there was no upper size limit placed on tumours for analysis. This allowed observation of the effect of differences in tumour size, as measured by MW and LW sizes, on the final T value of the TNM score. This retrospective study was approved by the institutional review board and written informed consent was waived.
CT imaging information
All patients underwent integrated PET-CT scanning (Discovery LS/STE; GE Healthcare, Milwaukee, WI) with 350–400 MBq 18F-fluorodeoxyglucose (FDG) following 6 h of fasting. Multidetector CT (4- or 16-slice) scanning was performed from the head to the pelvic floor using a standardised low-dose protocol with 140 kV, 80 mA, a tube rotation time of 0.5 s, pitch of 6 and 5 mm section thickness matched to PET section thickness. Patients were instructed to hold their breath in normal expiration during the acquisition of the CT images [20]. PET data were not used for further evaluation in this study. Although the CT slice thickness was constrained by the PET-CT protocol, it compares favourably with slice thicknesses used in many studies measuring TDR or its variants [9, 16, 18, 19].
Histopathology
All tumours were resected en bloc at surgery and then sent for histopathological evaluation. The tumour size was measured on the same day as surgery, using the cut containing the macroscopically determined longest transaxial tumour dimension. Additionally, all patients underwent mediastinal lymphadenectomy as a routine procedure. The presence of BAC elements was confirmed using the 2004 WHO criteria [4]. The 43 patients were then categorised into two groups based on whether their disease had evidence of nodal and/or distal metastatic spread (advanced disease) or not (limited disease), as determined from post-operative pathologically defined T and N status. M status was based on clinical, pathological (four of five cases), CT, PET and/or MRI criteria.
CT measurements
The size of the lung adenocarcinoma primary was determined using the original RECIST criteria. Tumour size was obtained from the 5-mm transaxial images that contained the largest unidimensional tumour diameter on the LW (W/L: 1500 −500–1 HU) and then on the MW/soft-tissue window (W/L: 400 40–1 HU) with the largest unidimensional tumour diameter. The reporting physician performed these measurements on the workstation (Advantage Windows, version 4.2; GE Healthcare) using a commercial software package and was blinded to the results obtained at pathology. Interobserver reproducibility of the CT scan size was determined using the CT LW size. This was performed independently by another experienced physician blinded to previous CT and pathology measurements and on a separate day from the original measurements.
mTDR determination and utility in predicting tumour progression
The original WHO-based bidimensional approach of TDR was modified to use the simpler unidimensional RECIST approach (mTDR) to measure GGO on the lines of Aoki et al [14]: mTDR = 1 – (longest diameter on MW/longest diameter on LW). The difference in mTDR between the groups with local disease and advanced spread was studied to examine how well mTDR distinguished between local and distant disease. To enable comparison with other studies using TDR, this analysis was repeated in the 24 patients with tumours ≤3 cm on histopathological examination.
Statistical analysis
The Wilcoxon signed-rank test was used to determine the difference between various size measurements. For assessing variability between different sizes obtained at histology and CT measurement, and for interobserver variability, appropriate values were derived from Bland–Altman analysis. Interobserver reliability (ICC) was analysed in a two-way ANOVA with random effects using restricted maximum likelihood. The Mann–Whitney test was used for analysis of mTDR, tumour size and age. Sex distribution was compared using the χ2 test. Receiver operator characteristic (ROC) analysis was performed for predicting advanced disease. Statistical analyses were performed using SPSS version 13 (SPSS Inc., Chicago Il) and MedCalc for Windows, version 9.1.0.1 (MedCalc Software, Mariakerke, Belgium); p-values <0.05 are considered statistically significant. Bonferonni correction was not performed owing to small patient numbers.
Results
The 43 patients included 20 females and 23 males (mean age ±SD: 66.3±10.5 years). There were 27 patients in the limited disease group (pT1pN0M0 = 8, pT2pN0M0 = 18, pT4pN0M0 = 1) and 16 patients in the advanced disease group (NM positive: pT1pN1M0 = 2, pT1pN2M0 = 2, pT2N2M0 = 6, pT2N0pM1 = 2, pT2N2pM1 = 1, pT2N3pM1 = 1, pT4N1pM0 = 1, pT4N0pM1 = 1). There was no significant difference in sex distribution (p = 0.92) or the age of patients (p = 0.53) with limited disease (67±10 years) vs those with advanced disease (65±12 years). The surgical indications for M1 patients were as follows: palliative lobectomy and lymphadenectomy, multiple small pulmonary metastases in adjacent lobes found at surgery, initial resection of solitary brain metastasis followed by surgery for lung cancer, single cutaneous metastasis followed by surgery for suspected lung cancer primary and one patient with known liver metastases who (during coronary bypass surgery) had a lobectomy for the known primary lung cancer. Thus, four out of five patients with M1 disease had their lesions confirmed by pathological examination of their operative specimens.
Comparison of lung window and mediastinal window sizes with actual tumour size
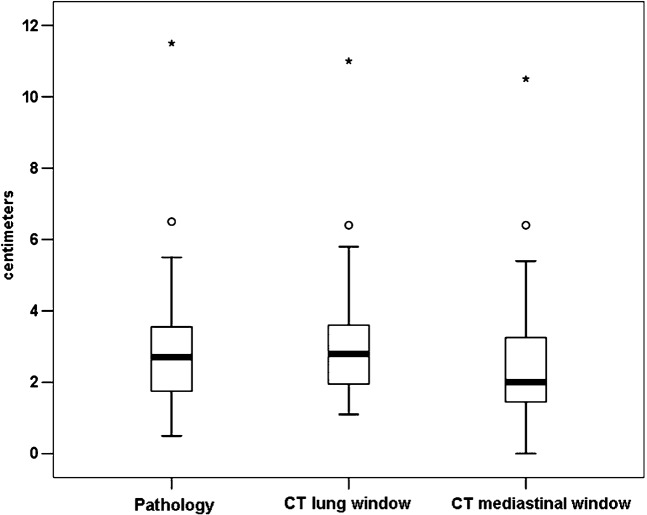
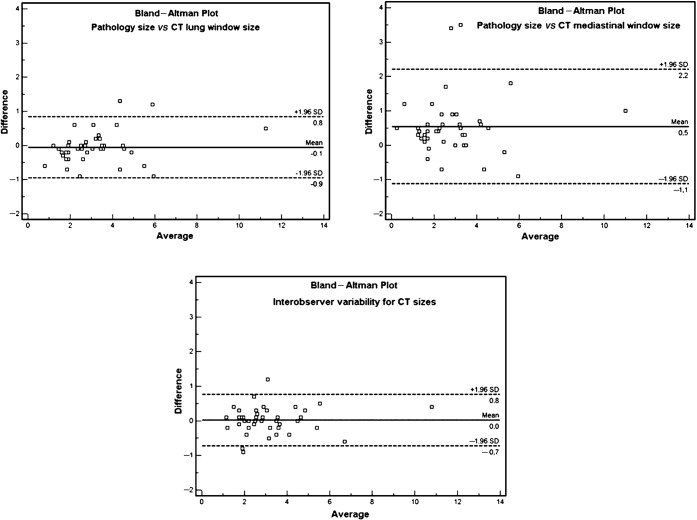
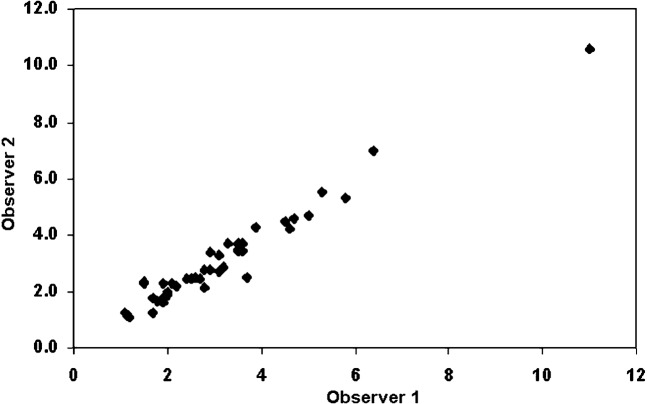
Figure 1 shows that there was a significant difference between the tumour sizes determined by LW and MW measurements (p<0.0001) and between the histopathological (HP) size and MW sizes (p<0.0001). But, there was no difference between LW and HP sizes (p = 0.18). There was an excellent correlation (Figure 2) between the HP size and either the LW or MW measurements (r = 0.97 and r = 0.89; respectively). The Bland–Altman data (Table 1; Figure 3) show that the HP sizes agreed better with LW than with MW sizes. Consequently, absolute differences between LW and HP sizes were significantly smaller than those between MW and HP sizes (p<0.0001). Interobserver variability analysis (Table 1) performed for CT sizes using LW settings showed excellent reproducibility (inter-rater reliability = 0.98; mean difference 0.0 cm; 95% confidence interval −0.7 cm to 0.8 cm) (Figures 3 and 4).
Figure 1.
Box-plot display of the sizes measured on the post-operative histopathology specimen (HP), lung window (LW) and mediastinal window (MW) settings of the CT scan. The central box represents values from the lower to the upper quartile (25 to 75 percentile). The middle line represents the median. The vertical line extends from the minimum to the maximum value, excluding outside (circle) and far outside (asterisks) measurements. There is no difference between HP and LW (p = 0.18), but a significant difference is seen between HP and MW sizes (p<0.0001).
Figure 2.
Scatter diagram for histopathological (HP) tumour size vs (a) CT lung window (LW) size and (b) mediastinal window (MW) size. Less variability is seen between HP and LW sizes compared with HP and MW sizes. Scales for both X and Y axes are in centimetres.
Table 1. Bland–Altman plot analysis values for histopathology and CT window size comparisons.
| HP vs LW | HP vs MW | LW vs MW | Obs1 vs Obs2 | |
| Arithmetic mean | −0.05 | 0.54 | 0.60 | 0.023 |
| 95% CI | −0.19 to 0.09 | 0.28 to 0.81 | 0.42 to 0.78 | −0.09 to 0.14 |
| SD | 0.46 | 0.89 | 0.59 | 0.38 |
| Lower limit | −0.95 | −1.12 | −0.56 | −0.72 |
| 95% CI | −1.19 to −0.70 | −1.57 to −0.67 | −0.87 to −0.24 | −0.92 to −0.51 |
| Upper limit | 0.84 | 2.21 | 1.75 | 0.77 |
| 95% CI | 0.60 to 1.09 | 1.76 to 2.66 | 1.44 to 2.06 | −0.57 to 0.97 |
| ICC | 0.97 | 0.89 | 0.95 | 0.98 |
CI, confidence interval; HP, histopathology; ICC, intraclass correlation coefficient; LW, CT lung window; MW, CT soft-tissue/mediastinal window; Obs1, Observer 1; Obs2, Observer 2; SD, standard deviation.
Figure 3.
Bland–Altman plots for histopathology size vs CT lung window (LW) and mediastinal window size and interobserver variability for CT LW size. SD, standard deviation.
Figure 4.
Interobserver variability for CT lung window tumour size data show very good agreement. Scales for both X and Y axes are in centimetres.
Comparison of traditional tumour size measurements and mTDR in predicting advanced disease
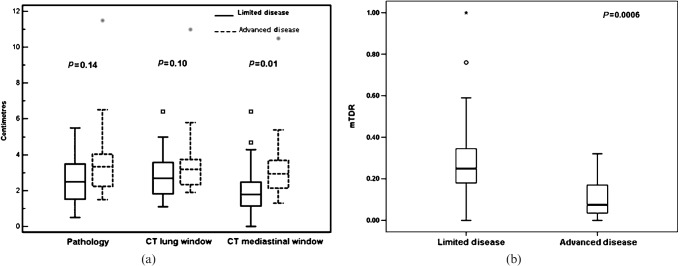
The ability of HP, LW and MW size to distinguish between advanced and limited disease is shown in Figure 5a. Note that there is an increasingly more significant separation of patients with limited disease and advanced disease, with the best separation obtained by MW. This suggests that the traditional tumour measurement should be performed using MW, which, in this series, results in 6/22 (27%; 95% confidence interval 7–48%) T2 patients being downstaged to T1.
Figure 5.
Box-plot displays for (a) histopathological (HP), lung window (LW) and mediastinal window (MW) sizes and (b) modified tumour shadow disappearance rate (mTDR) in patients with limited disease and in patients with progressive disease. The central box represents values from the lower to the upper quartile (25 to 75 percentile). The middle line represents the median. The vertical line extends from the minimum to the maximum value, excluding outside (small box/circle) and for outside (grey diamond/asterisk) measurements. Unlike HP and LW sizes, MW and mTDR sizes showed a significant difference between the two groups.
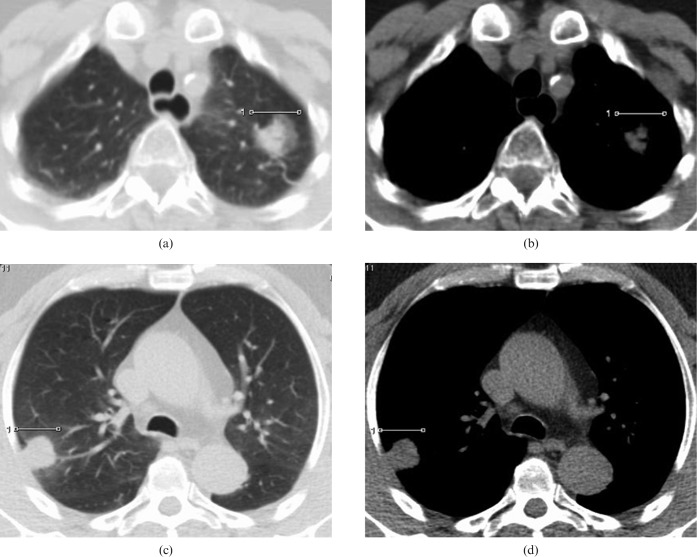
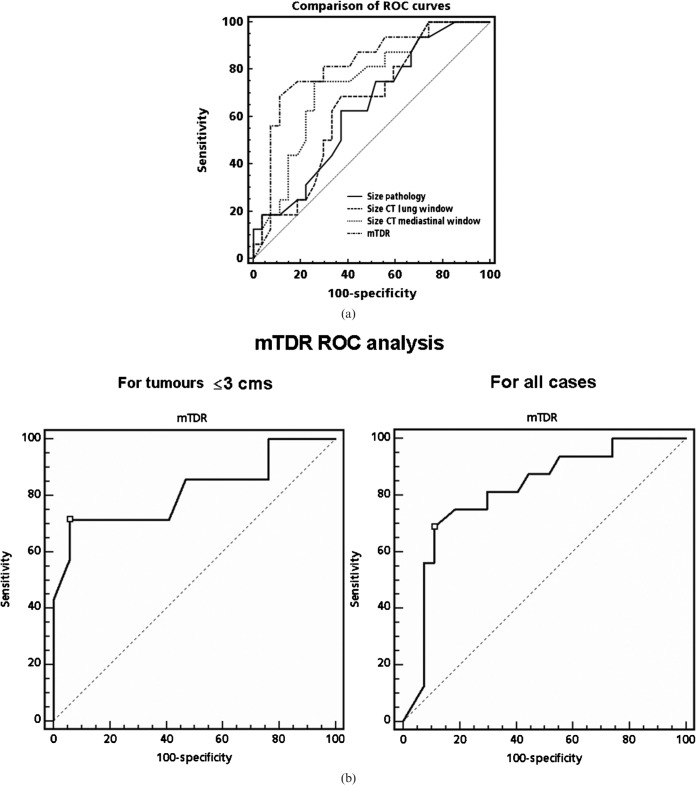
However, even better separation was obtained with mTDR (p = 0.0006) (Figure 5b). Figure 6 shows examples of patients with either a large or a trivial difference between LW and MW in unidimensional tumour size measurements. The ROC analysis presented in Figure 7a (including the T4 patients) and Table 2 shows the significant utility of mTDR in predicting limited disease vs advanced disease (area under the curve (AUC) 0.818; p = 0.001). At a cut-off of mTDR ≤0.13, specificity was 89% and sensitivity was 69% for the presence of advanced disease. Using stepwise logistic regression analysis, mTDR appeared to be the only independent predictor of tumour advancement (nodal or distal metastases). Similar trends were observed in the subgroup of patients with tumours ≤3 cm (Table 3; Figure 7b). Here, owing to smaller numbers, mTDR was the only significant predictor of tumour advancement (p = 0.017), with MW no longer being significant (p = 0.081). At a cut-off of mTDR ≤0.2, the specificity of mTDR was 94% and the sensitivity was 71%. Only two of seven cases with evidence for advanced disease had mTDR values >0.2 (0.26 and 0.32).
Figure 6.
CT scan images in a patient with limited (pT2pN0M0) disease; there is significant difference in the size of the tumour on (a) the lung and (b) mediastinal CT scan windows. The modified tumour shadow disappearance rate (mTDR) was 0.59. In contrast, in another patient with advanced disease (pT2pN0M1: vertebral metastases) there is minimal difference in tumour size between (c) the lung and (d) mediastinal windows. mTDR was 0.04.
Figure 7.
(a) Receiver operating characteristic (ROC) analysis for tumour size on histopathology, CT lung window scan, CT mediastinal window scan and modified tumour shadow disappearance rate (mTDR) for differentiating between limited (nodes, metastasis (NM)-negative) and advanced disease (NM-positive) patients. The best cut-off was seen at mTDR = 0.13. (b) ROC analysis for mTDR for tumour sizes ≤3 cm and for all sizes.
Table 2. Comparison of HP, LW, MW and mTDR for their ability to distinguish advanced disease from limited disease (ROC analysis).
| Measurement methoda | Criterion | Sensitivity (%) | Specificity (%) | AUC | p-Valueb |
| HP | ≥2.8 cm | 62 | 63 | 0.64 | 0.14 |
| LW | ≥2.8 cm | 69 | 63 | 0.65 | 0.10 |
| MW | ≥2.1 cm | 75 | 74 | 0.74 | 0.01 |
| mTDR | ≤0.13 | 69 | 89 | 0.82 | 0.001 |
aTumour size determined by histopathology (HP) on CT lung window (LW) or on CT soft-tissue/mediastinal window (MW); mTDR, modified tumour shadow disappearance rate = (1 – [MW/LW]). bTest for null hypothesis: true area = 0.5. AUC, area under the receiver operating characteristic (ROC) curve.
Table 3. Comparison of HP, LW, MW and mTDR for their ability to distinguish advanced disease from limited disease in patients with tumours ≤3 cm (ROC analysis).
| Measurement methoda | Criterion | Sensitivity (%) | Specificity (%) | AUC | p-Valueb |
| HP | ≥1.65 cm | 86 | 47 | 0.65 | 0.25 |
| LW | ≥1.95 cm | 71 | 53 | 0.69 | 0.15 |
| MW | ≥1.35 cm | 86 | 41 | 0.73 | 0.08 |
| mTDR | ≤0.20 | 71 | 94 | 0.82 | 0.017 |
aTumour size determined by histopathology (HP) on CT lung window (LW) or on CT soft-tissue/mediastinal window (MW); mTDR, modified tumour shadow disappearance rate = (1–[MW/LW]). bTest for null hypothesis: true area = 0.5. AUC, area under the receiver operating characteristic (ROC) curve.
Discussion
This study shows that in adenocarcinoma of the lung with BAC components, unidimensional measurement of tumour size on transverse CT scan sections using a LW matched better with histologically determined tumour size than those using an MW; these results were highly reproducible. Although there was a significant and systematic underestimation of tumour size using the MW (downstaging 27% (95% confidence interval 7–48%) of our cases from T2 to T1), the MW-derived sizes were a better predictor of the presence of advanced disease than either pathological or LW-determined sizes. This finding suggests that MWs should be used in preference to LW measurements for pre-operative staging or RECIST assessment in this patient subgroup. Interestingly, probably the best predictor for disease spread was mTDR and, unlike the MW measurements, it might have a role in clinical decision making regarding prognosis in individual patients in this subgroup.
The RECIST guidelines do not insist on any particular window setting on CT scan for size measurement of an intraparenchymal lung lesion [21]. However, the size of a lung cancer lesion per se has prognostic significance, especially for early lung cancers [22–24]. In patients with adenocarcinoma of the lung, particularly those with BAC components, this conventional T staging might be inappropriate. Our results confirm the Japanese studies which found that size measured on CT using an MW setting had better discrimination between absence or presence of nodal spread and prognostic value than size measured on an LW setting [9, 25, 26]. This can be explained by the fact that the LW incorporates both benign and aggressive elements of mixed adenocarcinomas. Using LWs alone requires precise identification of the fraction of benign elements, such as GGO, which correlate with histological findings and long-term prognosis [3, 27, 28]. For example, pure BACs with 100% GGO have an excellent prognosis following resection [4, 29] and, although not all tumours with apparent 100% ground-glass appearance are free of invasive adenocarcinoma components [30, 31], their outcomes appear to remain benign. By contrast, the MW predominantly only measures the size of the more aggressive soft-tissue component. Follow-up studies have confirmed that temporal changes in tumour dimension can vary considerably depending on the window chosen: tumour size decreases on LWs, but is constant or of increasing size for the soft-tissue component [32]. This has significant implications for clinical studies using serial tumour measurement with LWs, as part of determining RECIST criteria. Our findings that tumour measurement from CT scans using MWs is a better indicator of metastatic potential (advanced disease) would support the use of CT MW measurements for determining RECIST criteria.
Alternative approaches using simpler radiological measurements of tumour size based on lung and soft-tissue windows [9], particularly the two-dimensional TDR [16–19] from which the mTDR in the current study is derived, correlate well with quantitative measurement of the degree of ground-glass appearance. These measurements are at least as good a prognostic indicator as the GGO-based methods [19]. Thus, our study confirms the earlier finding that the degree of TDR is inversely associated with the likelihood of distant spread of tumour and the best of the CT measurement parameters at separating limited from advanced disease. Support for our findings on ROC analysis is found in several TDR studies evaluating tumours ≤3 cm in size [18, 33]. By roughly converting their bidimensional (1 – area MW/area LW) cut-off values of ∼0.5 between high- and low-risk patients to unidimensional values (1–MW/LW) as 1–√0.5, an equivalent mTDR value of ∼0.3, is obtained. This is very similar to the highest mTDR value (0.32) seen in our subgroup with tumours ≤3 cm in size and advanced disease. It is also consistent with the study by Aoki et al [14], using a similar measurement approach to GGO data. This study found that in 127 patients, 19 of 25 with lymph node metastases had a GGO/total tumour ratio of <0.1 and 24/25 had a ratio of <0.5. This discrimination is particularly important in cases where tumours are FDG negative or only mildly FDG avid on combined PET-CT study in this era of PET-CT.
The following limitations of this study need to be acknowledged. Firstly, like most studies in this clinical area, it is a retrospective review and thus might have issues of inadvertent selection bias in the patient population. In particular, the small number of patients limited the power of the study to determine the prognostic potential of mTDR vs MW. However, unlike virtually all other studies, we used only patients with a mixture of BAC and solid adenocarcinoma elements, thereby more rigorously testing the benefit of mTDR in the adenocarcinoma subgroup in which this information is most clinically relevant. Another apparent limitation might be the use of 5-mm CT slices rather than the 1- to 3-mm slices used for GGO measurement. The choice of slice thickness was constrained by the PET-CT protocol being used at the time of data acquisition; however, this is similar to or better than slice thicknesses used in several earlier studies assessing MW to LW ratios [9] or TDR [18, 19], including the original study by Takamochi et al [16], which used 10-mm slices. Clearly, more recent advances in PET-CT provide much finer cuts that would allow more accurate measurements of the parameters investigated and could potentially further add to the robustness of this methodology; however, this is yet to be proven.
Conclusion
In mixed adenocarcinoma of the lung, measurement of tumour size on CT using lung window settings best correlates with actual tumour size. However, CT measurement using mediastinal window settings better correlates with the probability of advanced disease; thus, this value might also need to be recorded for RECIST assessment in clinical trials, until future larger series clarify the extent of any potential benefit. The most useful CT parameter for predicting the presence of advanced disease could be mTDR, however, which uses a combination of the two window settings.
Acknowledgements
UNB was supported by a scholarship from the “Federal Commission for scholarships for foreign students”, Switzerland. VK’s sabbatical leave was funded by Alfred Hospital, Melbourne, Australia and its WTMSPPF.
References
- 1.Hoffman PC, Mauer AM, Vokes EE. Lung cancer. Lancet 2000;355:479–85 [DOI] [PubMed] [Google Scholar]
- 2.Noguchi M, Morikawa A, Kawasaki M, Matsuno Y, Yamada T, Hirohashi S, et al. Small adenocarcinoma of the lung. Histologic characteristics and prognosis. Cancer 1995;75:2844–52 [DOI] [PubMed] [Google Scholar]
- 3.Kuriyama K, Seto M, Kasugai T, Higashiyama M, Kido S, Sawai Y, et al. Ground-glass opacity on thin-section CT: value in differentiating subtypes of adenocarcinoma of the lung. AJR Am J Roentgenol 1999;173:465–9 [DOI] [PubMed] [Google Scholar]
- 4.Travis WD, Garg K, Franklin WA, Wistuba , II , Sabloff B, Noguchi M, et al. Evolving concepts in the pathology and computed tomography imaging of lung adenocarcinoma and bronchioloalveolar carcinoma. J Clin Oncol 2005;23:3279–87 [DOI] [PubMed] [Google Scholar]
- 5.Terasaki H, Niki T, Matsuno Y, Yamada T, Maeshima A, Asamura H, et al. Lung adenocarcinoma with mixed bronchioloalveolar and invasive components: clinicopathological features, subclassification by extent of invasive foci, and immunohistochemical characterization. Am J Surg Pathol 2003;27:937–51 [DOI] [PubMed] [Google Scholar]
- 6.Therasse P, Eisenhauer EA, Verweij J. RECIST revisited: a review of validation studies on tumour assessment. Eur J Cancer 2006;42:1031–9 [DOI] [PubMed] [Google Scholar]
- 7.Miller AB, Hoogstraten B, Staquet M, Winkler A. Reporting results of cancer treatment. Cancer 1981;47:207–14 [DOI] [PubMed] [Google Scholar]
- 8.WHO handbookforreportingresultsofcancertreatment Geneva, Switzerland: WHO; 1979. [Google Scholar]
- 9.Dong B, Sato M, Sagawa M, Endo C, Usuda K, Sakurada A, et al. Computed tomographic image comparison between mediastinal and lung windows provides possible prognostic information in patients with small peripheral lung adenocarcinoma. J Thorac Cardiovasc Surg 2002;124:1014–20 [DOI] [PubMed] [Google Scholar]
- 10.Sakao Y, Nakazono T, Tomimitsu S, Takeda Y, Sakuragi T, Natsuaki M, et al. Lung adenocarcinoma can be subtyped according to tumor dimension by computed tomography mediastinal-window setting. Additional size criteria for clinical T1 adenocarcinoma. Eur J Cardiothorac Surg 2004;26:1211–15 [DOI] [PubMed] [Google Scholar]
- 11.Jang HJ, Lee KS, Kwon OJ, Rhee CH, Shim YM, Han J. Bronchioloalveolar carcinoma: focal area of ground-glass attenuation at thin-section CT as an early sign. Radiology 1996;199:485–8 [DOI] [PubMed] [Google Scholar]
- 12.Austin JH, Muller NL, Friedman PJ, Hansell DM, Naidich DP, Remy-Jardin M, et al. Glossary of terms for CT of the lungs: recommendations of the Nomenclature Committee of the Fleischner Society. Radiology 1996;200:327–31 [DOI] [PubMed] [Google Scholar]
- 13.Kodama K, Higashiyama M, Yokouchi H, Takami K, Kuriyama K, Mano M, et al. Prognostic value of ground-glass opacity found in small lung adenocarcinoma on high-resolution CT scanning. Lung Cancer 2001;33:17–25 [DOI] [PubMed] [Google Scholar]
- 14.Aoki T, Tomoda Y, Watanabe H, Nakata H, Kasai T, Hashimoto H, et al. Peripheral lung adenocarcinoma: correlation of thin-section CT findings with histologic prognostic factors and survival. Radiology 2001;220:803–9 [DOI] [PubMed] [Google Scholar]
- 15.Matsuguma H, Nakahara R, Anraku M, Kondo T, Tsuura Y, Kamiyama Y, et al. Objective definition and measurement method of ground-glass opacity for planning limited resection in patients with clinical stage IA adenocarcinoma of the lung. Eur J Cardiothorac Surg 2004;25:1102–6 [DOI] [PubMed] [Google Scholar]
- 16.Takamochi K, Nagai K, Yoshida J, Suzuki K, Ohde Y, Nishimura M, et al. Pathologic N0 status in pulmonary adenocarcinoma is predictable by combining serum carcinoembryonic antigen level and computed tomographic findings. J Thorac Cardiovasc Surg 2001;122:325–30 [DOI] [PubMed] [Google Scholar]
- 17.Nakayama H, Yamada K, Saito H, Oshita F, Ito H, Kameda Y, et al. Sublobar resection for patients with peripheral small adenocarcinomas of the lung: surgical outcome is associated with features on computed tomographic imaging. Ann Thorac Surg 2007;84:1675–9 [DOI] [PubMed] [Google Scholar]
- 18.Okada M, Nishio W, Sakamoto T, Uchino K, Tsubota N. Discrepancy of computed tomographic image between lung and mediastinal windows as a prognostic implication in small lung adenocarcinoma. Ann Thorac Surg 2003;76:1828–32 discussion 1832 [DOI] [PubMed] [Google Scholar]
- 19.Okada M, Nishio W, Sakamoto T, Uchino K, Hanioka K, Ohbayashi C, et al. Correlation between computed tomographic findings, bronchioloalveolar carcinoma component, and biologic behavior of small-sized lung adenocarcinomas. J Thorac Cardiovasc Surg 2004;127:857–61 [DOI] [PubMed] [Google Scholar]
- 20.Goerres GW, Kamel E, Heidelberg TN, Schwitter MR, Burger C, von Schulthess GK. PET-CT image co-registration in the thorax: influence of respiration. Eur J Nucl Med Mol Imaging 2002;29:351–60 [DOI] [PubMed] [Google Scholar]
- 21.Therasse P, Arbuck SG, Eisenhauer EA, Wanders J, Kaplan RS, Rubinstein L, et al. New guidelines to evaluate the response to treatment in solid tumors. European Organization for Research and Treatment of Cancer, National Cancer Institute of the United States, National Cancer Institute of Canada. J Natl Cancer Inst 2000;92:205–16 [DOI] [PubMed] [Google Scholar]
- 22.Martini N, Bains MS, Burt ME, Zakowski MF, McCormack P, Rusch VW, et al. Incidence of local recurrence and second primary tumors in resected stage I lung cancer. J Thorac Cardiovasc Surg 1995;109:120–9 [DOI] [PubMed] [Google Scholar]
- 23.Padilla J, Calvo V, Penalver JC, Zarza AG, Pastor J, Blasco E, et al. Survival and risk model for stage IB non-small cell lung cancer. Lung Cancer 2002;36:43–8 [DOI] [PubMed] [Google Scholar]
- 24.Port JL, Kent MS, Korst RJ, Libby D, Pasmantier M, Altorki NK. Tumor size predicts survival within stage IA non-small cell lung cancer. Chest 2003;124:1828–33 [DOI] [PubMed] [Google Scholar]
- 25.Sakao Y, Nakazono T, Sakuragi T, Natsuaki M, Itoh T. Predictive factors for survival in surgically resected clinical IA peripheral adenocarcinoma of the lung. Ann Thorac Surg 2004;77:1157–61 discussion 1161–2 [DOI] [PubMed] [Google Scholar]
- 26.Takashima S, Li F, Maruyama Y, Hasegawa M, Takayama F, Kadoya M, et al. Discrimination of subtypes of small adenocarcinoma in the lung with thin-section CT. Lung Cancer 2002;36:175–82 [DOI] [PubMed] [Google Scholar]
- 27.Higashiyama M, Kodama K, Yokouchi H, Takami K, Mano M, Kido S, et al. Prognostic value of broncho-alveolar carcinoma component of small lung adenocarcinoma. Ann Thorac Surg 1999;68:2069–73 [DOI] [PubMed] [Google Scholar]
- 28.Takashima S, Maruyama Y, Hasegawa M, Yamanda T, Honda T, Kadoya M, et al. Prognostic significance of high-resolution CT findings in small peripheral adenocarcinoma of the lung: a retrospective study on 64 patients. Lung Cancer 2002;36:289–95 [DOI] [PubMed] [Google Scholar]
- 29.Ohtsuka T, Watanabe K, Kaji M, Naruke T, Suemasu K. A clinicopathological study of resected pulmonary nodules with focal pure ground-glass opacity. Eur J Cardiothorac Surg 2006;30:160–3 [DOI] [PubMed] [Google Scholar]
- 30.Yang Z, Sone S, Takashima S, Li F, Honda T, Yamanda T. Small peripheral carcinomas of the lung: thin-section CT and pathologic correlation. Eur Radiol 1999;9:1819–25 [DOI] [PubMed] [Google Scholar]
- 31.Nakata M, Sawada S, Saeki H, Takashima S, Mogami H, Teramoto N, et al. Prospective study of thoracoscopic limited resection for ground-glass opacity selected by computed tomography. Ann Thorac Surg 2003;75:1601–5 discussion 1605–6 [DOI] [PubMed] [Google Scholar]
- 32.Kakinuma R, Ohmatsu H, Kaneko M, Kusumoto M, Yoshida J, Nagai K, et al. Progression of focal pure ground-glass opacity detected by low-dose helical computed tomography screening for lung cancer. J Comput Assist Tomogr 2004;28:17–23 [DOI] [PubMed] [Google Scholar]
- 33.Kondo T, Yamada K, Noda K, Nakayama H, Kameda Y. Radiologic-prognostic correlation in patients with small pulmonary adenocarcinomas. Lung Cancer 2002;36:49–57 [DOI] [PubMed] [Google Scholar]


