Abstract
Objective
The increasing quality of diagnostic ultrasound has resulted in the detection of greater numbers of potentially benign hepatic lesions. Current radiological practice requires contrast enhanced ultrasound, CT or MRI to confirm the diagnosis. Acoustic radiation force impulse (ARFI) elastography is an imaging technique measuring the elasticity of biological tissues. Recent technical advances in ultrasound have made it possible to generate shear waves, whose velocity in the liver is proportional to the degree of hepatic elasticity.
Methods
This shear wave velocity (SWV) may be used as a marker for both focal and diffuse liver pathology.We used this technique to examine patients with normal livers and those with haemangiomata and metastases.
Results
Patients with normal ultrasound examinations and normal liver enzymes, n = 99, had SWVs of 1.24±0.23 m s−1 (mean ± standard deviation) independent of site of measurement, age or gender. Results of SWV measurements in haemangiomata, n = 35, produced values of the same order, 1.35±0.48 m s−1. In contrast, patients with metastases, n = 10, had SWVs of 4.23±0.59 m s−1. With a cut-off value of 2.5 m s−1, the sensitivity and specificity for haemangiomata were 97.1% and 100%, respectively, with an area under the curve of 0.999.
Conclusion
ARFI elastography with SWV measurements is a promising new technique which could replace invasive investigations for benign hepatic lesions.
Ultrasound elastography measures tissue elasticity and has been available in various forms for many years [1]. In the liver, transient elastography (FibroScan, Echosens, Paris, France) [2] has been increasingly used as a non-invasive tool for assessing liver fibrosis by measuring liver stiffness. Transient elastography uses an ultrasound probe mounted on the axis of a vibrator. This vibrator induces a shear wave that propagates through the underlying tissues, and its velocity can be measured by pulsed ultrasonic beams. This velocity is directly related to tissue stiffness. The stiffer the tissue, the faster the shear wave propagates. This technique has been shown to be highly reproducible with minimal inter- and intra-observer variability. However, the FibroScan produces no images and cannot be used to assess focal lesions.
Real-time sonoelastography [3] is a technique developed by Hitachi Medical Systems (Zug, Switzerland), which produces colour-coded images of the liver reflecting its degree of elasticity. It is useful for assessing focal lesions but does not allow numerical measurements of their elasticity.
Acoustic radiation force impulse (ARFI) imaging [4] is a new ultrasound technique which provides both conventional images as well as numerical measurements of tissue elasticity. This is clinically relevant because the liver can have non-homogeneous areas which may show changes in their elasticity before abnormalities can be adequately characterised by conventional ultrasound [5]. ARFI uses short-duration acoustic pulses to produce localised displacements in tissue and to track them. These displacements can be monitored both spatially and temporally and are called shear waves. The shear wave velocity (SWV) is proportional to the elastic characteristics of the tissue being examined. ARFI ultrasound is safe and non-invasive. The technique is easy and rapid to use, reproducible and operator independent [6,7].
The most common hepatic lesions found on ultrasound are haemangiomata. A recent publication suggests an incidence of 10–20% [8]. Conventional ultrasound is operator dependent and can have a specificity of as low as 48% for haemangiomata [9]. Current radiological practice requires verification of these lesions either by contrast enhanced ultrasound, CT or MRI scans.
In the absence of published values at the time, we first used ARFI to measure SWV in normal hepatic tissue in patients with a normal ultrasound scan and normal blood tests.
Subsequently, we measured the SWV in patients with haemangiomata and metastases.
This study addresses the questions, what is the variation in SWV in normal hepatic tissue, and can the SWV be used to distinguish haemangiomata from metastases?
Methods and materials
The study was approved by the ethical committee of St Lucas Andreas Hospital. Informed consent was obtained before elastography measurements were performed.
Normal hepatic tissue: study design and population
All patients undergoing upper abdominal ultrasound in the study period were checked for liver disease and suitability for inclusion. They were referred from general practitioners and from medical and surgical outpatient clinics. The main reasons for referral were pain and discomfort. This study was performed in a large peripheral general hospital with an ethnically diverse population in January and February 2009.
The exclusion criteria were:
abnormal liver enzymes (aspartate aminotransferase (AST), alanine transaminase (ALT), alkaline phosphatase (AP) and gamma-glutamyl transpeptidase (GGT);
abnormal full blood counts;
an abnormal ultrasound examination with either focal or diffuse liver abnormalities; and
patient refusal.
Of the 410 patients who underwent upper abdominal ultrasound in the study period, 99 were allocated to the healthy liver sample.
Focal hepatic lesions: study design and population
The second part of the study focusing on focal hepatic lesions took place in March and April 2009. All consecutive focal hepatic lesions were evaluated using SWV measurements. Deep lesions that could not be adequately evaluated using ARFI elastography were excluded. 3 patients had lesions under 10 mm in size, which was the size of the box for elastography. In these cases the lesions were centred in the middle of the box and the measurements repeated 1 week later.
Most lesions encountered were solitary with ultrasound characteristics of haemangiomata. Multiple lesions with evident signs of malignancy, such as central necrosis, were excluded. Only lesions mimicking benignity underwent elastography measurements. Our sample consisted of 21 patients with 21 haemangiomata, 5 with 2 haemangiomata and 1 with 4 haemangiomata, i.e. a total of 35 haemangiomata. Additionally, 10 patients with 10 metastases were included.
Technique of elastography
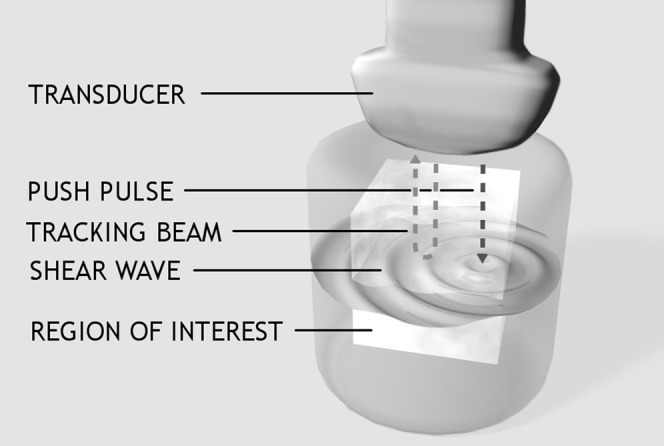
An ultrasound scan of the liver is obtained with the region of interest centred on the voxel (volume pixel) under investigation (Figure 1). The transducer generates an ultrasonic pulse to displace tissue in this region of interest by 3–5 microns. The shear waves produced can be interrogated using tracking beams and their velocity quantified.
Figure 1.

The mechanics of shear wave generation and the measurement of shear wave velocity in the region of interest.
The elastography measurements were obtained using an Acuson 2000 ultrasound system with Virtual Touch™ Tissue Quantification (Siemens, Erlangen, Germany). A 1–4.5 MHz curved broad band transducer was used. Voxel size was fixed at 10×5×5 mm. The energy used for SWV measurements is similar to that in colour Doppler imaging (compliant with Food and Drug Administration guidelines) [5]. Typical spatial-peak, pulse average intensities were of the order of 820 W cm−2, with a beam width of 2 mm in the focal zone and band pulse lengths of 100–300 μs.
Procedures
SWV measurements in healthy livers were obtained via a single breath-hold, first in segment 2 at a depth of 5 cm and subsequently in the region of the gallbladder, that is between segments 4 and 5, also at a depth of 5 cm. For focal lesions, separate measurements were obtained of the SWV in the lesion and in adjacent liver tissue. All SWV results were the average of two separate consecutive measurements. The results are presented in metres per second. Lesion size was measured on multiple scans retaining the maximum diameter in any single direction. The procedure adds 5 min to the conventional examination time.
Verification of focal lesions
All patients with focal lesions underwent multiphase CT scanning with intravenous contrast or MR scanning with gadolinium. We did not have access to contrast enhanced ultrasound. The CT criteria for haemangioma diagnosis were early, peripheral nodular enhancement in the arterial phase, with centripetal filling-in during the portal venous phase. Typical MR appearances show a smooth well-defined mass with low-signal intensity on T1 weighted images and high-signal intensity on T2 weighted images. Gadolinium administration produces similar appearances to contrast CT. Three patients whose subsequent CT scans showed disseminated malignancy underwent lesion biopsy. One patient with high SWV measurements (2.7 m s−1) and an equivocal multiphase CT scan also underwent lesion biopsy.
MR accuracy [10] is higher than that for multiphase CT [11]. CT has a sensitivity of 75% with a specificity of 95% for haemangiomata [11]. MR has a sensitivity of approximately 90% with a specificity of 91–99% [12]. Contrast CT, contrast MR and biopsy were used as gold standards.
Statistical analyses
Statistical analyses were performed using Predictive Analytics Software for Windows, version 18.0 (SPSS Inc., Chicago, USA). Receiver operator characteristic analyses were performed using MedCalc for Windows, version 11.2.1.0 (MedCalc Software, Mariakerke, Belgium).
In the healthy liver group, gender distribution was evaluated using the binomial test. Participant age was tested for normality using the Shapiro–Wilk test. Gender differences in age were evaluated using the t-test. SWV differences between liver lobes were assessed using the Wilcoxon signed-ranks test. Mean, standard deviation (SD) and range for SWV were calculated. Normality was checked by normal probability plots and Shapiro–Wilk tests. Non-parametric tests were used where appropriate.
In the focal lesion groups, lesion size and age were expressed in means and standard deviations. Age distribution differences between groups were evaluated with the t-test.
Correlations between age, SWV and lesion size were tested using Spearman's rho or Kendall's tau depending on group size.
Receiver operator characteristic analyses were performed using the DeLong et al [13] methodology to calculate areas under the curve. Optimal SWV cut-off points based on 100% specificity for benignity were derived.
A p-value less than 0.05 was considered statistically significant.
Results
Healthy participants
In January and February 2009, 99 patients (54 females, 45 males, binomial test, p = 0.42) who underwent liver ultrasound were simultaneously evaluated using SWV measurements. Participant age demonstrated a normal distribution (Shapiro–Wilk test; p = 0.57) and was similar for males and females (t-test; p = 0.55). Age characteristics are shown in Table 1.
Table 1. Age characteristics of healthy participants (values in years).
| Mean | SD | Range | |
| Healthy participants (n = 99) | 48.8 | 16.1 | 9–85 |
| Males (n = 45) | 47.7 | 16.2 | 20–84 |
| Females (n = 54) | 49.6 | 16.1 | 9–85 |
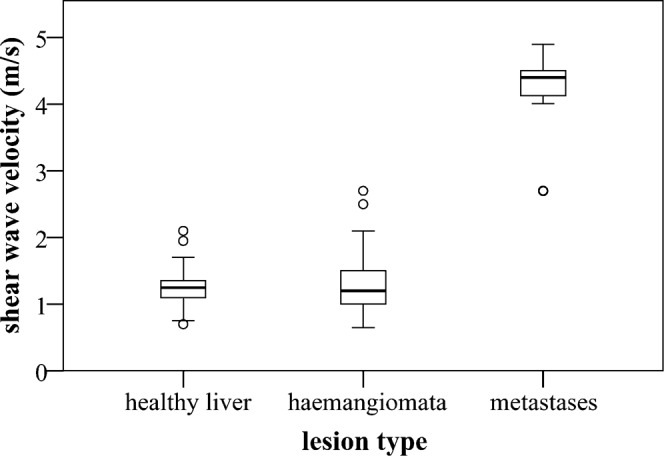
Comparison of left and right liver lobes showed no significant difference in SWV (mean difference 0.012 m s−1, Wilcoxon signed ranks test; p = 0.53). The mean SWV of both liver lobes was therefore used in subsequent analyses. The distribution of this compound SWV is shown in Figure 2.
Figure 2.

Shear wave velocity distribution in healthy livers, haemangiomata and metastases. Boxplots with medians, quartiles and outliers (hollow dots) are depicted.
The mean SWV in healthy livers was 1.24 m s−1 (SD 0.23) with a range of 0.7–2.1 m s−1. Because of its non-normal distribution (right-skewed and leptokurtic (i.e. more peaked about the mode than the normal distribution), Shapiro-Wilk test; p = 0.002), non-parametric tests were used in subsequent analyses.
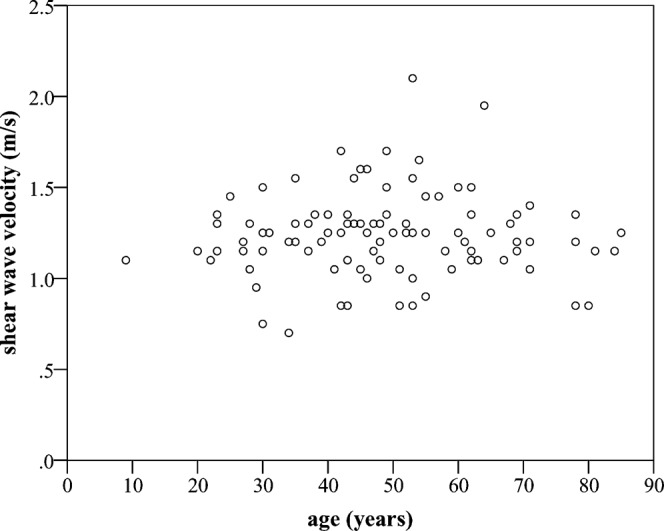
The SWV distribution in healthy livers was similar for males and females (Mann–Whitney U-test; two-tailed exact p = 0.51). In addition, SWV was independent of participant age (Spearman's rho; correlation coefficient 0.025, p = 0.80) (Figure 3).
Figure 3.

Liver shear wave velocity plotted against age in healthy participants.
Haemangiomata
27 patients (18 females, 9 males) with 35 haemangiomata underwent SWV measurements. The haemangiomata measured 7–70 mm (mean 21.60, SD 13.99). Patients were aged 20–80 years (mean 47.43, SD 13.66) and showed a similar distribution as in the healthy reference group (t-test; p = 0.66).
The SWV in haemangiomata was 1.35±0.48 m s−1 (mean ± SD) and did not significantly differ from healthy liver SWVs (Mann–Whitney U-test; two-tailed exact p = 0.68), (Figure 2). There was no correlation between SWV and haemangioma size (Spearman's rho; correlation coefficient 0.24, p = 0.17) or participant age (Spearman's rho; correlation coefficient 0.17, p = 0.33).
Metastases
10 patients (4 females, 6 males) with metastases (lung n = 3, colon n = 4, pancreas n = 1, biliary n = 1, kidney n = 1), ranging from 14 to 90 mm (mean 41.4, SD 22.9), underwent SWV measurements. Age of patients ranged from 45 to 86 years (mean 71.1, SD 13.4), significantly older than in the healthy reference group (mean difference 22.3 years, t-test; p = 0.00005).
The SWV in metastases was 4.23±0.59 m s−1, which constitutes a significant difference compared with the SWV in haemangiomata (Mann–Whitney U-test; 1-tailed exact p = 0.0000000006), (Figure 2).
There was no correlation between SWV and metastasis size (Kendall's tau; correlation coefficient −0.37, p = 0.15) or participant age (Kendall's tau; correlation coefficient 0.07, p = 0.79).
Shear wave velocity as marker for benignity
Using a SWV cut-off point of 2.5 m s−1 in discriminating between haemangiomata and metastases would result in 97.1% sensitivity (95% confidence interval (CI) 85.1–99.9) and 100% specificity (CI 69.2–100.0) for haemangiomata with an area under the curve (AUC) of 0.999 (CI 0.92–1.00).
To further explore the nature of SWV as a marker of lesion benignity, SWVs of haemangiomata and metastases were compared with the SWVs in adjacent normal liver tissue. Both the ratio and the difference were calculated.
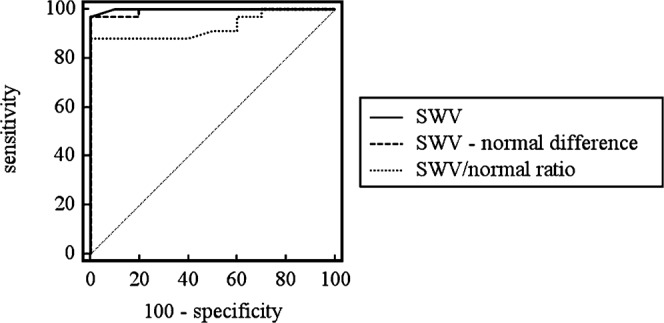
A SWV ratio cut-off point of 1.6 would result in 88.2% sensitivity (CI 72.5–96.7) and 100% specificity (CI 69.2–100.0) with an AUC of 0.93 (CI 0.81–0.99). For the SWV difference a cut-off point of 1.0 m s−1 would produce 97.1% sensitivity (CI 84.7–99.9) and 100% specificity (CI 69.2–100.0) with an AUC of 0.994 (CI 0.91–1.00). Receiver operator curves are plotted in Figure 4.
Figure 4.

Receiver operator curves for shear wave velocity (SWV) as a marker for haemangiomata.
Discussion
In the first part of our study we found a narrow range of shear wave velocities in normal liver tissue with SWVs of 1.24±0.23 m s−1. This was independent of lobe, age and gender. These results concur with the findings of Takahashi et al [7] who found a mean SWV of 1.12 m s−1 with a range of 0.81–1.32 in their healthy young control group (n = 25). In contrast, Gallotti et al [6] found a higher SWV in healthy young livers (n = 35) at 1.59 m s−1 with a wider range (0.76–3.43). It could be suggested that the low SD of normal liver SWVs in this study reflects a selection bias. However, owing to the number of patients, their age distribution, the varied population and the strict exclusion criteria, such a bias is less probable.
Conventional ultrasound is unable to distinguish between haemangiomata and metastases. Adding SWV measurements may greatly improve discriminating power. Using ARFI, the SWV values were 1.35±0.48 m s−1 for haemangiomata and 4.18±0.71 m s−1 for metastases.
In our sample, the difference in SWV between haemangiomata and metastases is more pronounced than observed by Cho et al [14] who found SWVs of 1.51±0.71 and 2.18±0.96 m s−1 for haemangiomata (n = 17) and metastases (n = 18), respectively.
In addition, they found an SWV of 2.45±0.81 m s−1 in hepatocellular carcinomas (HCC). With a cut-off point of 2 m s−1, they arrived at a sensitivity of 74% and a specificity of 82% for malignancy. Test characteristics for benignity were not given. The more pronounced difference in SWV between haemangiomata and metastases in the current study might possibly be due to a different population sample. We saw no patients with HCC, but the results of Cho et al showing a higher SWV in HCCs support our findings.
A limitation of this pilot study is the small number of patients with malignant lesions. Most metastases are multiple, but we concentrated on lesions mimicking haemangiomata which were mostly solitary. We also included three haemangiomata that were smaller than the measuring box for SWV. However, stable readings were acquired. Although ARFI elastography (using currently available technology) is not able to reach every hepatic lesion, our experience is that over 90% of lesions can be adequately measured using the appropriate acoustic window.
There were no patients with adenomata or focal nodular hyperplasia to include in the benign lesion sample. A prospective study is being performed to include all types of both benign and malignant lesions.
Conclusion
ARFI elastography measurements, presented as SWV, are promising in distinguishing haemangiomata from metastases. This fast, safe and cost-effective method may significantly decrease the need for more invasive alternatives when faced with potentially benign hepatic lesions.
References
- 1.Ophir J, Céspedes I, Ponnekanti H, Yazdi Y, Li X. Elastography: a quantitative method for imaging the elasticity of biological tissues. Ultrason Imaging 1991;13:111–34 [DOI] [PubMed] [Google Scholar]
- 2.Foucher J, Chanteloup E, Vergniol J, Castéra L, Bail BL, Adhoute X, et al. Diagnosis of cirrhosis by transient elastography (FibroScan): a prospective study. Gut 2006;55:403–8 [DOI] [PMC free article] [PubMed] [Google Scholar]
- 3.Frey H. Realtime elastography. A new ultrasound procedure for the reconstruction of tissue elasticity. Radiologe 2003;43:850–5 [DOI] [PubMed] [Google Scholar]
- 4.Nightingale K, McAleavey S, Trahey G. Shear-wave generation using acoustic radiation force: in vivo and ex vivo results. Ultrasound Med Biol 2003;29:1715–23 [DOI] [PubMed] [Google Scholar]
- 5.Fahey BJ, Nelson RC, Bradway DP, Hsu SJ, Dumont DM, Trahey GE. In vivo visualization of abdominal malignancies with acoustic radiation force elastography. Phys Med Biol 2008;53:279–93 [DOI] [PMC free article] [PubMed] [Google Scholar]
- 6.Gallotti A, D'Onofrio M, Mucelli RP. Acoustic radiation force impulse (ARFI) technique in ultrasound with Virtual Touch tissue quantification of the upper abdomen. Radiol Med 2010;115:889–97 [DOI] [PubMed] [Google Scholar]
- 7.Takahashi H, Ono N, Eguchi Y, Eguchi T, Kitajima Y, Kawaguchi Y, et al. Evaluation of acoustic radiation force impulse elastography for fibrosis staging of chronic liver disease: a pilot study. Liver Int 2009;30:538–45 [DOI] [PubMed] [Google Scholar]
- 8.D'Ippolito G, Appezzato LF, Ribeiro ACR, Abreu Junior L, Borri ML, Galvão Filho MM, et al. Unusual presentations of hepatic hemangioma: an iconographic essay. Radiologia Brasileira 2006;39:219–25 [Google Scholar]
- 9.Kim SH, Lee JM, Lee JY, Han JK, An SK, Han CJ, et al. Value of contrast-enhanced sonography for the characterization of focal hepatic lesions in patients with diffuse liver disease: receiver operating characteristic analysis. AJR Am J Roentgenol 2005;184:1077–84 [DOI] [PubMed] [Google Scholar]
- 10.Quillin SP, Atilla S, Brown JJ, Borrello JA, Yu CY, Pilgram TK. Characterization of focal hepatic masses by dynamic contrast-enhanced MR imaging: findings in 311 lesions. Magn Reson Imaging 1997;15:275–85 [DOI] [PubMed] [Google Scholar]
- 11.Jones EC, Chezmar JL, Nelson RC, Bernardino ME. The frequency and significance of small (less than or equal to 15 mm) hepatic lesions detected by CT. AJR Am J Roentgenol 1992;158:535–9 [DOI] [PubMed] [Google Scholar]
- 12.McFarland EG, Mayo-Smith WW, Saini S, Hahn PF, Goldberg MA, Lee MJ. Hepatic hemangiomas and malignant tumours: improved differentiation with heavily T2-weighted conventional spin-echo MR imaging. Radiology 1994;193:43–7 [DOI] [PubMed] [Google Scholar]
- 13.DeLong ER, DeLong DM, Clarke-Pearson DL. Comparing the areas under two or more correlated receiver operating characteristic curves: a nonparametric approach. Biometrics 1988;44:837–45 [PubMed] [Google Scholar]
- 14.Cho SH, Lee JY, Han JK, Choi BI. Acoustic radiation force impulse elastography for the evaluation of focal solid hepatic lesions: preliminary findings. Ultrasound Med Biol 2010;36:202–8 [DOI] [PubMed] [Google Scholar]


