

Abstract
Objective
This study aimed to quantify intratumoural viable tissue perfusion with contrast-enhanced greyscale ultrasound to evaluate tumour response to anti-angiogenic treatment.
Methods
H22 hepatoma-bearing mice were treated with low-dose thalidomide (Group B), high-dose thalidomide (Group C) or 0.5% carboxylmethylcellulose (Group A). Contrast-enhanced greyscale ultrasound was performed after 7 days of treatments to evaluate the percentage of non-enhanced area for each tumour; regions of interest within the enhanced area were analysed offline to determine the area under the curve (AUC), maximum intensity (IMAX), perfusion index (PI), mean transit time (MTT), time to peak (TTP) and quality of fit (QOF). Immunohistochemical analysis was performed for evaluation of microvascular density (MVD).
Results
The percentage of non-enhanced area was significantly larger in Group C than in Groups A and B (p<0.05); however, there was no significant difference between Groups A and B. Treatment with thalidomide resulted in a significant decrease in AUC, PI and IMAX compared with Group A (p<0.05). Immunohistochemistry showed significant decreases in MVD in Groups B and C compared with Group A (p<0.05); however, there was no significant difference in MVD between Groups B and C. MVD was positively correlated with IMAX (r = 0.419, p = 0.023) and PI (r = 0.455, p = 0.013).
Conclusion
Quantitatively analysing intratumoural viable tissue perfusion enables early evaluation of tumour response to anti-angiogenic therapy before apparent changes in tumour necrosis.
Angiogenesis is required for solid tumours to expand in size beyond approximately 1.0–2.0 mm in diameter [1]. Anti-angiogenic agents are, therefore, of major interest as therapeutics for cancer treatment. In contrast to cytotoxic agents, anti-angiogenic agents do not act directly on tumour cells but on the endothelial cells, which may restrict tumour microvasculature without a clinically apparent change in tumour size [2]. The morphological measurements of the tumour size in medical images, therefore, may not be the most appropriate end point for evaluating anti-angiogenic agents [3].
Immunohistological analysis of the mean intratumoural microvascular density (MVD) is the most commonly used method for assessing angiogenesis, but is also the most invasive procedure. An additional limitation of this approach is that it does not provide information on the effective perfusion through the vessel. Moreover, it reflects only a single point in time and cannot be used as a way of monitoring in vivo changes induced by anti-angiogenic therapy. Therefore, although MVD is a potentially useful marker for assessing tumour angiogenesis, determination of changes in MVD may not be an appropriate indicator to evaluate anti-angiogenic therapy [2].
Anti-angiogenic agents are designed to affect the abnormal blood vessels found in tumours, therefore a change in tumour perfusion may be a promising biomarker that heralds a positive clinical response to therapy. Several non-invasive image modalities are being investigated to monitor tumour response to anti-angiogenic treatment, including dynamic contrast-enhanced MRI, CT, positron emission tomography (PET) and ultrasound [4,5]. Ultrasound is an attractive modality for imaging tumour vasculature because of the ease with which it can be repeated without exposing the patient or animal to any risk. Conventional and contrast-enhanced power Doppler can detect reductions in larger tumour vessels during anti-angiogenic therapy [6]. However, even with the use of contrast agents, power Doppler is not capable of visualising capillary blood flow [7], an essential pre-condition for quantifying tissue perfusion. Contrast pulse sequence imaging (CPS) is a recently introduced contrast-enhanced ultrasound imaging technology with excellent agent-to-tissue specificity at a very low mechanical index (MI). With the use of CPS, capillary blood flow can be visualised in real time, which makes it possible to discriminate viable tissue from necrotic tissue, and intratumoural viable tissue perfusion parameters can be calculated combined with time–intensity curves.
Thalidomide is a typical old drug with a new use and has been shown to inhibit angiogenesis [8]. Although the exact molecular mechanism of anti-angiogenesis elicited by thalidomide is not clear and some of its side effects may be serious, it is still extensively investigated in clinical practice for palliative treatment of advanced cancers since a significant effect on angiogenesis and tumour growth has been demonstrated in more and more animal and clinical trials [9]. The present study was designed to quantify intratumoural viable tissue perfusion with contrast-enhanced greyscale ultrasound to evaluate tumour response to different doses of thalidomide in a mouse hepatoma H22 model.
Methods and materials
Animal model
All experiments were approved by the institutional animal care committee of Sun Yat-Sen University and performed under the guidelines of the National Institutes of Health for the care of laboratory animals. A highly malignant mice hepatoma cell line (H22) was used. Tumours were established by subcutaneous injection of 2 × 10⁶ H22 cells at the right axillary fossa of 30 Kun-Ming mice weighing 16–18 g.
After 24 h of tumour implantation, 30 mice were randomly divided into 3 groups with Group A (n = 10) as control and Groups B and C (n = 10 in each) as treatment groups. Thalidomide (Changzhou Pharmaceuticals, Jiangsu, China) suspended in 0.5% carboxylmethylcellulose (CMC) was administered by intraperitoneal (IP) injection once daily at a dose of 100 mg kg–1 for Group B and 200 mg kg–1 for Group C. Mice in Group A were administered 0.5% CMC at the same dosage.
Ultrasound imaging protocol
Mice were weighed before treatment and before ultrasound examination. Ultrasound imaging was performed on day 7 after initiation of therapy. For the ultrasound imaging studies, each mouse was anaesthetised by IP injection of pentobarbital sodium (75 mg kg–1, Sigma, St Louis, MO). The hair over the imaging site was shaved and ultrasound imaging coupling a gel and a stand-off gel pad were placed between the skin surface and transducer. Of the 30 mice, 1 in Group A died during examination, possibly owing to overdose of pentobarbital sodium, and was excluded from analysis. Ultrasound images of tumours were obtained from anaesthetised animals using an Acuson Sequoia 512 (Siemens, Mountain View, CA) ultrasound equipment. The small size of our study animals required the use of a 15 L8 linear array transducer (7.0–14.0 MHz) (Siemens). All ultrasound examinations were performed by one investigator, who was blind to the treatment status. The contrast pulse sequence imaging mode was used for evaluation of tumour perfusion (mechanical index, 0.25; frame rate, 5 Hz; dynamic range, 80 dB; depth, 3 cm). Settings were adjusted at the beginning and maintained constant during the experiments.
Before contrast agent injection, the greatest longitudinal, transverse and anteroposterior dimensions of tumours were measured in fundamental B-mode imaging using callipers. Tumour volume was calculated using the formula for a prolate ellipsoid: volume = π/6 × length × width × depth. The largest tumour cross-section plane was used for the examination of contrast-enhanced greyscale ultrasound, and the transducer was held in this position throughout the examination. A second-generation ultrasound contrast agent (SonoVue, Bracco, Italy), containing sulphur hexafluoride phospholipid-stabilised microbubbles, was used for this study. SonoVue was dissolved with physiological saline to 5 ml and administered as a bolus (0.1 ml per 20 g) into the retro-orbital vein using a 27-gauge needle. To minimise variations in the injection rate, the bolus injection was systematically performed as a brief injection by the same operator. Imaging was recorded on cine clips starting immediately after injection and continuing for 60 s.
Imaging analysis
Necrosis was developed in control and treated tumours because of anti-angiogenic therapy and the rapid growth of the tumour, which meant the percentage of non-enhanced area was used to determine the difference in tumour necrosis among the three groups. The clips were reviewed for the measurement of the percentage of non-enhanced area in the tumour region using the Acuson Sequoia 512 ultrasound equipment. The images at the time of peak enhancement when tumour vessels were completely filled by contrast agent (approximately 8 s after contrast agent injection) were used to measure the area of the largest cross-section and non-enhanced area of each tumour. The percentage of non-enhanced area from ultrasound images was calculated by dividing the area of the largest cross-section by the area of non-enhancement.
The clips were downloaded as digital imaging and communications in medicine (DICOM) format for offline processing with the use of SonoLiver software (TomTec Imaging Systems, German) using a bolus kinetic model (Figure 1). A region of interest (ROI) was drawn along the perimeter of each tumour and free from any non-enhanced area; the ROI was automatically positioned by the software over all implants on subsequent images, with minor adjustments to correct for respiratory motion when necessary. In each ROI, the mean video intensity induced by contrast uptake was calculated for each image and was expressed in arbitrary units. The time–intensity curve for each imaging protocol was plotted and a mathematical equation model was used to fit the contrast uptake time–intensity curve [10]. The perfusion parameters calculated from the fitted model were area under the curve (AUC), maximum intensity (IMAX), perfusion index (PI), mean transit time (MTT), time to peak (TTP) and quality of fit (QOF). The AUC was defined as the area under curve to infinite time. The IMAX was defined as the maximum increase in the signal intensity produced by the injection of the contrast agent. The TTP was defined as the time interval from the beginning of enhancement to the peak of the fitted curve. The MTT was defined as the average time required for the contrast agent to pass through the ROI. PI was defined as AUC divided by MTT. The QOF was used to test the quality of fit between raw data and the fitted mathematical model.
Figure 1.

(a) Transverse ultrasound images of an H22 tumour (arrow) obtained at peak enhancement after contrast agent injection. (b) Representative example of placement of a region of interest (ROI) (green line) drawn along the perimeter of each tumour and free from non-enhanced area. The region of blue line is a delimitative region used for motion compensation.
Histology analysis
After ultrasound imaging, mice were killed and tumours were removed and fixed in 10% formalin. Tumour tissue sections equivalent to the ultrasound imaging plane were prepared for immunohistochemical evaluation of endothelial cell (CD34) density. The antigen retrieval procedure using citrate acid (pH 6.0) was performed. Primary antibody incubation was performed using a rat anti-mouse CD34 antibody (clone MEC14.7, Abcam, Cambridge, UK) at 1:200 dilution overnight at 4°C. After rinsing with phosphate-buffered saline (PBS), a secondary rabbit anti-rat antibody (Zhongshan Goldenbridge Biology, Beijing, China) was added, as was diaminobenzidine (DAB) for colour development.
The MVD was assessed in vascular “hot spots” (areas of greatest CD34-positive density) according to Weidner et al [11]. Hot spots were located by scanning the stained tumour sections at a magnification of ×40. After identification of the hot spots, three fields of hot spots were randomly chosen and the number of individual brown-staining cells were counted at a magnification of ×400. Using light microscopy CD34 counts for each tumour section were quantitated independently by two observers who were blinded to the tumour treatment status. The average of the two observers' results was used for statistical analysis.
Statistical analysis
All analyses were performed by SPSS software SPSS version 13.0 (SPSS, Inc, Chicago, IL). The Kolmogorov–Smirnova test was applied to evaluate normal distribution and the Levene test for evaluation of homogeneity of variance. One-way analysis of variance (ANOVA) was used to determine the significant differences in body weight, tumour volume, percentage of non-enhanced area, perfusion parameters and MVD among the three groups. Confirming that there were significant differences among groups, post hoc least significant difference (LSD) tests were performed. The Pearson correlation test was used to evaluate the relationship between the mean perfusion parameters and MVD. A p-value <0.05 was considered statistically significant.
Results
Tumour growth
The mean body weight of mice in Group A, Group B and Group C before treatment was 16.78±0.83 g, 17.10±0.88 g, 16.80±0.79 g, respectively. There was no significant difference in mouse body weight among the three groups before treatment (p = 0.638). Results of the body weight of mice and tumour volume after treatment are summarised in Table 1.
Table 1. Comparison of body weigh and tumour volume after treatment.
| Group A (n = 9) | Group B (n = 10) | Group C (n = 10) | pa | pb | |
| Body weight (g) | 27.11±2.71 | 23.90±3.28 | 22.70±1.77 | 0.014 | 0.001 |
| Tumour volume (cm3) | 0.69±0.23 | 0.18±0.06 | 0.18±0.09 | <0.001 | <0.001 |
Data are presented as means ± standard deviation.
No significant difference was found between Group B and Group C for body weight and tumour volume (p>0.05).
aComparison between Group B and Group A.
bComparison between Group C and Group A. No significant difference was found between Group B and Group C for body weight and tumour volume (p>0.05).
Tumour necrosis
Non-enhanced region visible in contrast-enhanced greyscale ultrasound was developed in some of the treated tumours and control tumours 8 days after implantation. The percentage of non-enhanced area determined by contrast-enhanced ultrasound in Group A, Group B and Group C was 3.47±5.70%, 4.58±5.55% and 11.76±8.29%, respectively. Treatment with high-dose thalidomide (Group C) developed a significantly larger percentage of non-enhanced area than low-dose thalidomide (Group B) and the control group (p = 0.023 and p = 0.012, respectively). However, no significant difference was found between Group B and Group A in the percentage of non-enhanced area (p = 0.721).
Quantitative analysis of contrast-enhanced ultrasound imaging
Results of the perfusion parameters for the three groups are summarised in Tables 2 and 3 (Figure 2). The raw data of bolus kinetics were well fitted to the mathematical model that the software of SonoLiver uses. The mean QOF of the 3 groups was 88.82±5.55% and there was no significant difference in QOF among the 3 groups (p = 0.064).
Table 2. Comparison of perfusion parameters after treatment.
| Group A (n = 9) | Group B (n = 10) | Group C (n = 10) | p of ANOVA | |
| AUC (a.u.) | 9590.33±5372.34 | 4689.35±2428.39 | 5384.69±2309.38 | 0.025 |
| MTT (s) | 175.22±80.08 | 181.78±100.33 | 224.29±91.35 | 0.448 |
| PI (a.u. s–1) | 54.81±17.81 | 32.03±21.45 | 25.33±14.66 | 0.004 |
| TTP (s) | 10.98±2.77 | 9.23±3.33 | 11.31±4.35 | 0.392 |
| IMAX (a.u.) | 100.19±36.57 | 57.52±23.13 | 50.50±25.51 | 0.002 |
| QOF (%) | 90.23±4.10 | 90.81±4.72 | 85.56±6.35 | 0.064 |
Data are presented as means ± standard deviations.
ANOVA, analysis of variance; AUC, area under the curve; MTT, mean transit time; PI, perfusion index; TTP, mean transit time; IMAX, maximum intensity; QOF, quality of fit.
Table 3. p-values of multiple comparisons used post hoc LSD test in perfusion parameters.
| AUC | PI | IMAX | |
| Group A vs Group B | 0.011 | 0.011 | 0.003 |
| Group A vs Group C | 0.029 | 0.002 | 0.001 |
| Group B vs Group C | 0.661 | 0.418 | 0.589 |
AUC, area under the curve; PI, perfusion index; IMAX, maximum intensity.
Figure 2.
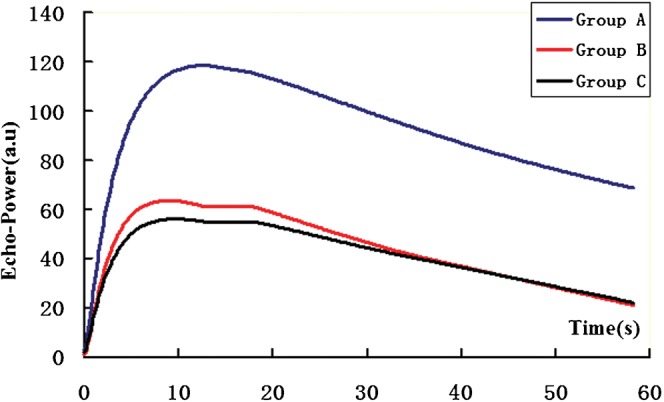
Representative time–intensity curves for each group. Group A, control tumours; Group B, tumours treated with low dose (100 mg kg–1) thalidomide; Group C, tumours treated with high-dose (200 mg kg–1) thalidomide.
Immunohistochemical results
The MVD determined by immunohistochemical evaluation of endothelial cell (CD34) density in Group A, Group B and Group C was 38.06±4.27 counts per high-power field (HPF), 23.55±10.53 counts per HPF and 17.24±12.67 counts per HPF, respectively. One-way ANOVA showed significant differences in MVD in the three groups (p<0.001). Tumours treated with thalidomide (Groups B and C) were associated with a significant decrease in MVD compared with control tumours (Group A) (p = 0.001 and p<0.001, respectively). No significant difference was observed in MVD between Groups B and C (p = 0.334) (Figure 3).
Figure 3.

(a) The graph shows the mean microvascular density (MVD) of each group. *p<0.05, tumours of Groups B and C had significant decreases in MVD compared with that of Group A. Representative photomicrographs of immunohistochemical stained sections of tumours from (b) Group A, (c) Group B and (d) Group C. Group A, control tumours; Group B, tumours treated with low-dose (100 mg kg–1) thalidomide; Group C, tumours treated with high-dose (200 mg kg–1) thalidomide. (CD34, original magnification, ×400).
Correlation of perfusion parameters and immunohistochemical results
For the entire cohort (treated and untreated tumours), MVD positively correlated with IMAX (r = 0.419, p = 0.023) and PI (r = 0.455, p = 0.013) (Figure 4). There was no significant correlation between MVD and either AUC or MTT or TTP.
Figure 4.

Scatter plots show correlation between microvascular density (MVD) and (a) maximum intensity (IMAX) (r = 0.419, p = 0.023) and (b) perfusion index (PI) (r = 0.455, p = 0.013). HPF, high-power field.
Discussion
This study evaluated quantitative intratumoural viable tissue perfusion with contrast-enhanced greyscale ultrasound to assess tumour response to treatment with different doses of thalidomide. The perfusion parameters of AUC, PI and IMAX were significantly decreased after treatment compared with control tumours. At the same time, PI and IMAX positively correlated with MVD.
In this study, CPS was used for contrast-enhanced greyscale ultrasound. CPS provides better tissue penetration, less attenuation and improved tissue subtraction than previous ultrasound perfusion imaging techniques [12]. With the use of CPS, tissue capillary blood flow can be visualised in real time, which makes it easy to discriminate viable tissue from necrotic tissue [13], and the region of interest (ROI) could be drawn along the perimeter of each tumour and free from any necrotic areas. Therefore, the perfusion parameters extracted from each ROI could truly reflect viable tissue blood perfusion of each tumour. In this study, we found that the perfusion parameters of AUC, PI and IMAX were significantly decreased after treatment (both low-dose and high-dose thalidomide) compared with control tumours. Previous studies have used dynamic contrast-enhanced ultrasound to quantify tumour perfusion parameters for assessing tumour angiogenesis and response to anti-angiogenic therapy [14,15]. Changes in tumour perfusion parameters have been shown to correlate with response to therapy and could evaluate tumour vasculature disrupting effects of anti-angiogenic therapy early [16]. However, the tumour perfusion parameters of these studies, which were calculated from an entire tumour ROI including necrotic and viable tumour tissue, may not accurately evaluate the tumour blood perfusion because there was no blood perfusion in the area of necrosis. This may be one of the reasons that some investigators have demonstrated a correlation between contrast-enhanced ultrasound estimates of tumour perfusion and histological measurements of angiogenesis whereas other investigators have not [6,14].
Anti-angiogenic agents work by typically preventing the development of new blood vessels needed to support tumour growth. For this reason, previous studies have tried to assess the reduction in tumour vascularisation or the increase in tumour necrosis to monitor tumour response to anti-angiogenic therapy using contrast-enhanced Doppler ultrasound or contrast-enhanced greyscale ultrasound [13,17]. A decrease in contrast agent uptake or colour pixel density of the entire tumour region has been correlated with tumour response to treatment. However, this may not be a sensitive marker to assess tumour response to anti-angiogenic agents because tumour necrosis is a late sign of the reduction of tumour blood perfusion and may take several days to occur. In this study, although there was no significant difference in the percentage of non-enhanced area between tumours treated with low-dose thalidomide (Group B) and control tumours (Group A), tumours treated with low-dose thalidomide resulted in a significant decrease in perfusion parameters of AUC, PI and IMAX compared with control tumours. Therefore, quantitative evaluation of viable tissue perfusion provides a tool to monitor anti-angiogenic treatment early, before apparent changes in tumour necrosis.
In light of the generally accepted importance of angiogenesis for tumour growth and progression and the increasing number of anti-angiogenic therapy protocols, other imaging strategies including contrast-enhanced MRI and contrast-enhanced CT have been used to evaluate cancer-induced angiogenesis and the anti-angiogenic therapeutic effect. However, mixed results in MTT changes were found between our study and previous studies using contrast-enhanced CT [18]. Studies using contrast-enhanced CT found that tumour treatment with anti-angiogenic agents induced a significant increase in MTT; however, our study found that there was no significant difference in MTT between treated tumours and control tumours. This may due to the different kinds of contrast agents used in CT and ultrasound. Being small molecules, the iodinated CT contrast agents can leak out of vascular areas into interstitium after injection into intravascular areas [19]. Therefore, the MTT calculated from contrast-enhanced CT is a measure of tumour interstitial pressure and vessel leakiness and was found to be significantly lower in malignant tumours than in benign tissues [20]. Emerging evidence suggests that anti-angiogenic therapy can prune some tumour vessels and normalise the structure and function of the rest [21], so the MTT of CT using iodinated agents as tracer will increase after effective treatment with anti-angiogenic agents. However, microbubbles are true intravascular contrast agents [22] and will not leak out of vascular areas into interstitium, so the MTT calculated from contrast-enhanced ultrasound is a measure of flow rate [23] and may have no relationship with anti-angiogenic therapy.
This study showed weak correlation between perfusion parameters and MVD; however, this may truly reflect the correlation between functional imaging parameters and MVD [4,14]. The following reasons may contribute to this. First, the MVD of a sample tissue is assessed histologically by counting the number of small blood vessels in a microscopic field that are similar in size to a single dot of ultrasound images and does not reflect the variation in distribution of blood vessels in a whole tumour. Second, the number of vessels does not take into account capillary size, which is abnormal in angiogenic tumour vasculature. Third, MVD does not take into account vascular function: both functional blood vessels and single endothelial cells are included in the MVD [24]. Moreover, besides the well-studied angiogenesis, recent studies have revealed another two kinds of new blood perfusion patterns by which tumour tissues nourish themselves, including mosaic vessels, which are vessels composed of both endothelium and tumour cells [25], and vasculogenic mimicry, which are vessels lined exclusively with tumour cells mimicking the presence and function of endothelial cells [26].
Conclusion
This study indicates that quantitative intratumoural viable tissue perfusion with contrast-enhanced greyscale ultrasound is a promising method to measure several valuable perfusion parameters during the early stages of anti-angiogenic therapy, which are superior to static measurements such as tumour necrosis. As more and more anti-angiogenic agents have entered clinical development, quantitative intratumoural viable tissue perfusion with contrast-enhanced greyscale ultrasound provides a simple and valuable way to early evaluate the therapeutics effect for these agents.
Acknowledgments
This work was supported by the National Natural Science Foundation of China (No. 30900369).
Footnotes
*P H Wu and A H Li contributed equally to this article.
References
- 1.Folkman J. Tumor angiogenesis: therapeutic implications. N Engl J Med 1971;285:1182–6 [DOI] [PubMed] [Google Scholar]
- 2.Hlatky L, Hahnfeldt P, Folkman J. Clinical application of antiangiogenic therapy: microvessel density, what it does and doesn't tell us. J Natl Cancer Inst 2002;94:883–93 [DOI] [PubMed] [Google Scholar]
- 3.Lassau N, Chebil M, Chami L, Roche A. A new functional imaging technique for the early functional evaluation of antiangiogenic treatment: dynamic contrast-enhanced ultrasonography (DCE-US). Targ Oncol 2008;3:111–17 [DOI] [PubMed] [Google Scholar]
- 4.Miller JC, Pien HH, Sahani D, Sorensen AG, Thrall JH. Imaging angiogenesis: applications and potential for drug development. J Natl Cancer Inst 2005;97:172–87 [DOI] [PubMed] [Google Scholar]
- 5.Provenzale JM. Imaging of angiogenesis: clinical techniques and novel imaging methods. AJR Am J Roentgenol 2007;188:11–23 [DOI] [PubMed] [Google Scholar]
- 6.Iordanescu I, Becker C, Zetter B, Dunning P, Taylor GA. Tumor vascularity: Evaluation in a murine model with contrast enhanced color Doppler US-effect of angiogenesis inhibitors. Radiology 2002;222:460–7 [DOI] [PubMed] [Google Scholar]
- 7.Delorme S, Peschke P, Zuna I, van Kaick G. Imaging the smallest tumor vessels using color Doppler ultrasound in an experiment. Radiologe 2001;41:168–72 [DOI] [PubMed] [Google Scholar]
- 8.Kenyon BM, Browne F, D'Amato RJ. Effects of thalidomide and related metabolites in a mouse corneal model of neovascularization. Exp Eye Res 1997;64:971–8 [DOI] [PubMed] [Google Scholar]
- 9.Singhal S, Mehta J. Thalidomide in cancer. Biomed Pharmacother 2002;56:4–12 [DOI] [PubMed] [Google Scholar]
- 10.Rognin NG, Frinking P, Messager T, Arditi M, Perrenoud G, Meuwly JY. A new method for enhancing dynamic vascular patterns of focal liver lesions in contrast ultrasound. Proc IEEE Ultrason Symp 2007:546–9 [Google Scholar]
- 11.Weidner N, Semple JP, Welch WR, Folkman J. Tumor angiogenesis and metastasis: correlation in invasive breast carcinoma. N Engl J Med 1991;324:1–8 [DOI] [PubMed] [Google Scholar]
- 12.Phillips P, Gardner E. Contrast-agent detection and quantification. Eur Radiol 2004;14:4–10 [PubMed] [Google Scholar]
- 13.Zhou J, Zheng W, Cao L, Liu M, Han F, Li A. Antiangiogenic tumor treatment noninvasive monitoring with contrast pulse sequence imaging for contrast-enhanced grayscale ultrasound. Acad Radiol 2010;17:646–51 [DOI] [PubMed] [Google Scholar]
- 14.McCarville MB, Streck CJ, Dickson PV, Li CS, Nathwani AC, Davidoff AM. Angiogenesis inhibitors in a murine neuroblastoma model: quantitative assessment of intratumoral blood flow with contrast-enhanced gray-scale US. Radiology 2006;240:73–81 [DOI] [PubMed] [Google Scholar]
- 15.Bertolotto M, Pozzato G, Crocè LS, Nascimben F, Gasparini C, Cova MA, et al. Blood flow changes in hepatocellular carcinoma after the administration of thalidomide assessed by reperfusion kinetics during microbubble infusion: preliminary results. Invest Radiol 2006;41:15–21 [DOI] [PubMed] [Google Scholar]
- 16.Lavisse S, Lejeune P, Rouffiac V, Elie N, Bribes E, Demers B, et al. Early quantitative evaluation of a tumor vasculature disruptive agent AVE8062 using dynamic contrast-enhanced ultrasonography. Invest Radiol 2008;43:100–11 [DOI] [PubMed] [Google Scholar]
- 17.De Giorgi U, Aliberti C, Benea G, Conti M, Marangolo M. Effect of angiosonography to monitor response during imatinib treatment in patients with metastatic gastrointestinal stromal tumors. Clin Cancer Res 2005;11:6171–6 [DOI] [PubMed] [Google Scholar]
- 18.Zhu AX, Holalkere NS, Muzikansky A, Horgan K, Sahani DV. Early antiangiogenic activity of bevacizumab evaluated by computed tomography perfusion scan in patients with advanced hepatocellular carcinoma. Oncologist 2008;13:120–5 [DOI] [PubMed] [Google Scholar]
- 19.Dawson P. Functional imaging in CT. Eur J Radiol 2006;60:331–40 [DOI] [PubMed] [Google Scholar]
- 20.Rumboldt Z, Al-Okaili R, Deveikis JP. Perfusion CT for head and neck tumors: Pilot study. AJNR Am J Neuroradiol 2005;26:1178–85 [PMC free article] [PubMed] [Google Scholar]
- 21.Jain RK. Normalization of tumor vasculature: an emerging concept in antiangiogenic therapy. Science 2005;307:58–62 [DOI] [PubMed] [Google Scholar]
- 22.Ferrara KW, Merritt CR, Burns PN, Foster FS, Mattrey RF, Wickline SA. Evaluation of tumor angiogenesis with US: imaging, Doppler, and contrast agents. Acad Radiol 2000;7:824–39 [DOI] [PubMed] [Google Scholar]
- 23.Cosgrove D, Eclersley R, Blomley M, Harvey C. Quantification of blood flow. Eur Radiol 2001;11:1338–44 [DOI] [PubMed] [Google Scholar]
- 24.Tozer GM. Measuring tumour vascular response to antivascular and antiangiogenic drugs. Br J Radiol 2003;76:S23–35 [DOI] [PubMed] [Google Scholar]
- 25.Shirakawa K, Kobayashi H, Heike Y, Kawamoto S, Brechbiel MW, Kasumi F, et al. Hemodynamics in vasculogenic mimicry and angiogenesis of inflammatory breast cancer xenograft. Cancer Res 2002;62:560–6 [PubMed] [Google Scholar]
- 26.Folberg R, Maniotis AJ. Vasculogenic mimicry. APMIS 2004;112:508–25 [DOI] [PubMed] [Google Scholar]