Abstract
Objectives
The aim of this study was to determine occupational dose levels in interventional radiology and cardiology procedures.
Methods
The study covered a sample of 25 procedures and monitored occupational dose for all laboratory personnel. Each individual wore eight thermoluminescent dosemeters next to the eyes, wrists, fingers and legs during each procedure. Radiation protection shields used in each procedure were recorded.
Results
The highest doses per procedure were recorded for interventionists at the left wrist (average 485 μSv, maximum 5239 μSv) and left finger (average 324 μSv, maximum 2877 μSv), whereas lower doses were recorded for the legs (average 124 μSv, maximum 1959 μSv) and the eyes (average 64 μSv, maximum 1129 μSv). Doses to the assisting nurses during the intervention were considerably lower; the highest doses were recorded at the wrists (average 26 μSv, maximum 41 μSv) and legs (average 18 μSv, maximum 22 μSv), whereas doses to the eyes were minimal (average 4 μSv, maximum 16 μSv). Occupational doses normalised to kerma area product (KAP) ranged from 11.9 to 117.3 μSv/1000 cGy cm2 and KAP was poorly correlated to the interventionists' extremity doses.
Conclusion
Calculation of the dose burden for interventionists considering the actual number of procedures performed annually revealed that dose limits for the extremities and the lenses of the eyes were not exceeded. However, there are cases in which high doses have been recorded and this can lead to exceeding the dose limits when bad practices are followed and the radiation protection tools are not properly used.
The rapid development of imaging technology has contributed to the growth of interventional radiology (IR) in recent years [1]. Continuing advances in digital imaging have enabled new and complex operations to be implemented, such as vascular and hepatobiliary interventional procedures, that were seldom performed in the past. Improvements in catheters, guidewires and stents have contributed to worldwide popularity and expansion of IR [2, 3]. Similarly, the number of interventional cardiology (IC) procedures over the last 10 years has also increased rapidly [4]. The main reason is that IC permits specialists to avoid complicated invasive surgery, which some patients might not tolerate because of age factors or pathology, and this results in a reduced length of hospital stay in comparison with coronary artery bypass grafting [5]. However, interventional procedures can involve long fluoroscopic times, cine acquisitions and operation of fluoroscopic equipment in high-dose fluoroscopic modes, which can lead to high patient and staff doses [6, 7]. Interventional procedures require the physician and assisting personnel to remain close to the patient, which is the main source of scattered radiation. Interventionists can also be subjected to primary irradiation if, because of bad practice, their hands enter the primary X-ray beam. Doses to physicians' lower extremities, which are closest to the X-ray tube, can also be substantial. More importantly, doses to the eyes are of particular concern when protective eyeglasses are not worn since the lens of the eye is particularly sensitive to radiation. Although the main part of the body can be individually shielded by a protective apron, the hands and legs remain almost unshielded. Thus, it is important to ensure that, for these exposed parts, the annual dose limits are not exceeded.
The purpose of the present study was to determine doses to personnel in IR and IC during various diagnostic and therapeutic procedures. The study concentrated on doses to the extremities and the lens of the eye for all laboratory personnel and investigated the correlation between kerma area product (KAP) and personnel doses.
Methods and materials
The study included 25 cases of common diagnostic and therapeutic interventions that were performed at the University Hospital of Athens (Attikon) during the period October 2008–January 2009 (Table 1). All procedures were performed on monoplane angiography units (GE Advantix, GE Medical Systems, Milwaukee, WI). The cardiology department is equipped with two angiographic units, and the radiology department with one unit. For each procedure, the KAP provided by the built-in KAP meter of the angiographic unit was recorded in order to associate it subsequently with doses to physicians. The personal protective means used (aprons, collars, eyeglasses, gloves) and laboratory protective shields (table lead curtain, ceiling-suspended lead screen, mobile floor screen) were recorded for each procedure. An illustration of the various protective shields used in the catheterisation laboratory is shown in Figure 1. The position of each individual in the catheterisation laboratory with respect to the fluoroscopic table was also recorded for each procedure.
Table 1. Type and number of recorded procedures. Range of kerma area product (KAP) and the usage or radiation protection measures per procedure are also shown.
| Usage of radiation protection measures |
|||||||||
| No. of cases | KAP range (cGy cm2) | Apron (%) | Collar (%) | Glasses (%) | Gloves (%) | Table curtain (%) | Ceiling shield (%) | Floor shield (%) | |
| Cardiac procedures | |||||||||
| Coronary angiography | 6 | 1087–4534 | 100 | 100 | 83 | 0 | 100 | 100 | 17 |
| Pacemaker implantation | 1 | 4205 | 100 | 100 | 0 | 0 | 100 | 100 | 0 |
| Total | 7 | 100 | 100 | 71 | 0 | 100 | 100 | 14 | |
| Radiology procedures | |||||||||
| Nephrostomy | 1 | 2719 | 100 | 100 | 0 | 0 | 100 | 100 | 0 |
| Phlebography | 1 | 9773 | 100 | 100 | 100 | 0 | 100 | 100 | 100 |
| Embolism | 2 | 828–31 594 | 100 | 100 | 100 | 0 | 100 | 100 | 100 |
| Cholangiography | 1 | 7101 | 100 | 100 | 0 | 0 | 100 | 100 | 0 |
| Carotid artery angioplasty | 2 | 7415–7640 | 100 | 100 | 100 | 0 | 100 | 100 | 100 |
| Left subclavian artery angioplasty | 1 | 13405 | 100 | 100 | 100 | 0 | 100 | 100 | 100 |
| Femoral artery angioplasty | 1 | 828 | 100 | 100 | 100 | 0 | 100 | 100 | 100 |
| TIPSS | 2 | 35 360–43 003 | 100 | 100 | 100 | 0 | 100 | 100 | 100 |
| Vertebroplasty | 3 | 9054–9564 | 100 | 100 | 100 | 0 | 100 | 100 | 0 |
| Lower extremities DSA | 1 | 9994 | 100 | 100 | 100 | 0 | 100 | 100 | 100 |
| Fistula stenting | 2 | 329–7101 | 100 | 100 | 100 | 0 | 100 | 100 | 100 |
| Foreign body removal | 1 | 552 | 100 | 100 | 100 | 0 | 100 | 100 | 100 |
| Total | 18 | 100 | 100 | 83 | 0 | 100 | 100 | 78 | |
TIPSS, transjugular intrahepatic portosystemic stent shunt. DSA, digital subtraction angiography.
Figure 1.
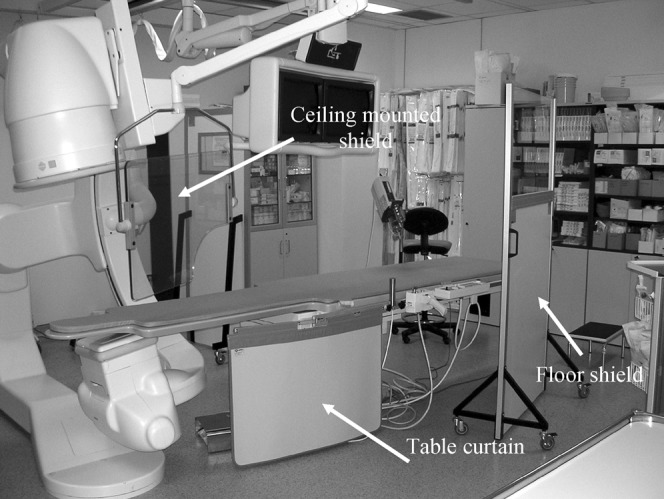
The catheterisation laboratory, illustrating the various radiation protection shields.
In order to assess doses to the extremities and the eyes, eight thermoluminiscent dosemeter (TLD) chips were attached to each individual: two dosemeters were used to record the dose to the eye and were attached one next to the left eye and one between the eyes; four dosemeters were used to record the doses to the hands and were attached on the middle finger of the right and left hand and on the right and left wrists; finally, two dosemeters were used to record doses to the lower extremities and were attached on the right and left leg. In those cases when protective eyeglasses were used, the dosemeters were taped to the external (unprotected) part of the glasses. The leg dosemeters were placed below the lead apron so they were not covered by it. In some procedures, such as pacemaker implantation, it was not possible to attach all dosemeters because of sterile requirements.
Doses were recorded using TLD-100H (LiF:Mg, Cu, P) dosemeters, which were annealed in a furnace (10 min at 240°C and then cooled rapidly at room temperature) and were subsequently sealed in small transparent numbered envelopes. Each TLD was individually calibrated using an Sr-90 irradiator. The dosemeters were measured using a Harshaw 4500 Manual Reader. A batch of 10 chips was irradiated at the Sr-90 irradiator to check for the stability of the reader. The absolute calibration was performed at the Secondary Standard Laboratory of the Greek Atomic Energy Commission using the narrow series beams N-60 to N-120 (ISO 4037 [8]) and Cs-137. The calibration was performed in terms of personal dose equivalent at a depth of 0.07 mm, Hp(0.07), using slab, rod and pillar phantoms. The measured doses were subsequently corrected for background radiation.
In order to investigate the annual radiation burden to physicians we calculated the doses to the extremities and the lenses of the eyes for the interventional cardiologist and radiologist with the highest annual workloads in their departments. Additionally, we calculated the annual dose for the radiologist who performed interventional spinal procedures since high extremity doses were recorded for this particular physician. The annual number of procedures performed by each physician was assessed from the archives of the hospital, covering at least a 6 month period. The average dose per dosimetric location was calculated for each type of procedure and was multiplied by the annual number of procedures for each physician. The annual dose for the extremities and the eyes was calculated by summing the doses for all types of procedures performed by each physician annually.
Results
Total KAP values were recorded for all investigated procedures and large variations among procedures were evident (Table 1). KAP ranged from 329 cGy cm2 (peripheral stent implantation) to 43 003 cGy cm2 (transjugular intrahepatic portosystemic stent shunt; TIPSS). Considerable variations in κAP were also recorded for the same type of procedure; for example, for coronary angiography (CA) KAP ranged from 1087 cGy cm2 to 4534 cGy cm2.
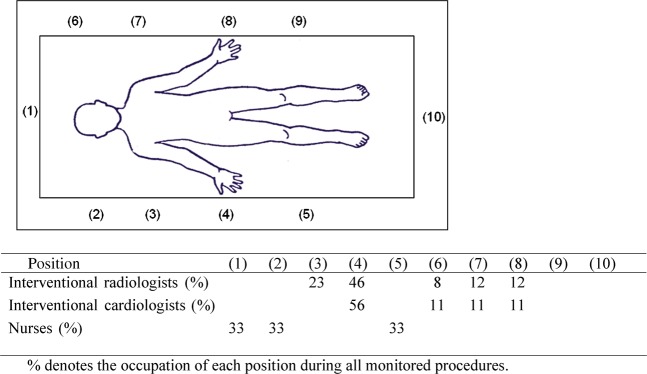
Occupational doses were assessed for five interventional cardiologists, five interventional radiologists and three catheterisation laboratory nurses. The use of personal and laboratory radiation protection measures is shown in Table 1. All interventionists wore protective aprons and collars but none wore protective gloves. Interventional radiologists wore protective glasses for 71% of the procedures whereas interventional cardiologists wore glasses for 83% of the procedures. The nurses wore protective aprons and collars. In all procedures the table curtain and the ceiling-suspended lead screen were used. The mobile floor screen was used for 78% of the radiology and 14% of the cardiac procedures. Figure 2 shows the percentage of occupation of each position around the fluoroscopic table for the interventional radiologists, the interventional cardiologists and the nurses. Interventionists always stood close to the patient and the fluoroscopic table and were inside the catheterisation room for the whole duration of each procedure. Nurses stood approximately 1 m away from the fluoroscopic table and had to supply materials and assist the interventionists during the procedure. Nurses stood by the table during the whole procedure except during cine acquisition, when they moved behind the floor shield.
Figure 2.
Positions of interventional radiologists, interventional cardiologists and nurses during interventional procedures.
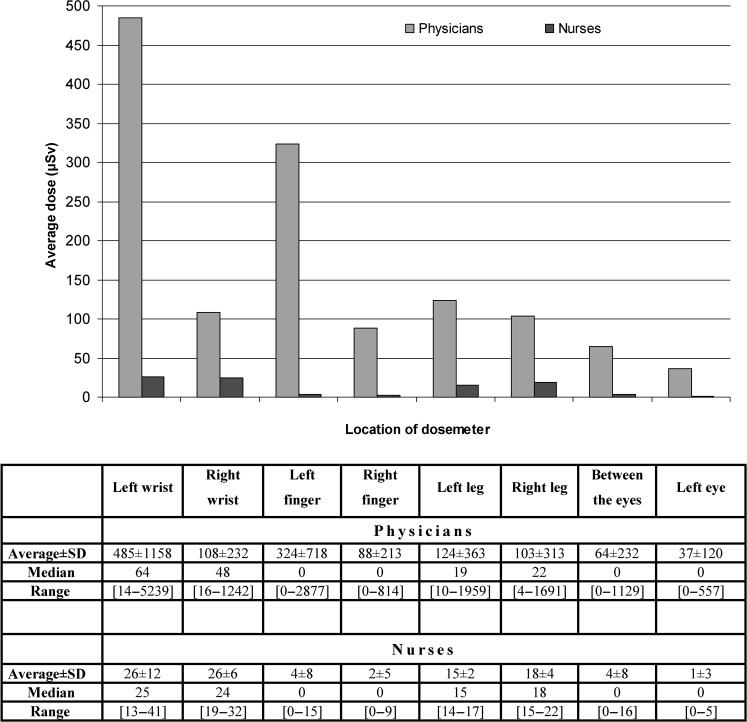
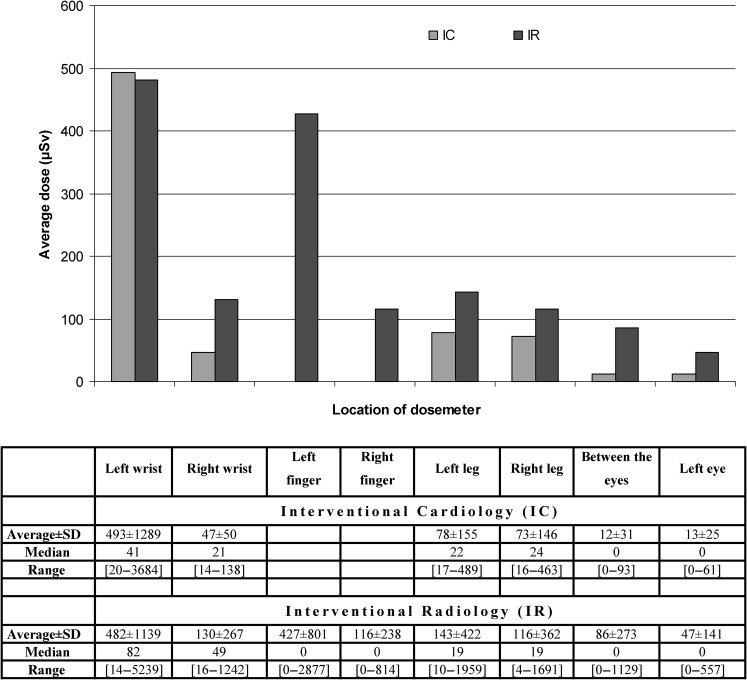
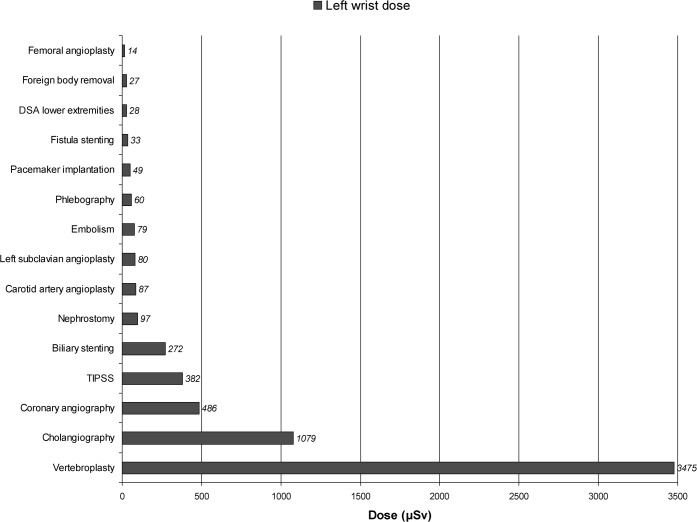
The dose per procedure to the wrists, fingers, eyes and legs are reported in units of μSv. The median and average doses for all procedures recorded for each location are presented for both types of interventionists and the laboratory nurses in Figure 3. As expected, owing to their proximity to the patient, who is the main source of scattered radiation, the dose recorded for each location was higher for interventionists than for laboratory personnel. For physicians, the parts of the body that received the highest doses were the left wrist (average 485 μSv, maximum 5239 μSv) and the left finger (average 324 μSv, maximum 2877 μSv), whereas doses to the legs (average 124 μSv, maximum 1959 μSv) and the eyes (average 64 μSv, maximum 1129 μSv) were lower. For the nurses, maximum doses were recorded for the wrists (average 26 μSv, maximum 41 μSv) and legs (average 18 μSv, maximum 22 μSv), whereas doses to the eyes were minimal (average 4 μSv, maximum 16 μSv). A comparison between the recorded doses by interventional cardiologists and interventional radiologists is given in Figure 4, which shows that doses received by radiologists are overall higher. With regard to the type of procedure, results are shown in Figure 5 that display the average dose per procedure at the left wrist, which was the location of the highest recorded dose. Among the procedures studied, the highest doses were recorded during vertebroplasty, TIPSS and cholangiography. The maximum recorded doses per dosimetric site and procedure are shown in Table 2.
Figure 3.
Recorded doses (μSv) per procedure to both types interventionists and catheterisation laboratory nurses. SD, standard deviation.
Figure 4.
Recorded doses (μSv) per procedure to interventional cardiologists (IC) and interventional radiologists (IR). SD, standard deviation.
Figure 5.
Average dose per procedure recorded by the left wrist dosemeter (location of the highest recorded dose). DSA, digital subtraction angiography; TIPSS, transjugular intrahepatic portosystemic stent shunt.
Table 2. Maximum recorded dose (μSv) per location of dosemeter and procedure.
| Left wrist | Right wrist | Left finger | Right finger | Left leg | Right leg | Between the eyes | Left eye | |
| Cardiac procedures | ||||||||
| Coronary angiography | 43 | 27 | 46 | 28 | ||||
| Pacemaker implantation | 56 | 118 | 15 | 9 | 489 | 463 | 93 | 61 |
| Radiology procedures | ||||||||
| Nephrostomy | 242 | 177 | 433 | 19 | 13 | |||
| Phlebography | 84 | 49 | 47 | 243 | 45 | |||
| Embolism | 87 | 59 | 16 | 36 | ||||
| Cholangiography | 1079 | 208 | 348 | 608 | 22 | 19 | ||
| Carotid artery angioplasty | 115 | 54 | 19 | 20 | 13 | |||
| Left subclavian artery angioplasty | 80 | 18 | 10 | 4 | ||||
| Femoral artery angioplasty | 14 | 16 | 17 | 23 | ||||
| TIPSS | 586 | 463 | 649 | 174 | 1959 | 1691 | 8 | 7 |
| Vertebroplasty | 5239 | 1242 | 2877 | 414 | 83 | 53 | 1129 | 557 |
| Lower extremities DSA | 28 | 25 | 21 | 22 | ||||
| Fistula stenting | 33 | 18 | 19 | 18 | ||||
| Foreign body removal | 7 | 24 | 42 | 31 |
TIPSS, transjugular intrahepatic portosystemic stent shunt; DSA, digital subtraction angiography.
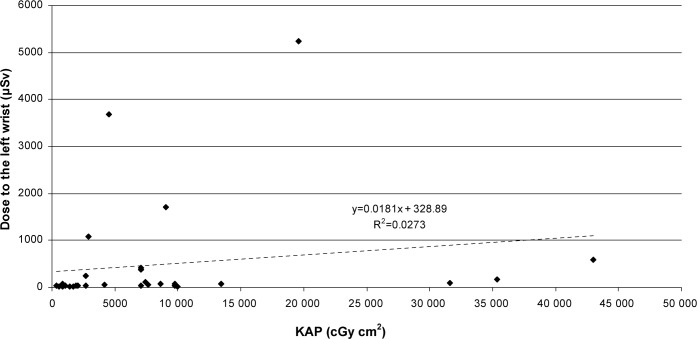
The correlation of κAP and extremity doses was investigated in an attempt to predict staff dose from κAP values. However, κAP was poorly correlated to the left wrist dose (location of highest recorded dose; Figure 6). Thus, it was not possible to assess extremity doses from κAP.
Figure 6.
Average dose to left wrist of physicians versus kerma area product (KAP) for all investigated procedures.
The calculated annual doses to the extremities and the lenses of the eyes based on the average doses recorded for the interventionists with the highest annual workloads in their departments (cardiologist A and radiologist A) and the radiologist who performed interventional spinal procedures (radiologist B) are shown in Table 3.
Table 3. Calculated annual doses for the interventionists with the highest workloads (cardiologist A and radiologist A) and the interventionist for whom maximum doses per procedure were recorded (radiologist B).
| Operator |
Total annual dose (mSv) |
|||||
| Annual procedures | Left wrist | Right wrist | Left leg | Right Leg | Eyes | |
| Cardiologist A | 605 (coronary angiographies) | 19.2 | 12.5 | 16.2 | 13.8 | 8.2 |
| Radiologist A | 167 (various procedures) | 104.9 | 58.0 | 51.4 | 44.5 | 0.5 |
| Radiologist B | 31 (vertebroplasties) | 107.7 | 19.8 | 1.6 | 1.1 | 27.9 |
Discussion
The use of extremity dosemeters is necessary in order to monitor dose at unprotected parts of the body, especially for radiation-sensitive organs such as the lenses of the eyes. Indeed, unsuitable use of protective tools or bad practice (e.g. placing the hands directly in the X-ray beam) could lead to high doses at unexpected positions and poor correlation among dosimetric data [9, 10]. Thus, it is important to assess radiation doses to the upper and lower extremities and the lenses of the eyes in order to ensure that the annual dose limits are not exceeded. Various studies have provided relevant occupational dosimetric data for interventional radiology and cardiology. The results of these studies are shown in Table 4, together with the results of the current study. It is evident that considerable variation exists among studies, which can be attributed to various factors such as the type and the complexity of the procedure undertaken [11], the patient's body habitus [12], the access route (e.g. femoral or radial) [13], the skill and experience of the physicians [13], the shielding equipment used [14, 15], the angiographic equipment [14] and the exposure settings [16].
Table 4. Published data of staff dosimetry in interventional cardiology (IC) and interventional radiology (IR).
| Dose per procedure (μSv) |
||||||
| Eye/forehead | Shoulder | Left hand/wrist | Left leg | Category of procedure | Reported value | |
| Current study | 86 | 482 | 143 | IR | Mean | |
| 2007, Shortt et al [21] | 231 | IR | Mean | |||
| 2006, Vanhavere et al [26] | 30 | 56 | 50 | IR | Median | |
| 2005, Harstall et al [18] | 20 | 107 | IR | Mean | ||
| 1998, Vano et al [14] | 284 | 283 | 396 | IR | Mean | |
| 1995, Damilakis et al [19] | 710 | IR | Mean | |||
| Current study | 13 | 493 | 78 | IC | Mean | |
| 2008, Tsapaki et al [27] | 27 | 13 | IC | Median | ||
| 2008, Lie et al [22] | 44 | IC | Mean | |||
| 2005, Tsapaki et al [24] | 80 | 60 | IC | 3rd quartile | ||
| 2004, Tsapaki et al [11] | 59 | 73 | IC | Mean | ||
| 1998, Vano et al [14] | 294 | 252 | 364 | IC | Mean | |
The results of the current study indicate that for particular interventional procedures, interventionists are subjected to high doses. In IR, the highest doses were recorded in vertebroplasty (5239 μSv at the left wrist and 1129 μSv at the eyes) and TIPSS (1959 μSv at the left leg). However, doses associated with these procedures are likely to be high, as they are commonly the longest procedures undertaken and require the use of several different projections [17, 18]. Additionally, in these procedures the physicians need to be close to the patient's side in an area of relatively high scatter dose rate in order to manipulate the catheter effectively [17]. Because of the nature of the interventional procedures, which involve manipulation of devices through catheters, it is impossible to avoid the hands being exposed to radiation scattered from the patient. However, hands should not be placed in the primary X-ray beam and should be kept as far from the X-ray field as possible without affecting the performance of the procedure. The shielding devices that are available to protect the hands are limited; in addition, anything that may interfere with any manipulation, lengthening the procedure and thereby increasing the dose to the patient, should be avoided. Disposable surgical gloves incorporating 0.02 mm of lead are available, but they provide a dose reduction of only 15–20% [19, 20]. Moreover, the interventionist may have a false impression of the level of protection they provide [15]. The current study did not investigate the effect of shielding on occupational dose; however, other studies have shown that the use of a table curtain can reduce doses to the lower extremities by 64% [21], whereas a similar dose reduction at the upper body is achievable by ceiling-mounted screens [14]. Regarding the nurses, recorded doses were low (maximum dose to the extremities 41 μSv and maximum dose to the eyes 16 μSv), indicating that the position of these individuals and the protective shields used during intervention effectively reduce their irradiation.
With regard to the correlation with KAP, this study did not show a correlation between KAP and occupational extremity doses. Many equivalent studies also did not detect a correlation of occupational extremity dose with KAP [11, 22–24]. A few studies found a correlation between lower extremity doses and KAP when no lead shields were used [15, 17].
The normalisation of occupational doses with KAP for IC and IR procedures is shown in Table 5 together with the average KAP recorded for each category of procedures. Williams [25] reported 24.5 μSv/1000 cGy cm2 for the fingers during IR procedures, which is slightly lower than the value found in this study (35.6 μSv (1000 cGy cm2)–1 averaged for the left and right finger). Vano et al [14] reported 33–60 μSv/1000 cGy cm2 for the left eye during IC procedures, which is higher than the value of 13.7 μSv/1000 cGy cm2 found in this study; however, the authors state that the use of protective shields during the intervention was irregular, thus higher doses to the physicians are to be expected.
Table 5. Kerma area product (KAP) conversion factors in interventional cardiology (IC) and radiology (IR).
| Location of dosemeter | Conversion factor for IC (μSv(1000 cGy cm2)–1) | Conversion factor for IR (μSv(1000 cGy cm2)–1) |
| Left wrist | 117.3 | 62.2 |
| Right wrist | 16.2 | 21.6 |
| Left finger | n/a | 52.1 |
| Right finger | n/a | 19.1 |
| Left leg | 25.1 | 14.2 |
| Right leg | 23.7 | 12.8 |
| Between the eyes | 13 | 20.2 |
| Left eye | 13.7 | 11.9 |
| Average KAP (cGy cm2) | 2466 | 10 792 |
n/a, not applicable.
The results indicate that the annual limits for the lenses of the eyes (150 mSv) and the extremities (500 mSv) are not exceeded. The highest annual doses were estimated for the left wrist and the eyes of the radiologist who was involved in vertebroplasties. This is probably because, in these procedures, oblique views are extensively used and the physician is usually required to stand close to the X-ray tube, which subjects him or her to leakage radiation. Substantial annual doses to the upper and lower extremities were estimated for the radiologist who is involved in various different procedures since, in daily practice, the radiologist's position with respect to the patient varies, as does the angiographic set-up, resulting in whole-body irradiation. Finally, the doses recorded for the cardiologist were lower and more uniformly distributed.
Conclusion
Occupational doses to the extremities and the lenses of the eyes for interventionists and the assisting laboratory nurses were assessed in interventional cardiology and radiology procedures. Overall, higher doses were recorded in radiology procedures for the physicians whereas doses for the nurses were minimal for both categories of procedures. Extrapolation to annual doses considering the actual workload of interventionists revealed that annual limits for the extremities and the lenses of the eyes are not exceeded even for the busiest physicians. However, there are cases in which high doses have been recorded, and this can lead to exceeding the dose limits when bad practices are followed and the radiation protection tools are not used properly.
Acknowledgments
This study was supported by a grant from the S. Niarchos Foundation. A part of the research leading to these results has received funding from the European Atomic Energy Community's Seventh Framework Programme (FP7/2007–2011) under grant agreement no. 211361.
References
- 1.Bhargavan M. Trends in the utilization of medical procedures that use ionizing radiation. Health Phys 2008;95:612–27 [DOI] [PubMed] [Google Scholar]
- 2.McBride KD, Fisher R, Warnock N, Winfield DA, Reed MW, Gaines PA. A comparative analysis of radiological and surgical placement of central venous catheters. Cardiovasc Intervent Radiol 1997;20:17–22 [DOI] [PubMed] [Google Scholar]
- 3.Noh HM, Kaufman JA, Rhea JT, Kim SY, Geller SC, Waltman AC. Cost comparison of radiologic versus surgical placement of long-term hemodialysis catheters. AJR Am J Roentgenol 1999;172:673–5 [DOI] [PubMed] [Google Scholar]
- 4.Picano E, Santoro G, Vano E. Sustainability in the cardiac cath lab. Int J Cardiovasc Imaging 2007;23:143–7 [DOI] [PubMed] [Google Scholar]
- 5.Baim D, Grossman W. Cardiac catheterization, angiography, and intervention. Baltimore: Williams & Wilkins, 1994 [Google Scholar]
- 6.Padovani R, Rodella CA. Staff dosimetry in interventional cardiology. Radiat Prot Dosimetry 2001;94:99–103 [DOI] [PubMed] [Google Scholar]
- 7.Padovani R, Foti C, Malisan MR. Staff dosimetry protocols in interventional radiology. Radiat Prot Dosimetry 2001;94:193–6 [DOI] [PubMed] [Google Scholar]
- 8.ISO 4037-3 X and gamma reference radiation for calibrating dosemeters and dose rate meters and for determining their response as a function of photon energy. Part 3. Calibration of area and personal dosemeters and the measurement of their response as a function of energy and angle of incidence. Geneva: International Organization for Standardization, 1999 [Google Scholar]
- 9.Servomaa A, Karppinen J. The dose-area product and assessment of the occupational dose in interventional radiology. Radiat Prot Dosimetry 2001;96:235–6 [DOI] [PubMed] [Google Scholar]
- 10.Padovani R, Bernardi G, Malisan MR, Vano E, Morocutti G, Fioretti PM. Patient dose related to the complexity of interventional cardiology procedures. Radiat Prot Dosimetry 2001;94:189–92 [DOI] [PubMed] [Google Scholar]
- 11.Tsapaki V, Kottou S, Vano E, Komppa T, Padovani R, Dowling A, et al. Occupational dose constraints in interventional cardiology procedures: the DIMOND approach. Phys Med Biol 2004;49:997–1005 [DOI] [PubMed] [Google Scholar]
- 12.Vano E, Gonzalez L, Fernandez JM, Prieto C, Guibelalde E. Influence of patient thickness and operation modes on occupational and patient radiation doses in interventional cardiology. Radiat Prot Dosimetry 2006;118:325–30 [DOI] [PubMed] [Google Scholar]
- 13.Whitby M, Martin CJ. A study of the distribution of dose across the hands of interventional radiologists and cardiologists. Br J Radiol 2005;78:219–29 [DOI] [PubMed] [Google Scholar]
- 14.Vano E, Gonzalez L, Guibelalde E, Fernandez JM, Ten JI. Radiation exposure to medical staff in interventional and cardiac radiology. Br J Radiol 1998;71:954–60 [DOI] [PubMed] [Google Scholar]
- 15.Martin CJ, Whitby M. Application of ALARP to extremity doses for hospital workers. J Radiol Prot 2003;23:405–21 [DOI] [PubMed] [Google Scholar]
- 16.Zweers D, Geleijns J, Aarts NJ, Hardam LJ, Lameris JS, Schultz FW, et al. Patient and staff radiation dose in fluoroscopy-guided TIPS procedures and dose reduction, using dedicated fluoroscopy exposure settings. Br J Radiol 1998;71:672–6 [DOI] [PubMed] [Google Scholar]
- 17.Whitby M, Martin CJ. Radiation doses to the legs of radiologists performing interventional procedures: are they a cause for concern? Br J Radiol 2003;76:321–7 [DOI] [PubMed] [Google Scholar]
- 18.Harstall R, Heini PF, Mini RL, Orler R. Radiation exposure to the surgeon during fluoroscopically assisted percutaneous vertebroplasty: a prospective study. Spine 2005;30:1893–8 [DOI] [PubMed] [Google Scholar]
- 19.Damilakis J, Koukourakis M, Hatjidakis A, Karabekios S, Gourtsoyiannis N. Radiation exposure to the hands of operators during angiographic procedures. Eur J Radiol 1995;21:72–5 [DOI] [PubMed] [Google Scholar]
- 20.Marx MV, Ellis JH. Radiation protection of the hand in interventional radiology: should it fit like a glove? Radiology 1996;200:24–5 [DOI] [PubMed] [Google Scholar]
- 21.Shortt CP, Al-Hashimi H, Malone L, Lee MJ. Staff radiation doses to the lower extremities in interventional radiology. Cardiovasc Intervent Radiol 2007;30:1206–9 [DOI] [PubMed] [Google Scholar]
- 22.Lie OO, Paulsen GU, Wohni T. Assessment of effective dose and dose to the lens of the eye for the interventional cardiologist. Radiat Prot Dosimetry 2008;132:313–18 [DOI] [PubMed] [Google Scholar]
- 23.Williams JR. The interdependence of staff and patient doses in interventional radiology. Br J Radiol 1997;70:498–503 [DOI] [PubMed] [Google Scholar]
- 24.Tsapaki V, Kottou S, Vano E, Parviainen T, Padovani R, Dowling A, et al. Correlation of patient and staff doses in interventional cardiology. Radiat Prot Dosimetry 2005;117:26–9 [DOI] [PubMed] [Google Scholar]
- 25.Williams JR. Radiation exposure to medical staff in interventional radiology. Br J Radiol 1998;71:1333–4 [DOI] [PubMed] [Google Scholar]
- 26.Vanhavere F, Berus D, Buls N, Covens P. The use of extremity dosemeters in a hospital environment. Radiat Prot Dosimetry 2006;118:190–95 [DOI] [PubMed] [Google Scholar]
- 27.Tsapakiv V, Patsilinakos S, Voudris V, Magginas A, Pavlidis S, Maunis T, et al. Level of patient and operator dose in the largest cardiac centre in Greece. Radiat Prot Dosimetry 2008;129:71–3 [DOI] [PubMed] [Google Scholar]


