Abstract
In two fast neutron data sets, comprising in vitro and in vivo experiments, an inverse relationship is found between the low-linear energy transfer (LET) α/β ratio and the maximum value of relative biological effect (RBEmax), while the minimum relative biological effect (RBEmin) is linearly related to the square root of the low-LET α/β ratio. RBEmax is the RBE at near zero dose and can be represented by the ratio of the α parameters at high- and low-LET radiation exposures. RBEmin is the RBE at very high dose and can be represented by the ratio of the square roots of the β parameters at high- and low-LET radiation exposures. In principle, it may be possible to use the low-LET α/β ratio to predict RBEmax and RBEmin, providing that other LET-related parameters, which reflect intercept and slopes of these relationships, are used. These two limits of RBE determine the intermediate values of RBE at any dose per fraction; therefore, it is possible to find the RBE at any dose per fraction. Although these results are obtained from fast neutron experiments, there are implications for charged particle therapy using protons (when RBE is scaled downwards) and for heavier ion beams (where the magnitude of RBE is similar to that for fast neutrons). In the case of fast neutrons, late reacting normal tissue systems and very slow growing tumours, which have the smallest values of the low-LET α/β ratio, are predicted to have the highest RBE values at low fractional doses, but the lowest values of RBE at higher doses when they are compared with early reacting tissues and fast growing tumour systems that have the largest low-LET α/β ratios.
The medical prescription of charged particle therapy, which always contains high-linear energy transfer (LET) in the Bragg peak region, is usually in the form of a biological equivalent dose, usually referred to as the gray equivalent. This is instead of a real physical dose as is used to prescribe standard megavoltage X-ray therapy. Conversion from physical to biological dose uses the relative biological effect (RBE) concept, so that the delivered high-LET dose is the physical dose of the low-LET radiation divided by the RBE. RBE is known to vary with dose per fraction, from a maximum value (RBEmax) at very low dose per fraction to a lower limiting value of RBEmin at very high dose per fraction. Previously, fixed RBE values were used to provide the biological equivalent dose at the prescription point or isodose surface, as in the case of fast neutron therapy where an RBE of 3 was too often assumed for all tissues at all fractional doses, but with the inevitable consequence of under or over dosage (relative to megavoltage X-rays) in other tissues where doses were higher or lower [1].
Dale et al [2] have pointed out the potentially serious errors that can occur when RBE values are not known with sufficient accuracy in high-LET radiations, such as in heavy charged particle beam therapy. The resultant biological dose may be under- or overestimated by an extent that far exceeds the normal requirement for physical dose accuracy in conventional X-ray based radiotherapy. Equations are available for isoeffective biological dose calculations, which use the low-LET α/β ratio, (α/β)L, along with RBEmax and RBEmin as dose multiplying factors. It is (α/β)L that determines the fractionation sensitivity in specific tissues for all forms of radiotherapy, including high-LET radiotherapy (providing that these two RBE parameters are used).
The present article investigates the relationship between RBEmax, RBEmin and (α/β)L for megavoltage X-rays and fast neutrons, the latter class of radiation as a radiobiological tool for the investigation of high-LET radiation effects.
Methods and materials
In vitro cell survival studies in 30 human cell lines exposed to 4 MeV X-rays (low-LET) and fast neutron (high-LET), using the Clatterbridge cyclotron, have been published by Warenius et al [3]. Although the entire data set is analysed, data censoring is used to eliminate extreme repair mutants and experimental data fitting uncertainties [where (α/β)L is >50 Gy and if high-LET β-parameters are ≤0.01 Gy−2 and where RBEmin is <0.2]. This leads to omission of six data points that possess these criteria.
The in vivo experimental data set, which used X-rays and fast neutrons in various normal tissue types, provides values of low-LET α/β, RBEmin and RBEmax published by Carabe-Fernandez et al [4] (in their Table 1), although these data do not include standard error estimates. Some experimental results were censored, e.g. if the biological end point is unlikely to reflect a satisfactory clonogenic end point and where further data on the same animals represent a longer temporal data set more representative of late tissue damage. Experiments that are sixth, seventh and eighth (colorectal damage reflected by body weight at various time points) in Table 1 of Carabe-Fernandez et al [4] are censored as they represent a potentially inappropriate surrogate for colorectal damage; the final, and most relevant, pathological late effect reported by Terry et al [5] is included. Also, one data point with RBEmin of 0.1 has been excluded in the RBEmin in vivo analysis, as this is likely to represent experimental error. In summary, the data adapted from Carabe-Fernandez et al [4] are given in Table 1 of this review.
Table 1. Data (point estimates) taken from Carabe-Fernandez et al [4] and used in this report.
| Assay | Low LET α/β | RBEmax | RBEmin |
| Oesophagus, LD50 | 16.24 | 3.05 | 2.27 |
| Bone marrow (haematocrit) | 1.15 | 26.33 | 1.19 |
| Kidney (EDTA) | 1.22 | 20.58 | 1.35 |
| Kidney | 2.23 | 15.85 | 0.73 |
| Mouse skin | 17.42 | 5.35 | 0.41 |
| Colorectal, LD50(2 months) | 28.96 | 5.70 | 1.46 |
| Colorectal, LD50(15 months) | 3.11 | 12.56 | 0.41 |
| Lung (28 weeks) | 2.93 | 7.63 | 0.58 |
| Lung LD50 (28 weeks) | 5.95 | 5.19 | 0.99 |
| Lung LD50 (68 weeks) | 2.32 | 8.62 | 0.72 |
| Pig skin (acute) | 15.17 | 3.46 | 0.71 |
| Pig skin (late) | 5.25 | 4.26 | 0.91 |
EDTA, ethylenediaminetetraacetic acid; LD50, lethal dose for 50%; LET, linear energy transfer; RBEmax, maximum value of relative biological effect; RBEmin, minimum value of relative biological effect.
Least squares fitting and non-linear regression are used to analyse the above data using Mathematica (Wolfram, Champaign, IL) software, with and without the use of standard error corrections and non-linear fit programmes.
The analysis is based on the linear quadratic model of radiation effect, with special attention to the inclusion of RBEmin and RBEmax concepts for high-LET radiations [4,6]. The symbols used are shown in Table 2.
Table 2. Symbols used in text and appendices.
| Symbol (and units) | Meaning |
| LET (keV µM–1) | Linear energy transfer (LET) is the average loss of energy per micrometre length of track |
| dL (Gy) | Dose per fraction of low-LET radiation |
| dH (Gy) | Dose per fraction of high-LET radiation |
| NL | Number of low-LET fractions |
| NH | Number of high-LET fractions |
| αL (Gy−1) | Low-LET radiosensitivity per unit dose |
| αH (Gy−1) | High-LET radiosensitivity per unit dose |
| βL | Low-LET radiosensitivity per unit dose squared |
| βH | High-LET radiosensitivity per unit dose squared |
| (α/β)L | The ratio of α/β for low-LET radiation |
| RBE | The ratio of low-LET dose divided by high-LET dose for a specific biological end point. Relative biological effect (RBE) varies with dose and can take any value between the limits of RBEmax at near zero dose to RBEmin at very high dose |
| RBEmax | The ratio of αH/αL and is the RBE at near zero dose |
| RBEmin | The ratio of √(βH/βL) and is the RBE at very high dose |
| C | The minimum value of RBEmax when low-LET α/β is smallest owing to biological constraints |
| A | Coefficient controlling change of RBEmax with increasing values of low-LET α/β |
| K | The lowest value of RBEmin when low-LET α/β is smallest owing to biological constraints |
| B | Coefficient controlling change of RBEmin with increasing values of low-LET α/β |
| Q | Coefficient controlling relationship between RBEmax and low-LET α/β if no boundary conditions |
| S | Coefficient controlling relationship between RBEmin and low-LET α/β if no boundary conditions |
The low-LET radiation biological effective dose (BED) is expressed as:
 |
and the high-LET BED as:
 |
The mathematical forms of the derivations and fitted relationships are given in Appendix A. The equations used in Appendix B are used to obtain the graphical displays of estimated RBE with dose per fraction. The calculation method to obtain the dose at which RBE is equal (at cross-over points) for two different tissues or tumours, each with different α/β ratios, is given in Appendix C.
Results
In vitro data
The relationship between (α/β)L and RBEmin [shown as RBEmin=S×√√(α/β)L in Equation 7 in Appendix A] is clearly seen in the data points displayed in Figure 1 for the entire data set of 30 cell lines. There is a good overall statistical fit for the equations 0.31√(α/β)L and 0.29√(α/β)L using uncorrected and standard error corrected least squares fits, respectively. Using non-linear regression, without standard error correction, the estimated mean and 95% confidence interval for S are 0.31 (0.23–0.38).
Figure 1.
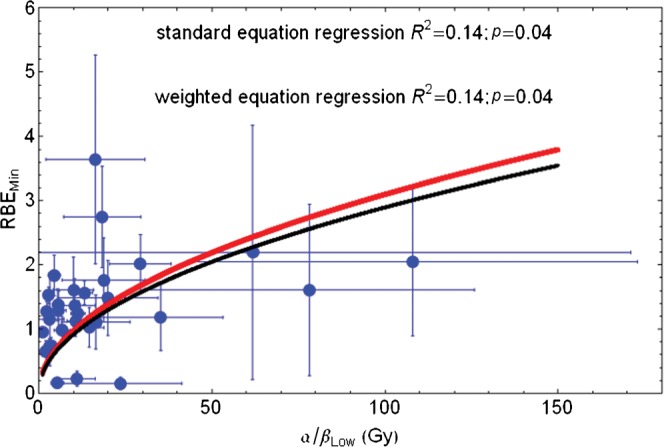
Plot of RBEmin with increasing low-LET α/β ratio for the entire in vitro data set and fitted using Equation 7 in Appendix A. Red line, standard regression; black line, error weighted regression; RBEmin, minimum value of relative biological effect; LET, linear energy transfer.
If the three lowermost RBEmin values are censored, the resulting fit is only slightly different [RBEmin=0.33√(α/β)L]. When Equation 11 (Appendix A) is used, better fits are obtained, as shown in Figure 2, where RBEmin=0.76+0.22√(α/β)L by fitting the (mean) data points or RBEmin=0.72+0.18√(α/β)L; if standard error corrections are also used, the 95% confidence interval for the two respective numerical parameters are 0.09–1.42 and 0.02–0.42 for the former equation. These equations provide realistic values of RBEmin that are not too small for small low-LET α/β values and are reasonably close to unity.
Figure 2.
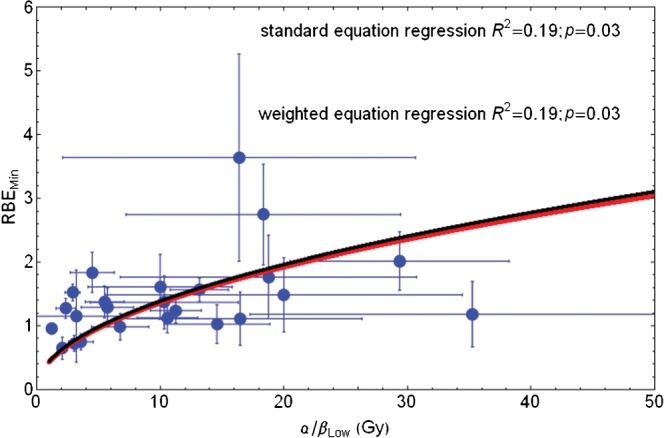
Plot of RBEmin with increasing low-LET α/β ratio for the censored in vitro data set and fitted using Equation 11 in Appendix A. Red line, standard regression; black line, error weighted regression; RBEmin, minimum value of relative biological effect; LET, linear energy transfer.
Figure 3 shows the reciprocal relationship between RBEmax and low-LET α/β for all data points, with curves fitted using the simple reciprocal equations as in Equation 6 (Appendix A). Both the uncorrected data [RBEmax=12.40/(α/β)L] and standard error corrected data [RBEmax=11.04/(α/β)L] fits are poor at high α/β values, with some estimates of RBEmax below unity for large α/β. The 95% confidence interval for the 12.4 estimate is 8.85–15.9.
Figure 3.
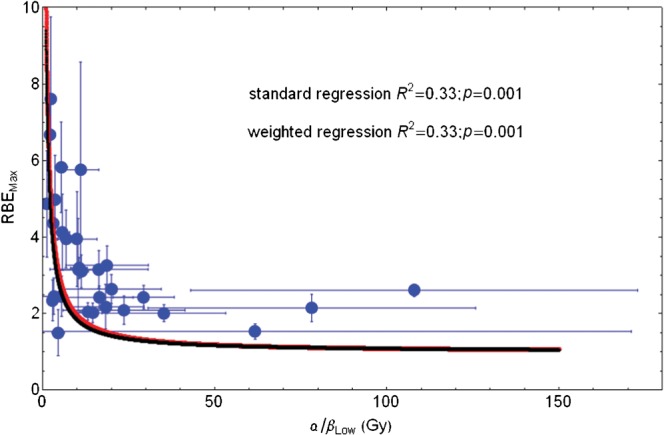
Plot of RBEmax with increasing low-LET α/β ratio for entire in vitro data set and fitted using Equation 6 in Appendix A. Red line, standard regression; black line, error weighted regression; RBEmax, maximum value of relative biological effect; LET, linear energy transfer.
If the data are censored by removing inappropriate α/β values in repair mutants, as discussed by Jones [6], and the phase plane changed by adopting Equation 10 (Appendix A) then improved fitting is obtained, as shown in Figure 4. The fitted equations are then RBEmax=2.43+4.97/(α/β)L and RBEmax=2.29+4.81/(α/β)L for using uncorrected point estimates and the standard error corrected least squares fitting methods, respectively. Both methods give the same degree of statistical significance when estimated by non-linear regression fitting. The 95% confidence intervals for the numerical parameters are 1.67–3.2 and 2.15–7.79 in the first case.
Figure 4.
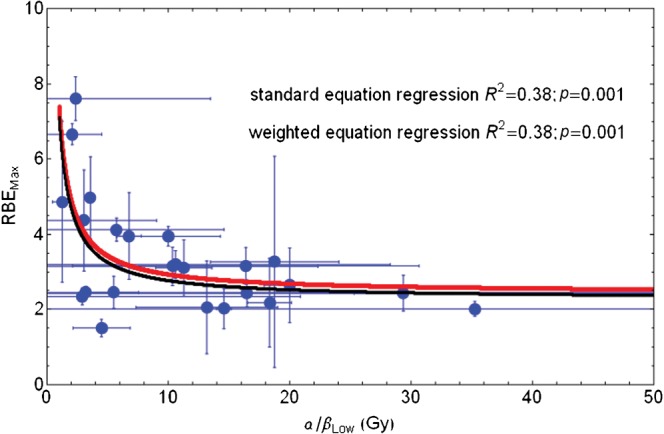
Plot of RBEmax with increasing low-LET α/β ratio for entire in vitro data set and fitted using Equation 9 in Appendix A. Red line, standard regression; black line, error weighted regression; RBEmax, maximum value of relative biological effect; LET, linear energy transfer.
In vivo data
The results are shown for RBEmin and RBEmax in Figures 5 and 6, respectively. The derived RBEmin=0.7 + 0.11√(α/β)L fit is statistically insignificant, with numerical parameter 95% confidence intervals of −0.03 to 1.42 and −0.14 to 0.36, respectively. The poor statistical fit is probably due to the inherent difficulties associated with measuring the very low β parameter in vivo because of bio-heterogeneity, as well the reasons discussed elsewhere [6], i.e. the large numbers of animals required to provide higher levels of statistical confidence.
Figure 5.
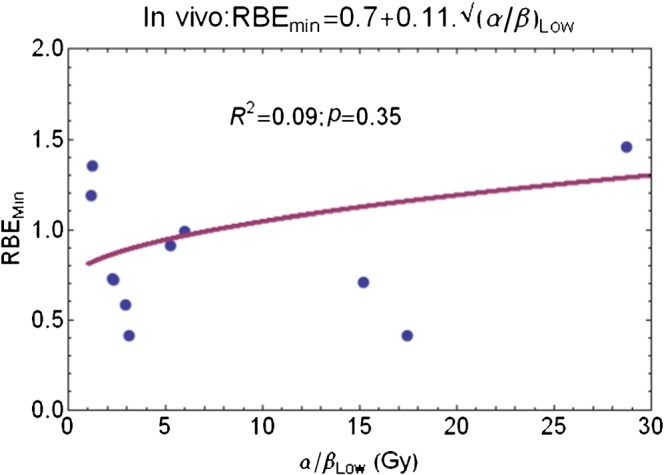
Plot of RBEmin with increasing low-LET α/β ratio for censored in vivo data set and fitted using Equation 11 in Appendix A. RBEmin, minimum value of relative biological effect; LET, linear energy transfer.
Figure 6.
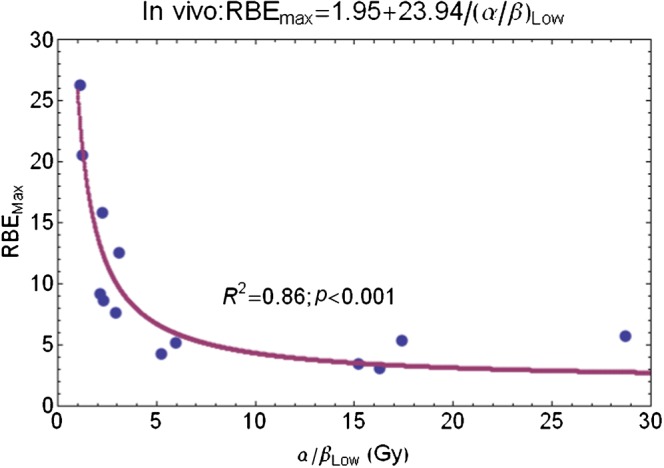
Plot of RBEmin with increasing low-LET α/β ratio for entire in vivo data set and fitted using Equation 10 in Appendix A. RBEmin, minimum value of relative biological effect; LET, linear energy transfer.
In contrast, the RBEmax equation fitting results are better, they have a clearly defined reciprocal relationship and significant statistics (Figure 6). The non-linear fit to Equation 10 in Appendix A gives RBEmax=2.07+24.59/(α/β)L, and where the 95% confidence intervals on the two numerical parameters are 0.5–4.65 and 18.45–30.72, respectively.
Figure 7 shows the effect of changing neutron dose per fraction on RBE, using Equation 3 (Appendix B), assuming from the above results that RBEmax=2.1+24.59/(α/β)L and RBEmin=0.76+0.22√(α/β)L.
Figure 7.
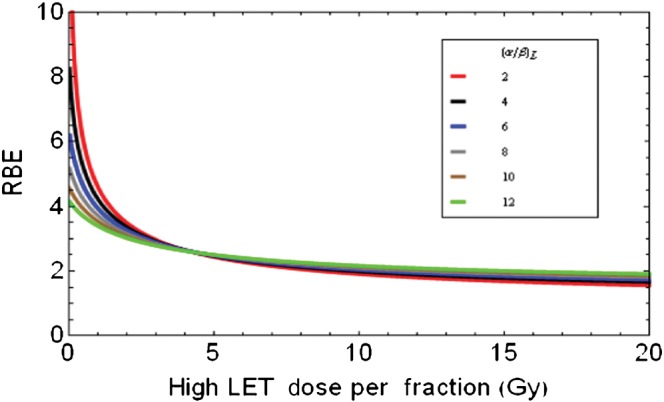
Relationships between high-LET dose per fraction and RBE for variable low LET α/β ratios which are used to partly determine the RBEmax (the intercept value of RBE at zero dose) and RBEmin (the asymptotic RBE at very high dose). RBE, relative biological effect; LET, linear energy transfer.
It is evident that the curves with the lowest (α/β)L ratios extend to higher RBEmax values at very low doses and have the lowest RBEs at high doses. The cell systems with the highest (α/β)L ratios are predicted to show little change in RBE with dose per fraction, while also having the highest RBEs at large fractional doses.
Figure 8 shows an attempt to scale down the neutron RBEs to those more appropriate for protons and where there is little change in RBE with dose per fraction for tissues or tumour systems with higher (α/β)L values. For this to be achieved, the RBEmax is assumed to be 1.05+1/(α/β)L and the RBEmin is 1.05.
Figure 8.
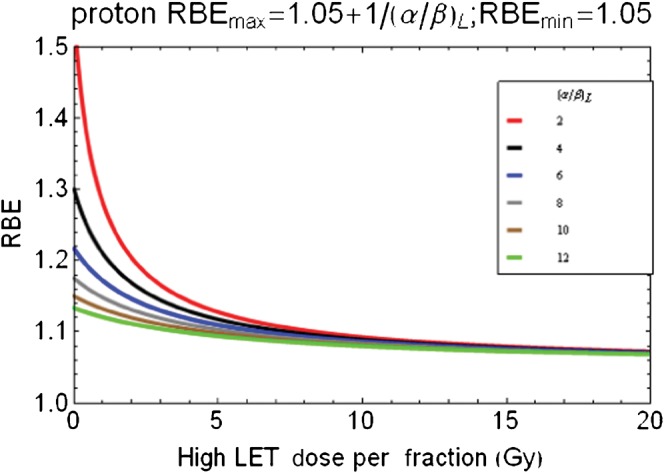
Scaled data from Figure 7 for speculation of proton relative biological effect (RBE) changes with dose per fraction by reduction of RBEmax using lower parameters as shown above graphic. RBEmax, maximum value of relative biological effect.
Discussion
The UK research councils and cancer charities have invested considerable resources in experimental neutron radiobiology and clinical applications. Harold Gray thought that neutrons were a good tool for investigating high-LET effects, but did not think them appropriate for radiotherapy [Dr OCA Scott, London, UK, 2002, personal communication]. Neutrons proved to be disappointing in randomised clinical trials, for reasons that are now better understood [1,7]. It is important that the wealth of experimental data sets produced by British scientists should be analysed as completely as possible and with special attention to any general principles that might guide future research in charged particle therapy.
The data plots and analysis have shown a statistically significant inverse relationship between RBEmax and low-LET α/β and a linear relationship between RBEmin and the square root of α/β. These findings allow the possibility for tentatively deriving RBEmax and RBEmin values from low-LET α/β ratios, which are increasingly being identified for normal tissues and a variety of tumours. Variable RBE values can then be obtained for changes in dose per fraction, which occur in three-dimensional treatment dose distribution plans, or when prescribed dose is changed. Such possibilities can of course apply only to radiation treatment modalities with LET equivalent to the fast neutrons used in the data presented here.
The model presented in Appendix A is based on the premise that a change from low- to high-LET is accompanied by an immediate change in RBEmax, which can be further increased by a change in the more fundamental low-LET α/β ratio. The results obtained suggest that RBE values at low dose will be highest in tissues with very low α/β values, including those found in many slow growing tumours and late reacting normal tissues, such as brain and spinal tissues in which some of the most serious side effects of radiotherapy occur; at high doses the highest RBE will be found for tumours and tissues with high α/β ratios. Since tumours with low proliferation indices (and consequently low α/β ratios) are predicted to have higher RBE values, the predictions made are consistent with the data of Batterman et al [8] in which human tumours with longer volume doubling times have the highest RBE values. The findings in the current paper are consistent with the normal toxicity results in the British neutron trials in which the neutron dose per fraction at Edinburgh was reduced to 0.5 Gy per fraction rather than approximately 1.4 Gy [1,7] at Hammersmith and Clatterbridge (the equivalent megavoltage low-LET X-ray doses would be 1.5 and 4.2 Gy for an RBE of 3; and 1.25 and 3.5 Gy for an RBE of 2.5. The normal tissue toxicity was arguably worse at Edinburgh, although there were other important factors, such as beam energy and number of fields used. As seen in Figure 8, a reduction on neutron dose per fraction would allow a greater spread in RBE values with exacerbation of late effects associated with low α/β ratio tissues such as central nervous system (CNS) and late fibrosis.
The method presented has provided a good statistical fit for two quite different data sets (with the exception of RBEmin in vivo), but there are differences in the parameter values obtained. These differences may be partly LET dependent and, as a result of the different neutron energies (and spectra) used, the lower energy Hammersmith beam [d(15)+Be] produces a higher RBE than the Clatterbridge beam (62.5 MeV+Be). Additionally, the range of doses used would be limited to those necessary to produce toxic events, so that measurement of the true RBEmin at much higher doses would not be feasible. The conditions of the experiments have a marked difference, i.e. in vitro cells are grown in optimum conditions (with respect to nutrients and oxygenation) and irradiated in logarithmic growth conditions, which may truncate repair and not allow repair classes that operate over longer time courses. Potentially lethal damage (PLD) repair is curtailed in in vitro systems. In contrast, in vivo irradiations involve many different target cells and full PLD repair in studies of normal tissue effects. Thus, different values of radiosensitivities are to be expected in the two classes of data.
The findings presented in the current paper are independent of microdosimetry considerations, although such a framework that includes a similar assumption about RBEmax linked to α/β ratio was used by Hawkins [9,10], but in the form of 1+γ/(α/β)L, where γ is a LET dependent parameter and is broadly similar to Equation 10 in Appendix A. Paganetti et al [11] reached a similar conclusion by using Monte-Carlo particle track simulations.
The separate local effect model used in Germany [12] also presumes a relationship with low-LET α/β values, but also takes further assumptions based on nuclear volume and a linear shape of the cell survival curve at high doses, which have been found to be poorly predictive in some experiments [13]. The local effect model is undergoing further modification at the present time. From the data presented in the current paper, it is not surprising that it will be difficult to detect a clear relationship between RBE and α/β—at say surviving fractions of 0.1 or 0.01—since the RBE will, at some low doses, be more related to the inverse of α/β and at high doses more directly proportional to α/β.
Better knowledge of RBEmax and RBEmin values would allow dose per fraction to be adjusted over a wide range of doses, which would be applicable for fractionated and hypofractionated treatments. This is in marked contrast to the existing models including that used in Japan for carbon ion therapy [14]. In principle it should be possible to use representative low-LET α/β values to predict RBE to a reasonable degree of accuracy at any dose level. More work on determination of the parameters given in the appendices, that is Q, S or the better alternatives C, K, A and B, is urgently indicated for all forms of particle therapy.
The method used is dependent on the validity of the linear quadratic model of radiation effect and all the assumptions made. The data were found from in vitro experiments using fast neutrons of maximum energy 64 MeV, whereas the animal data were obtained using 24 MeV neutrons, which will influence the RBE values. A more comprehensive system for adjusting RBE in relation to LET is required, but the present results are sufficient to show the general principles. Statistical fitting is mostly good, despite the inevitable large biological variation, the different experimental conditions and beam qualities used in the different experimental groups.
The scaling down of RBE parameters to likely values for proton therapy is especially tentative, but provides an important insight into the continuing debate as to whether the RBE is 1.1 in all tissues and at all doses. This policy was used in Boston and was subsequently adopted in most proton therapy centres (with the possible sole exception of Tzukuba where no correction was used). The experimental data at Boston, which were used to justify the choice of an RBE of 1.1, have been summarised by Pagannetti et al [15,16]. Close examination of their results shows that their in vitro data contain mainly fast growing Chinese hamster ovary cells and their in vivo data predominately of acute reacting assays. Both systems will have low fractionation sensitivity and high α/β ratios, and, according to our current hypothesis, will not show a marked change in RBE with dose per fraction. It is also apparent that the American National Institutes of Health did not fund Boston with a grant to test RBE in brain tissue [Dr H Suit, Heidelberg, Germany, 2009, personal communication], in which the α/β ratio is known to be approximately 2 Gy in most systems and where we might expect the RBE to exceed 1.1 at low doses per fraction. It is vital that more proton therapy radiobiology should be done to resolve this issue, and improve the safety of proton and heavy ion treatment especially within the CNS.
Further work is necessary to validate the fast neutron findings for a range of charged particle radiations (e.g. protons, deuterons, helium, neon or carbon) at varying energies and with mixtures of low- and high-LET, as will be found by spreading the Bragg peaks during charged particle therapy. The carbon ions pioneered in Japan have RBE values in the spread out Bragg peak close to those of fast neutrons with LET of around 85 KeVµM−1 [15], and the general trends found in the current paper are consistent with the in vitro carbon ion data published by Suzuki et al [17].
The model presented can, in principle, act as a hypothesis for direct testing in experiments designed to confirm or disprove these findings. Such work is vital to extend the application of ion beam therapies for cancer [18-21]. Ideally, a wide range of experiments should be performed to determine the parameters that link (α/β)L to RBE at the various mixtures of LET values obtained with each particle therapy beam, and to find how these relate to the average LET at volume element in the treatment planning process.
Appendix A
Symbols used are summarised in Table 2. It has previously been shown that RBEmax and RBEmin act as multipliers of the low-LET α and β parameters. Application of limit theory [3,4,17] shows how these parameters have the following identities (note that the subscripts L and H refer to low- and high-LET radiations respectively):
 |
(A1) |
so that
 |
and
 |
so that
 |
(A4) |
It follows, by dividing Equation A2 by Equation A4, that
 |
(A5) |
Rearrangements of this last equation allow RBEmax and RBEmin to be expressed as:
 |
(A6) |
and
 |
(A7) |
where the replacements Q and S are
 |
and
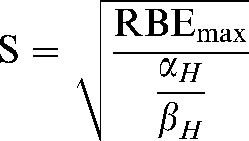 |
(A9) |
Here Q and S are treated as constants which represent the average value of their component parameters in the populations studied.
However, the relevant physics and biology imposes limits on the ranges of these parameters, for example Rmax values <2 are not to be expected in fast neutrons, and RBEmin values close to 0 cannot occur. The domains (or phase plane) of the functions must be corrected so that values in unallowed regions cannot occur. Consequently, Equations A6 and A7 are modified by imposing a lower boundary condition, while preserving the reciprocal and direct square functions, respectively:
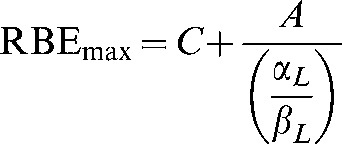 |
(A10) |
and
 |
(A11) |
Where C is the minimum possible value of RBEmax and K is the minimum possible value of RBEmin for a particular quality of radiation and A and B are coefficients that determine the slope of the change in RBEmax and RBEmin, respectively. These additional parameters on the right-hand side of Equations A10 and A11 can be estimated from the data sets.
Appendix B
Variable RBE values are found by solving for dL in the isoeffective BED relationship:
Low-LET bioeffective dose = high-LET bioeffective dose which is represented by:
 |
(A12) |
The variable RBE is then obtained by dividing by dH so that:
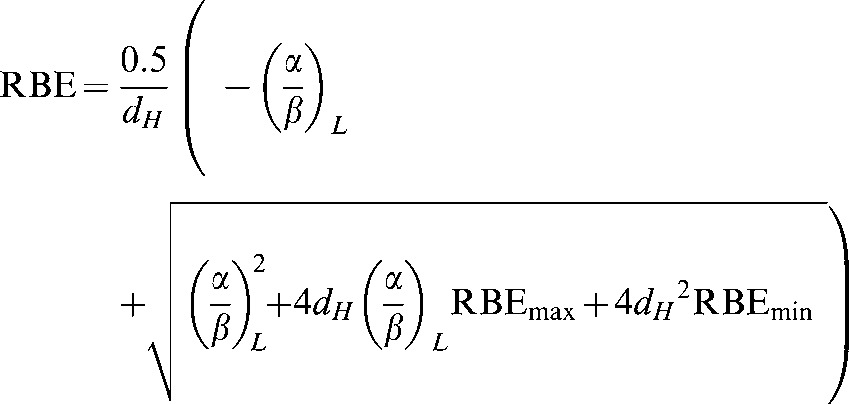 |
(A13) |
It then follows that RBEmax and RBEmin can be replaced by the equations in Appendix A (Equations A10 and A11) to give:
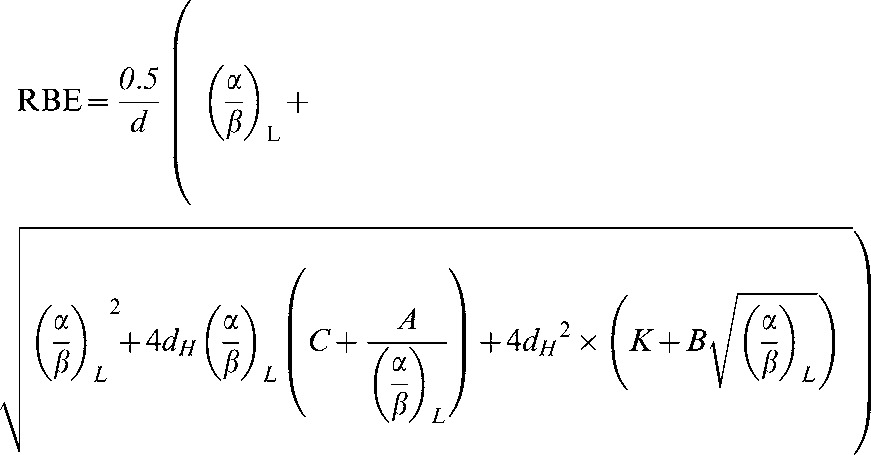 |
(A14) |
RBE can then be plotted against low-LET α/β.
Appendix C
Position of cross-over points of RBE with dose per fraction.
Here the RBEs will be equal for all (α/β)L values, for which, to simplify the equations, the symbol k is used instead of α/β, with k1 and k2 representing two different low-LET α/β ratios:
 |
So that:
 |
from which a solution can be obtained for dH. This is best calculated using computer software as the equation for the solution is rather long.
There is a unique solution for the cross-over points for each pair of α/β ratios.
References
- 1.Jones B, Dale RG, Carabe-Fernandez A. Charged particle therapy for cancer: the inheritance of the Cavendish scientists? Appl Radiat Isot 2009;67:371–7 [DOI] [PubMed] [Google Scholar]
- 2.Dale RG, Jones B, Carabe-Fernandez A. Why more needs to be known about RBE effects in modern radiotherapy. Appl Radiat Isot 2009;67:387–92 [DOI] [PubMed] [Google Scholar]
- 3.Warenius HM, Britten RA, Peacock JH. The relative cellular radiosensitivity of 30 human in vitro cell lines of different histological type to high LET 62.5 MeV (p−>Be+) fast neutrons and 4 MeV photons. Radiother Oncol 1994;30:83–94 [DOI] [PubMed] [Google Scholar]
- 4.Carabe-Fernandez A, Dale RG, Jones B. The incorporation of the concept of minimum RBE (RBEmin) into the linear-quadratic model and the potential for improved radiobiological analysis of high-LET treatments. Int J Radiat Bio 2007;83:27–39 [DOI] [PubMed] [Google Scholar]
- 5.Terry NHA, Denekamp J, Maughan RL. RBE values for colorectal injury after caesium 137 gamma-ray and neutron irradiation. II. Fractionation up to ten doses. Br J Radiol 1984;57:617–29 [DOI] [PubMed] [Google Scholar]
- 6.Jones B. The apparent increase in the β-parameter of the linear quadratic model with increased linear energy transfer during particle irradiation. Br J Radiol 2010;83:433–6 [DOI] [PMC free article] [PubMed] [Google Scholar]
- 7.Duncan W. An evaluation of the results of neutron therapy trials. Acta Oncol 1994;33:299–306 [DOI] [PubMed] [Google Scholar]
- 8.Batterman JJ, Breur K, Hart GAM, van Peperzeel HA. Observations on pulmonary metastases in patients after single and multiple fractions of fast neutrons and cobalt 60 gamma rays. Eur J Cancer 1981;17:539–48 [DOI] [PubMed] [Google Scholar]
- 9.Hawkins RB. A microdosimetric-kinetic model for the effect of non-Poisson distribution of lethal lesions on the variation of RBE with LET. Radiation Research 2003;160:61–6 [DOI] [PubMed] [Google Scholar]
- 10.Hawkins RB. The relationship between the sensitivity of cells to the high energy photons and the RBE of particle radiation used in radiotherapy. Radiat Res 2009;172:761–76 [DOI] [PubMed] [Google Scholar]
- 11.Paganetti H, Gerweck LE, Goitein M. The general relation between tissue response to x-radiation (α/β values) and the relative biological effectiveness (RBE) of protons: prediction by the Katz track structure model. Int J Radiat Biol 2000;76:985–98 [DOI] [PubMed] [Google Scholar]
- 12.Scholz M, Kraft G. Track structure and the calculation of biological effects of heavy charged particles. Adv Space Res 1996;18:5–14 [DOI] [PubMed] [Google Scholar]
- 13.Beuve M, Alphonse G, Maalouf M, Colliaux A, Battiston-Montagne P, Jalade P, et al. Radiobiologic parameters and local effect model predictions for head-and-neck squamous cell carcinomas exposed to high linear energy transfer ions. Int J Radiat Oncol Biol Phys 2008;71:635–42 [DOI] [PubMed] [Google Scholar]
- 14.Kanai T, Furusawa Y, Fukutsu K, Itsukaichi H, Eguchi-Kasai K, Ohara H. Irradiation of mixed beam and design of spread-out Bragg peak for heavy-ion radiotherapy. Radiat Res 1997;147:78–85 [PubMed] [Google Scholar]
- 15.Paganetti H, Niemierko A, Ancukiewicz M, Gerweck LE, Goitein M, Loeffler JS, et al. Relative biological effectiveness (RBE) values for proton beam therapy. Int J Radiat Oncol Biol Phys 2002;53:407–21 [DOI] [PubMed] [Google Scholar]
- 16.Paganetti H. Significance and implementation of RBE variations in proton beam therapy. Technol Cancer Res Treat 2003;2:413–26 [DOI] [PubMed] [Google Scholar]
- 17.Suzuki M, Kase Y, Yamaguchi H, Kanai T, Ando K. Relative biological effectiveness for cell-killing effect on various human cell lines irradiated with heavy-ion medical accelerator in CHIBA (HIMAC) carbon ion beams. Int J Radiat Oncol Biol Phys 2000;48:241–50 [DOI] [PubMed] [Google Scholar]
- 18.Jones B. The potential clinical advantages of charged particle radiotherapy using protons or light ions. Clin Oncol (R Coll Radiol) 2008;20:555–63 [DOI] [PubMed] [Google Scholar]
- 19.Tsujii H, Mizoe J, Kamada T, Baba M, Tsuji H, Kato S, et al. Clinical results of carbon ion radiotherapy at NIRS. J Radiat Res 2007;48(Suppl.):A1–A13 [DOI] [PubMed] [Google Scholar]
- 20.Schultz-Ertner D, Tsujii H. Particle radiation therapy using proton and heavier ion beams. J Clin Oncol 2007;25:953–64 [DOI] [PubMed] [Google Scholar]
- 21.Jones B, Carabe-Fernandez A, Dale RG. Calculation of high-LET radiotherapy dose required for compensation of overall treatment time extensions. Br J Radiol 2006;79:254–7 [DOI] [PubMed] [Google Scholar]


