

Abstract
This article reviews the recent developments in echocardiography that have maintained this technology at the forefront of day-to-day imaging in clinical cardiology. The primary reason for most requests for imaging in cardiovascular medicine is to assess left ventricular structure and function. As our understanding of left ventricular mechanics has become more intricate, tissue Doppler and speckle tracking modalities have been developed that deliver greater insights into diagnosis of cardiomyopathy and earlier warning of ventricular dysfunction. Increased accuracy has been achieved with the dissemination of real-time three-dimensional echocardiography, which has also acquired a central role in the pre-operative assessment of patients prior to reparative valvular surgery. The use of contrast has broadened the indications for transthoracic echocardiography and has increased the accuracy of stress echocardiography, while reducing the number of patients who cannot be scanned because of a limited acoustic window. Finally, echocardiography will be seen in the future not only as a diagnostic tool in those affected by cardiovascular disease but also as a method for prediction of risk and perhaps activation of targeted treatment.
Echocardiography is one of the most commonly performed cardiac investigations. It is a group of interrelated applications of ultrasound applied specifically to the heart, and is most often the first imaging modality to be used on any patient presenting with suspected cardiovascular disease. The annual number of standard transthoracic echocardiograms (TTE) performed ranges from 9167 per million in Wales to 15 294 per million in Northern Ireland; this number has increased rapidly over the past decade and continued growth is expected [1]. The large majority of echocardiograms are performed by cardiac physiologists, and over 88% are reported by them [2].
To a large extent, the progressive increase in use of echocardiography mirrors the decline in the clinical examination skills previously required for diagnosis in cardiology [3]. There are several reasons for this decline in clinical technique. First, it is generally recognised that the clinical diagnosis of many common cardiac conditions, such as pericardial effusion, early ventricular dysfunction, early cardiomyopathy and silent valve disease, is a challenge to the most experienced clinician, whereas these conditions are rapidly diagnosed by echocardiography [4]. Second, early aetiological diagnosis leads to the rapid institution of an appropriate management plan: the frequency of cardiovascular misdiagnosis in unselected patients who died in hospital has halved over the past 20 years and this decrease has paralleled the increasing use of echocardiography [5]. Third, unsuspected and not clinically apparent abnormalities are regularly detected by echocardiography and may have an important bearing on therapeutic decisions and outcome [6]. Miniaturisation has meant that studies can be carried out anywhere, with good quality images obtained from high specification portable machines when used by experienced sonographers.
The appropriateness criteria for transthoracic and transoesophageal echocardiography are extensive, with high ratings for the general evaluation of cardiac structure and function in patients with breathlessness, for evaluation of left ventricular (LV) function, for the diagnosis and management of valvular heart disease, and for the evaluation of hypertension and cardiomyopathy, to name only a few indications [7]. This article seeks to outline the advanced techniques in echocardiography that are now available and to relate their use to a specific clinical condition as an illustration of how they can be beneficial in clinical practice.
Tissue Doppler imaging
Standard blood-pool Doppler studies (pulse or continuous wave) filter out the low Doppler shift frequencies of high energy that are reflected from the surrounding myocardium. Tissue Doppler imaging (TDI) developed with the use of filters to remove high Doppler shift frequencies of low energy that are reflected from the blood pool, focusing study onto the surrounding cardiac muscle. In other words, TDI is a preset that excludes the smaller amplitude but faster wave reflections from blood, focusing on higher amplitude but slower signal from the muscle. TDI is a method of rapid quantification of myocardial velocity, acceleration and displacement that has lent new insights into systolic and diastolic function. Following on from simple pulse TDI, velocity-based interrogation of myocardial deformation has developed with the measurement of strain and strain rate in a single dimension through to the use of speckle tracking imaging of myocardial deformation with measurement of LV torsion and twist.
Systolic function
TDI produces a myocardial time–velocity curve that can be reconstructed either online as spectral pulsed TDI or offline from two-dimensional (2D) colour-coded TDI image loops (Figure 1). Most published studies have used TDI to examine the long axis function of the heart from the transthoracic apical acoustic window, from which can be derived a peak systolic myocardial velocity (s'), an early myocardial relaxation velocity (e') and a late myocardial relaxation velocity (a'). These time–velocity profiles are usually recorded from the mitral valve annulus or from the six basal and mid-LV segments of the LV, and from the tricuspid valve annulus or from the basal and mid segments of the right ventricle (RV) free wall.
Figure 1.

The trace from a pulse tissue Doppler sample placed at the anterolateral mitral valve annulus in the apical four chamber acoustic window. The trace is a time–velocity display showing the direction and velocity of the annulus as it travels throughout the cardiac cycle, with the x-axis representing time and the y-axis representing velocity (cm s–1). The S velocity is the speed of systolic displacement of the mitral valve annulus towards the apex of the left ventricle (LV), with movement towards the transducer represented as a positive value. The e' is the speed of myocardial relaxation in early diastole away from the transducer and is shown as a negative value. On this trace, the ratio of the early filling of the LV on blood-pool Doppler (E) and the early myocardial relaxation velocity on tissue Doppler (lateral e') (i.e. E/lateral e') is consistent with normal left ventricular end-diastolic pressure.
The importance of these time–velocity profiles can be understood only in the context of the normal function of the LV. The apex of the LV is fixed with respect to the chest wall. Co-ordinated contraction of longitudinal, circumferential and radial fibres pulls the annuli of the mitral and tricuspid valves down to the apex in a wringing motion during systole. Immediately following aortic valve closure, cardiomyocytes actively relax using stored energy to lengthen and untwist, creating a negative pressure gradient that sucks blood into the LV during diastole. Thus, longitudinal movement is a vital component both of normal ventricular contraction and of relaxation, with recent data indicating that displacement in the atrioventricular (AV) plane is responsible for producing 60% of the LV stroke volume [8]. This long axis function may be used as an index of both LV and RV ejection fraction, but is now used much more widely as an early indicator of myocardial dysfunction [9].
Most of the fibres within the LV are circumferential, but there is a preponderance of longitudinal fibres within the subendocardium. As a result, the subendocardium makes a disproportionate, substantial contribution to long axis function. As the myocardium is perfused from epicardium to endocardium, these fibres are particularly susceptible both to ischaemia and to other disease processes. In fact, reduction in long axis function is often associated with normal wall thickening and with exaggerated amplitude of epicardial motion. In other words, a fall in long axis velocities may be accompanied by an increase in radial velocities and an overall preservation of global left ventricular ejection fraction (LVEF) in early disease [10]. Hence, a reduction in longitudinal s' appears to carry independent prognostic information beyond the impact of LVEF in hypertension [11], heart failure [12] and coronary artery disease [13]. The predictive utility of pulsed Doppler TDI is not restricted to ischaemia; for example, TDI not only falls before any change in LVEF in severe mitral regurgitation [14] but also predicts those patients in whom LVEF will fall following mitral valve replacement [15].
Diastolic function
The optimal performance of the LV depends on its ability to switch between a compliant chamber in diastole, which allows filling from low left atrial pressure, and a stiff chamber in systole, which ejects the stroke volume at arterial pressures. Elevated LV filling pressures are the main physiological consequence of LV diastolic dysfunction. The LV filling pressure is considered elevated when the LV end-diastolic pressure is above 16 mmHg or when the pulmonary capillary wedge pressure is above 12 mmHg [16]. Blood-pool Doppler recorded at the tips of the mitral valve has been used for many years to assess diastolic relaxation, but LV filling patterns have a U-shaped association with LV filling pressures that has hampered the reliable clinical use of these echocardiograms. Early myocardial relaxation velocities, in particular the ratio of E/e', provide a reliable assessment of elevated filling pressure in those with a normal LV EF [17]. Moreover, measurement of e' at the septal and lateral annulus are core components in the grading of LV diastolic function [18]. Tissue Doppler imaging is able to deliver a temporal resolution of around 4 ms, sufficient to accurately detect changes in diastolic relaxation, whereas the naked eye can only detect changes that take longer than 80 ms and is much too slow to detect abnormal diastolic function.
Interference in long axis function that is sufficient to impair myocardial relaxation velocities may be more important as a marker of early disease than systolic velocities or LVEF. For example, LV hypertrophy (LVH) is absent in a significant number of patients with causal mutations for hypertrophic cardiomyopathy. In those patients who have causal mutations but no LVH, the e' is lower than that in control subjects [19]. Perhaps more importantly, a reduction in e' in the absence of LVH also predicts those who go onto develop regional asymmetrical hypertrophy [20]. Similar changes in e' have been used to detect other early inherited cardiomyopathies, including Fabry's disease and cardiomyopathies in Duchenne and Becker muscular dystrophies, before the appearance of the classical phenotype [21].
Velocity-based myocardial deformation
Tissue velocities are now measured widely in clinical practice but suffer from the limitation that they can be normal despite the presence of severe disease. For example, tissue velocity profiles may be normal where a non-contractile or poorly contracting ischaemic LV segment is tethered to an adjacent normal LV segment, which may be hypercontractile to compensate. This ability of contraction in adjacent segments to influence the velocity in any given segment limits the site specificity of velocity data. Rather than examining the motion of a segment relative to the transducer, myocardial motion may be measured relative to the adjacent myocardium. The instantaneous gradient of velocity along a sample length may be quantified by performing a regression calculation on the velocity data from adjacent sites along the scan line, and these instantaneous data may then be combined to generate a strain-rate curve (Figure 2). Integration of this curve provides instantaneous data on deformation (i.e. shortening or lengthening) that represents strain (Figure 3). Strain is a measure of tissue deformation, whereas strain rate is a measure of the time course of that deformation. These techniques have found a particular role in the assessment of regional myocardial infarction and ischaemia, and in distinguishing stunned from transmural infarction [22].
Figure 2.

The trace from a speckle-tracking image of the left ventricle in the apical acoustic window demonstrating strain-rate curves for the six myocardial segments analysed in the apical four chamber view. The trace is a time–velocity display, with the x-axis representing time and the y-axis representing velocity (s–1). Negative systolic strain-rates below the x = 0 line (averaged over all segments) reflect the rate of shortening of myocardial fibres towards the apex (during phase SRS), whereas the two positive strain rate peaks above the line indicate myocardial lengthening in diastole, which happens in two phases (SRE and SRA). Timings are important to the interpretation of these time–velocity strain-rate curves: “AVC” is marked on this trace to indicate aortic valve closure and the onset of diastole. The shape of these velocity displacements is the mirror image of the pulse tissue Doppler sample (Figure 1).
Figure 3.

The trace from a speckle-tracking image of the left ventricle in the apical acoustic window demonstrating strain curves for the six myocardial segments analysed in the apical four chamber view. The trace is a time–displacement display, with the x-axis representing time and the y-axis showing shortening of the myocardium as negative and lengthening as positive (%). Systolic strain for each of the six segments is below the x = 0 line because this represents maximal compression of the myocardial fibres during systole—negative is good.
Speckle-based myocardial deformation
Velocity-based assessment of myocardial deformation has limitations based on alignment of the Doppler signal, the sensitivity to signal noise and the fact that any derived strain and strain-rate data are unidirectional along the signal line. This has led to the increasing replacement of these techniques with speckle tracking techniques, which use ultrasound reflectors within tissue that behave like tags placed on the myocardium. Shortening and lengthening (strain and strain rate) may be calculated by comparison of these speckles from frame to frame, and the calculations are not restricted to a single dimension but may be used to gather data in two dimensions. This speckle-tracking produces data on myocardial deformation that are equivalent to those provided by tagged cardiac magnetic resonance (CMR). Moreover, the data are collected during simple B-mode acquisition, so acquisition does not require a specific preset. Speckle-tracking has delivered improvements in diagnosis of regional myocardial ischaemia [23] and in separating hibernating myocardium from infarction [24]. Perhaps the greatest potential of this technique now lies not only in the evaluation of myocardial strain and strain rate but also in understanding the importance of LV twist to normal myocardial function [25] (Figure 4). While speckle-tracking is superior to tissue Doppler with regard to angle dependency and noise, accurate results continue to be dependent on good quality 2D echocardiographic images and on adequate frame rates. Low frame rates result in unstable speckle patterns, whereas high frame rates reduce scan-line density and reduce image resolution. Longitudinal movement of the LV may result in a loss of tracking as speckles move out of the plane of the image, particularly when studying radial strain, although this limitation may be overcome by the advent of three-dimensional (3D) speckle-tracking [26].
Figure 4.

(a) The trace from a speckle tracking image of the left ventricle (LV) acquired from the parasternal acoustic window in the short axis at the apex of the LV. The trace is a time–rotation curve, showing the direction and degree of rotation of the apex throughout the cardiac cycle, with the x-axis representing time and the y-axis representing rotation (degrees). Counter-clockwise rotation is represented above the line (positive) and clockwise rotation below the line (negative). (b) A similar image is taken at the mitral level, with the normal clockwise rotation of the basal myocardium shown in purple. Subtraction of negative basal clockwise rotation from positive apical rotation produces a curve showing the degree of ventricular twist throughout the cardiac cycle (white).
3D echocardiography
Acquisition of 3D echocardiographic images of the heart were first reported in 1974, but evolution of the technique from complex post-processed data sets to real-time 3D image acquisition has meant that 3D echocardiography (3DE) is now integrated into routine practice. Improvements in microprocessing and the development of fully sampled matrix arrays with more than 3000 elements has meant that full cardiac volumes can be acquired in a single cardiac cycle. Currently, 3DE is an advance in ultrasound technology that provides information supplemental to standard 2D echocardiography (2DE) in certain clinical situations. It is not yet at the stage where 2DE can be replaced.
Quantifications of chamber size, ventricular mass and function are the most clinically important and most frequent task for echocardiography. Although 2D LVEF is meaningful when applied across populations or to stratify risk in individuals, its value as a sequential test within an individual is constrained by limited test–retest reliability. 2DE measurement of LVEF by the summation of discs is the preferred method for the assessment of LV function, but its reliability is reduced by the geometric assumptions made and by plane foreshortening errors [27]. In practice, this means that LVEF may vary between studies by 7–10%; this is too much in an age when the use of expensive device therapy (cardiac resynchronisation and implantable cardio-defibrillator therapy) is guided by such measurements [28]. 3DE measures chamber size, ventricular mass and function with the same accuracy and reproducibility as CMR and radionuclide ventricolography [29] (Figure 5). 3DE full volume data sets also give accurate information regarding atrial volumes and regional dyssynchrony [30]. The main limitation from a practical perspective is that current 3D transducers have a larger footprint than standard 2D probes, and an adequate acoustic window may not be obtained in all patients. This limitation is decreasing in importance with the advent of new, smaller transducers with the same footprint as 2DE probes and with the combined use of 3DE with contrast [29].
Figure 5.

A three-dimensional reconstruction of the left ventricle (LV). This image shows the tri-plane reconstruction of the LV to ensure correct identification of the left ventricular apex. At the bottom of the image is a time curve identifying time to minimum systolic volume for the LV. Regional time to minimum systolic interval can be calculated for all 16 segments of the left ventricle, enabling an index of dyssynchronous contraction to be calculated.
3DE has become central to the assessment of valve structure and function. As mitral valve repair becomes more commonplace, accurate pre-operative imaging is vital to surgical planning. 2D transoesophageal echocardiography (TOE) has been the gold standard for mitral valve assessment because it provides high spatial resolution, but 3D transthoracic echocardiography is comparable [31]. 3D transthoracic echocardiography has a proven role in accurate planimetry of mitral and aortic stenosis, and is increasingly used in quantifying the severity of valvular lesions.
Interventional echocardiography
The development of 3D TOE has re-invigorated the use of echocardiography in guiding non-coronary cardiac interventions. 2D TOE has an established role in the pre-operative planning and peri-operative soft-tissue monitoring required for percutaneous device closure of both patent foramen ovale and atrial septal defects [32]. The success of the percutaneous closure procedure largely relies on the accurate assessment of the defect size, rim lengths and relationship to nearby cardiac structures, which can be provided by 2D TOE, which thereby enhances decision-making, shortens fluoroscopy time and reduces procedural complication rates. The use of 2D TOE is also increasing during transcatheter closure of muscular and perimembranous ventricular septal defects, including post-myocardial infarction defects. 3D TOE adds value to 2D TOE during these percutaneous procedures by avoiding the need for the operator to mentally reconstruct multiplanar images [33]. Both 2D and 3D TOE have extended the role of the echocardiographer in the catheter laboratory to include guiding the implantation of devices, thereby minimising fluoroscopy times and optimising patient outcomes. Both forms of TOE are employed during the insertion of left atrial appendage occlusion devices, which are used to reduce stroke risk in those unable to take warfarin [34]. Both 2D and 3D TOE have become widely used in the monitoring of transcatheter mitral valve repair and in transcatheter aortic valve implantation in patients rejected for conventional valve surgery [35] (Figure 6). Intracardiac echocardiography (ICE) is a further development that acquires and displays images of the heart using a variety of views: cross-sectional, sector-based or forward-looking endoscopic views. ICE tools are catheter-based endocardial imaging systems that are inserted through the venous system to provide imaging guidance in the near field, most often during trans-septal puncture [36]. The main limitation to the wider use of ICE has been the cost of single-use transducers, but coupling the ICE tool with the catheters that deliver treatment may improve cost-efficacy. Thus, the use of echocardiography has become sufficiently common during both conventional cardiothoracic surgery and in the catheter laboratory for “interventional echocardiography” to become a subspecialty in its own right.
Figure 6.

A still frame from a real-time three-dimensional image of the implantation of a transcatheter aortic valve. The white arrows indicate the outer limits of the valve on the wire in the aorta before its deployment by balloon expansion.
Contrast echocardiography
In a significant number of patients, particularly the obese and those with chronic lung disease, echocardiography fails to deliver diagnostically useful images despite the use of second harmonic imaging. This has led to the development of echocardiographic contrast agents, which consist of microbubbles of encapsulated high-molecular-weight gas. Reflection and backscatter of the ultrasound from these microbubbles produce intense echocardiographic signals that enhance the LV cavity relative to the surrounding myocardium. The use of second harmonic imaging in echocardiography requires high-power ultrasound, which destroys or bursts most contrast, and this in turn has led to the use of specific contrast-imaging modalities that employ a low mechanical index. These modalities include power modulation, pulse inversion and cadence imaging. In essence, multiple pulses are transmitted down each scan line but sequential pulses are out of phase with the preceding by a fixed amount (e.g. 180°). Myocardial tissue is a relatively predictable scatterer, whereas contrast microbubbles are “non-linear”. When a transducer receives alternate backscattered signals with a predictable variation in amplitude, these can be suppressed as being from tissue and only the non-linear signals from the microbubbles are displayed. Contrast echocardiography is most useful in producing clear endocardial border definition and can be used to evaluate myocardial perfusion (Figure 7).
Figure 7.

Contrast in the left ventricle during stress echocardiography. This image was taken after infusion of dobutamine at 40 μg kg–1 min–1 for 3 min to achieve the maximum heart rate for the patient. The white arrow indicates delay in the apical anterolateral wall, which reflects ischaemia.
There is extensive evidence to show that the use of contrast improves the accuracy and reliability of echocardiographic assessment of LV volumes and function [37]. Contrast echocardiography produces LV volume measurements that are analogous to those measured with CMR, whereas harmonic imaging consistently underestimates true LV volumes [38]. Improved endocardial definition also leads to improved sensitivity and accuracy in the detection of coronary artery disease during stress echocardiography [39]. Contrast opacification is of particular importance for the investigation of apical LV abnormalities. Tissue harmonic signals are weak in the near field of the ultrasound sector, meaning that native echocardiography can miss apical hypertrophic cardiomyopathy and LV non-compaction. The use of contrast doubles the detection rate for apical thrombus, although it can still miss small volume clots and mural thrombus [40] (Figure 8).
Figure 8.
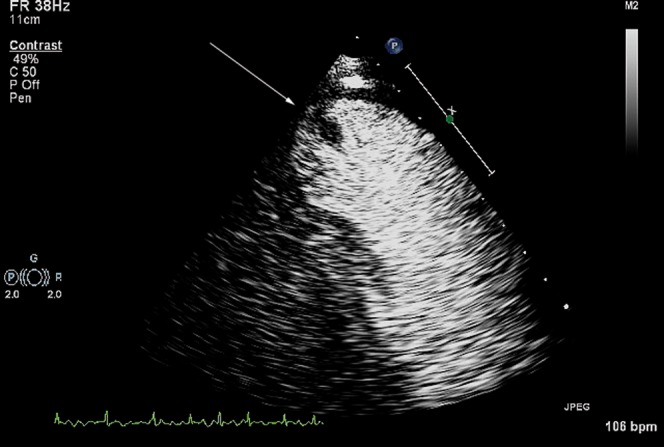
Contrast within the left ventricle is used to identify a thrombus (white arrow), seen here attached to the relatively thinned apex of a man following anterior myocardial infarction.
Contrast echocardiography has led to the development of quantitative assessment of myocardial blood flow, a use that is moving out of research into the clinical arena. More than 90% of myocardial blood volume sits within the capillaries. Myocardial contrast intensity reflects the concentration of microbubbles within the myocardium. When the myocardium is saturated with contrast during continuous infusion, the signal intensity reflects total myocardial blood volume. Following destruction of microbubbles in the myocardium by a high power output, replenishment of the contrast can be documented and reflects myocardial blood flow. This technique of destruction and replenishment has been used to improve the sensitivity and specificity of stress echocardiography in the diagnosis of coronary artery disease [41]. As myocardial contrast echocardiography provides simultaneous assessment of wall motion and resting perfusion, it also adds significantly to the detection of acute coronary syndromes [42]. Since capillary integrity is a vital component of myocardial viability, loss of contrast intensity and reduction in myocardial blood flow is also an accurate measure of scar formation after myocardial infarction, with a predictive accuracy for recovery of function similar to that of gadolinium-enhanced CMR [41].
Future directions
Despite improvements in primary and secondary prevention, serious cardiovascular events, including unstable angina and myocardial infarction, account for one-third of all deaths worldwide. Therefore, identifying individuals who have vulnerable atherosclerotic plaque that is at high risk of rupture continues to be a major aim for cardiovascular imaging. While CMR and multislice CT are being focused on the ability to detect morphological changes that are associated with instability, contrast echocardiography is being used to detect changes in function that are associated with atherosclerotic plaques by visualising biological activity. Activation of the arterial endothelium in response to injury or inflammation is a vital event in the ischaemic cascade, and gas-filled particle contrast agents have been developed to target either activated leukocytes or endothelial cell adhesion molecules that are prevalent in ischaemic syndromes. The ability to image disease at the molecular level has huge potential, not only for early diagnosis and risk stratification but also for the potential local delivery of therapy. These molecular ultrasound approaches have largely been tested in animals: the techniques are feasible but have some way to go before appearing on the clinical stage [43].
Conclusion
While all cardiac imaging modalities continually improve, echocardiography remains at the forefront in providing unique clinical information that is readily available and portable. This place has been maintained by the continual introduction and validation of new technology, together with the extension of existing diagnostic methods to new fields. Clinical application of these new technologies has been widespread, partly as a result of the lack of inherent harmful effects, and there is no sign that the demand for echocardiography is abating.
References
- 1.Boon N, Norell M, Hall J, Jennings K, Penny L, Wilson C, et al. National variations in the provision of cardiac services in the United Kingdom: second report of the British Cardiac Society Working Group, 2005. Heart 2006;92:873–8 [DOI] [PMC free article] [PubMed] [Google Scholar]
- 2.Macdonald MR, Hawkins NM, Balmain S, Dalzell J, McMurray JJ, Petrie MC. Transthoracic echocardiography: a survey of current practice in the UK. QJM 2008;101:345–9 [DOI] [PubMed] [Google Scholar]
- 3.Lok CE, Morgan CD, Ranganathan N. The accuracy and interobserver agreement in detecting the ‘gallop sounds’ by cardiac auscultation. Chest 1998;114:1283–8 [DOI] [PubMed] [Google Scholar]
- 4.Roelandt JR. Ultrasound stethoscopy: a renaissance of the physical examination? Heart 2003;89:971–3 [DOI] [PMC free article] [PubMed] [Google Scholar]
- 5.Sonderegger-Iseli K, Burger S, Muntwyler J, Salomon F. Diagnostic errors in three medical eras: a necropsy study. Lancet 2000;355:2027–31 [DOI] [PubMed] [Google Scholar]
- 6.Bossone E, DiGiovine B, Watts S, Marcovitz PA, Carey L, Watts C, et al. Range and prevalence of cardiac abnormalities in patients hospitalized in a medical ICU. Chest 2002;122:1370–6 [DOI] [PubMed] [Google Scholar]
- 7.Douglas PS, Khandheria B, Stainback RF, Weissman NJ, Brindis RG, Patel MR, et al. ACCF/ASE/ACEP/ASNC/SCAI/SCCT/SCMR 2007 appropriateness criteria for transthoracic and transesophageal echocardiography: a report of the American College of Cardiology Foundation Quality Strategic Directions Committee Appropriateness Criteria Working Group, American Society of Echocardiography, American College of Emergency Physicians, American Society of Nuclear Cardiology, Society for Cardiovascular Angiography and Interventions, Society of Cardiovascular Computed Tomography, and the Society for Cardiovascular Magnetic Resonance endorsed by the American College of Chest Physicians and the Society of Critical Care Medicine. J Am Coll Cardiol 2007;50:187–204 [DOI] [PubMed] [Google Scholar]
- 8.Carlsson M, Ugander M, Heiberg E, Arheden H. The quantitative relationship between longitudinal and radial function in left, right, and total heart pumping in humans. Am J Physiol Heart Circ Physiol 2007;293:H636–44 [DOI] [PubMed] [Google Scholar]
- 9.Alam M, Wardell J, Andersson E, Samad BA, Nordlander R. Effects of first myocardial infarction on left ventricular systolic and diastolic function with the use of mitral annular velocity determined by pulsed wave Doppler tissue imaging. J Am Soc Echocardiogr 2000;13:343–52 [DOI] [PubMed] [Google Scholar]
- 10.Fang ZY, Leano R, Marwick TH. Relationship between longitudinal and radial contractility in subclinical diabetic heart disease. Clin Sci (Lond) 2004;106:53–60 [DOI] [PubMed] [Google Scholar]
- 11.Wang M, Yip GW, Wang AY, Zhang Y, Ho PY, Tse MK, et al. Tissue Doppler imaging provides incremental prognostic value in patients with systemic hypertension and left ventricular hypertrophy. J Hypertens 2005;23:183–91 [DOI] [PubMed] [Google Scholar]
- 12.Nikitin NP, Loh PH, Silva R, Ghosh J, Khaleva OY, Goode K, et al. Prognostic value of systolic mitral annular velocity measured with Doppler tissue imaging in patients with chronic heart failure caused by left ventricular systolic dysfunction. Heart 2006;92:775–9 [DOI] [PMC free article] [PubMed] [Google Scholar]
- 13.Wang M, Yip GW, Wang AY, Zhang Y, Ho PY, Tse MK, et al. Peak early diastolic mitral annulus velocity by tissue Doppler imaging adds independent and incremental prognostic value. J Am Coll Cardiol 2003;41:820–6 [DOI] [PubMed] [Google Scholar]
- 14.Neilan TG, Ton-Nu T-T , Kawase Y, Yoneyama R, Hoshino K, del Monte F, et al. Progressive nature of chronic mitral regurgitation and the role of tissue Doppler-derived indexes. Am J Physiol Heart Circ Physiol 2008;294:H2106–11 [DOI] [PubMed] [Google Scholar]
- 15.Agricola E, Galderisi M, Oppizzi M, Schinkel AF, Maisano F, De Bonis M, et al. Pulsed tissue Doppler imaging detects early myocardial dysfunction in asymptomatic patients with severe mitral regurgitation. Heart 2004;90:406–10 [DOI] [PMC free article] [PubMed] [Google Scholar]
- 16.Brutsaert D, Sys S, Gillebert T. Diastolic failure: pathophysiology and therapeutic implications. J Am Coll Cardiol 1993;22:318–25 [DOI] [PubMed] [Google Scholar]
- 17.Nagueh S, Middleton K, Kopelen H, Zoghbi W, Quinones M. Doppler tissue imaging: a noninvasive technique for evaluation of left ventricular relaxation and estimation of filling pressures. J Am Coll Cardiol 1997;30:1527–33 [DOI] [PubMed] [Google Scholar]
- 18.Nagueh SF, Appleton CP, Gillebert TC, Marino PN, Oh JK, Smiseth OA, et al. Recommendations for the evaluation of left ventricular diastolic function by echocardiography. Eur J Echocardiogr 2009;10:165–93 [DOI] [PubMed] [Google Scholar]
- 19.Nagueh SF, Bachinski LL, Meyer D, Hill R, Zoghbi WA, Tam JW, et al. Tissue Doppler imaging consistently detects myocardial abnormalities in patients with hypertrophic cardiomyopathy and provides a novel means for an early diagnosis before and independently of hypertrophy. Circulation 2001;104:128–30 [DOI] [PMC free article] [PubMed] [Google Scholar]
- 20.Nagueh SF, McFalls J, Meyer D, Hill R, Zoghbi WA, Tam JW, et al. Tissue Doppler imaging predicts the development of hypertrophic cardiomyopathy in subjects with subclinical disease. Circulation 2003;108:395–8 [DOI] [PMC free article] [PubMed] [Google Scholar]
- 21.De Backer J, Matthys D, Gillebert TC, De Paepe A, De Sutter J. The use of tissue Doppler imaging for the assessment of changes in myocardial structure and function in inherited cardiomyopathies. Eur J Echocardiogr 2005;6:243–50 [DOI] [PubMed] [Google Scholar]
- 22.Abraham TP, Dimaano VL, Liang H-Y Role of tissue Doppler and strain echocardiography in current clinical practice. Circulation 2007;116:2597–609 [DOI] [PubMed] [Google Scholar]
- 23.Reant P, Labrousse L, Lafitte S, Bordachar P, Pillois X, Tariosse L, et al. Experimental validation of circumferential, longitudinal, and radial 2-dimensional strain during dobutamine stress echocardiography in ischemic conditions. J Am Coll Cardiol 2008;51:149–57 [DOI] [PubMed] [Google Scholar]
- 24.Becker M, Lenzen A, Ocklenburg C, Stempel K, Kuhl H, Neizel M, et al. Myocardial deformation imaging based on ultrasonic pixel tracking to identify reversible myocardial dysfunction. J Am Coll Cardiol 2008;51:1473–81 [DOI] [PubMed] [Google Scholar]
- 25.Notomi Y, Popovic ZB, Yamada H, Wallick DW, Martin MG, Oryszak SJ, et al. Ventricular untwisting: a temporal link between left ventricular relaxation and suction. Am J Physiol Heart Circ Physiol 2008;294:H505–13 [DOI] [PubMed] [Google Scholar]
- 26.Nesser HJ, Mor-Avi V, Gorissen W, Weinert L, Steringer-Mascherbauer R, Niel J, et al. Quantification of left ventricular volumes using three-dimensional echocardiographic speckle tracking: comparison with MRI. Eur Heart J 2009;30:1565–73 [DOI] [PubMed] [Google Scholar]
- 27.Lang RM, Bierig M, Devereux RB, Flachskampf FA, Foster E, Pellikka PA, et al. Recommendations for chamber quantification: a report from the American Society of Echocardiography's Guidelines and Standards Committee and the Chamber Quantification Writing Group, developed in conjunction with the European Association of Echocardiography, a branch of the European Society of Cardiology. J Am Soc Echocardiogr 2005;18:1440–63 [DOI] [PubMed] [Google Scholar]
- 28.Marwick TH. Techniques for comprehensive two dimensional echocardiographic assessment of left ventricular systolic function. Heart 2003;89:iii2–8 [DOI] [PMC free article] [PubMed] [Google Scholar]
- 29.Mor-Avi V, Sugeng L, Lang RM. Real-time 3-dimensional echocardiography: an integral component of the routine echocardiographic examination in adult patients? Circulation 2009;119:314–29 [DOI] [PubMed] [Google Scholar]
- 30.Kapetanakis S, Kearney MT, Siva A, Gall N, Cooklin M, Monaghan MJ. Real-time three-dimensional echocardiography: a novel technique to quantify global left ventricular mechanical dyssynchrony. Circulation 2005;112:992–1000 [DOI] [PubMed] [Google Scholar]
- 31.Gutiérrez-Chico JL, Zamorano-Gómez JL, Rodrigo-López JL, Mataix L, Pérez deIsla L, Almería-Valera C, et al. Accuracy of real-time 3-dimensional echocardiography in the assessment of mitral prolapse. Is transesophageal echocardiography still mandatory? Am Heart J 2008;155:694–8 [DOI] [PubMed] [Google Scholar]
- 32.Rana BS, Thomas MR, Calvert PA, Monaghan MJ, Hildick-Smith D. Echocardiographic evaluation of patent foramen ovale prior to device closure. JACC Cardiovasc Imaging 2010;3:749–60 [DOI] [PubMed] [Google Scholar]
- 33.van denBosch AE, Ten Harkel DJ, McGhie JS, Roos-Hesselink JW, Simoons ML, Bogers AJ, et al. Feasibility and accuracy of real-time 3-dimensional echocardiographic assessment of ventricular septal defects. J Am Soc Echocardiogr 2006;19:7–13 [DOI] [PubMed] [Google Scholar]
- 34.Shah SJ, Bardo DM, Sugeng L, Weinert L, Lodato JA, Knight BP, et al. Real-time three-dimensional transesophageal echocardiography of the left atrial appendage: initial experience in the clinical setting. J Am Soc Echocardiogr 2008;21:1362–8 [DOI] [PubMed] [Google Scholar]
- 35.Lee AP-W, Lam Y-Y, Yip GW-K, Lang RM, Zhang Q, Yu C-M. Role of real time three-dimensional transesophageal echocardiography in guidance of interventional procedures in cardiology. Heart 2010;96:1485–93 [DOI] [PubMed] [Google Scholar]
- 36.Kim SS, Hijazi ZM, Lang RM, Knight BP. The use of intracardiac echocardiography and other intracardiac imaging tools to guide noncoronary cardiac interventions. J Am Coll Cardiol 2009;53:2117–28 [DOI] [PubMed] [Google Scholar]
- 37.Olszewski R, Timperley J, Cezary S, Monaghan M, Nihoyannopoulis P, Senior R, et al. The clinical applications of contrast echocardiography. Eur J Echocardiogr 2007;8:s13–23 [DOI] [PubMed] [Google Scholar]
- 38.Malm S, Frigstad S, Sagberg E, Larsson H, Skjaerpe T. Accurate and reproducible measurement of left ventricular volume and ejection fraction by contrast echocardiography: a comparison with magnetic resonance imaging. J Am Coll Cardiol 2004;44:1030–5 [DOI] [PubMed] [Google Scholar]
- 39.Moir S, Haluska BA, Jenkins C, Fathi R, Marwick TH. Incremental benefit of myocardial contrast to combined dipyridamole-exercise stress echocardiography for the assessment of coronary artery disease. Circulation 2004;110:1108–13 [DOI] [PubMed] [Google Scholar]
- 40.Weinsaft JW, Kim RJ, Ross M, Krauser D, Manoushagian S, LaBounty TM, et al. Contrast-enhanced anatomic imaging as compared to contrast-enhanced tissue characterization for detection of left ventricular thrombus. JACC Cardiovasc Imaging 2009;2:969–79 [DOI] [PMC free article] [PubMed] [Google Scholar]
- 41.Senior R, Becher H, Monaghan M, Agati L, Zamorano J, Vanoverschelde JL, et al. Contrast echocardiography: evidence-based recommendations by European Association of Echocardiography. Eur J Echocardiogr 2009;10:194–212 [DOI] [PubMed] [Google Scholar]
- 42.Tong KL, Kaul S, Wang X-Q , Rinkevich D, Kalvaitis S, Belcik T, et al. Myocardial contrast echocardiography versus thrombolysis in myocardial infarction score in patients presenting to the emergency department with chest pain and a nondiagnostic electrocardiogram. J Am Coll Cardiol 2005;46:920–7 [DOI] [PubMed] [Google Scholar]
- 43.Lindner JR. Contrast ultrasound molecular imaging of inflammation in cardiovascular disease. Cardiovasc Res 2009;84:182–9 [DOI] [PMC free article] [PubMed] [Google Scholar]