

Abstract
As a result of the rising epidemic of obesity, understanding body fat distribution and its clinical implications is critical to timely treatment. Visceral adipose tissue is a hormonally active component of total body fat, which possesses unique biochemical characteristics that influence several normal and pathological processes in the human body. Abnormally high deposition of visceral adipose tissue is known as visceral obesity. This body composition phenotype is associated with medical disorders such as metabolic syndrome, cardiovascular disease and several malignancies including prostate, breast and colorectal cancers. Quantitative assessment of visceral obesity is important for evaluating the potential risk of development of these pathologies, as well as providing an accurate prognosis. This review aims to compare different methods of measuring visceral adiposity with emphasis on their advantages and drawbacks in clinical practice.
Adipose tissue is loose connective tissue composed of adipocytes and originally derived from lipoblasts. Historically, fat was considered to cushion and insulate the body; however, more recently its critical role in the human body as a form of energy storage and endocrinological signalling has been recognised. Various physiological, psychosocial and clinical factors influence the amount and distribution of the adipose tissue throughout the human body. With the escalating incidence of obesity, a better understanding of fat metabolism and advanced techniques to quantify and characterise adiposity are necessary. The purpose of this review is to discuss the clinical significance of abdominal obesity and to critically evaluate different methods that can be used to identify abdominally obese individuals. With the abundance of modalities that can be used to determine body composition, this review focuses on the most commonly used techniques. Understanding the expediency, advantages and limitations of different body composition tools provides clinicians with a tool-set to characterise the problem of abdominal obesity in patients.
Clinical implications of obesity
Adipose tissue is anatomically distributed in different proportions throughout the human body, and the pattern of distribution is dependent upon many factors including sex, age, race, ethnicity, genotype, diet, physical activity, hormone levels and medication. The percentage of adipose tissue is higher in women, the elderly and overweight individuals [1-6].
Body fat tissue is traditionally distributed into two main compartments with different metabolic characteristics: subcutaneous adipose tissue (SAT) and visceral adipose tissue (VAT). While both of these tissue types are important, particular attention has been directed to visceral adiposity owing to its association with various medical pathologies.
Although fat and adipose tissue are differentiated by distinct biochemical and metabolic features, these terms will be used interchangeably for the purpose of this review. Abdominal obesity, which is characterised as increased adipose tissue surrounding the intra-abdominal organs, is also referred to as visceral or central obesity. It has been distinctly linked to several pathological conditions including impaired glucose and lipid metabolism, insulin resistance [7,8], increased predisposition to cancers of the colon [9], breast [10] and prostate [11], and it is associated with prolonged hospital stays, increased incidence of infections and non-infectious complications, and increased mortality in hospital [12]. Visceral obesity itself is an independent component of metabolic syndrome and the magnitude of obesity directly relates to the prognosis of this condition [7,13,14]. VAT accumulation also determines a comprehensive cardiovascular risk profile and increases the susceptibility to ischaemic heart disease and arterial hypertension [8,15-17]. As a hormonally active tissue, VAT releases different bioactive molecules and hormones, such as adiponectin, leptin, tumour necrosis factor, resistin and interleutin 6 (IL-6). Among these hormones, adiponectin is of particular significance owing to its protective antiangiogenic activity. Circulating adiponectin is inversely correlated with the amount of VAT [18], while decreased concentrations of adiponectin are associated with Type 2 diabetes, elevated glucose levels, hypertension, cardiovascular disease and certain malignancies [7,18]. Consequently, it may be important to complement adiponectin measures with calculations of VAT to better understand the pathogenesis of obesity-related disorders in the human population. As visceral obesity is associated with poor prognosis, metabolic disturbances and degree of pathology in several chronic diseases, it is of great importance to identify methods that quantify adipose tissue accurately and can specifically depict VAT from total adipose tissue.
The necessity for precise and clinically expedient measures for quantifying VAT is evident. However, it is also essential to develop quantitative criteria for defining visceral obesity relative to these metabolic disturbances. To date, these criteria have not been clearly defined in any modality. Currently, techniques for measuring visceral adiposity have ranged from simple, indirect methods of evaluation, such as body mass index (BMI) (weight divided by height squared) to crudely predict visceral adiposity through to CT imaging to provide a cross-sectional area of visceral fat as an accurate and reliable equivalent to visceral fat volume measurement. However, without precise measures of visceral obesity, an index of abdominal obesity cannot be clearly characterised and defined.
Clinically expedient techniques for measuring visceral adiposity often lack precision
Numerous techniques have been developed to assess visceral fat. The most clinically expedient are those that can be performed quickly, provide instant results and can be performed by the bedside without extensive technical training. Anthropometric measures as well as bioelectrical impedance analysis (BIA) are designed to provide expedient, albeit crude, measures of body composition; however, VAT is only an indirect measure when using these approaches. Only CT and MRI can provide direct measures of cross-sectional areas or volumetric measures of VAT.
Anthropometric techniques
BMI is the most commonly used diagnostic tool for characterising generalised obesity [19]. A BMI greater than 25 kg m–2 is defined as overweight while a BMI over 30 kg m–2 is characterised as obese (World Health Organization [62]). Visceral fat cross-sectional area, measured by CT imaging, correlated well (males: r=0.813; females: r=0.825) with normal BMI ranges (18.5–24.9 kg m–2) [19]. Despite the frequent use of BMI, it cannot distinguish between lean and fat body mass and it certainly does not appreciate differences between subcutaneous and visceral fat compartments.
Waist-to-hip ratio (WHR), waist circumference (WC) or sagittal abdominal diameter (the height of the abdomen when the patient is in the supine position) are additional measures used in clinical practice to derive estimates of fat distribution [20]. It is thought that WC represents visceral and subcutaneous fat while hip circumference reflects subcutaneous fat only. With this in mind, it is not surprising that Ashwell et al [21] found a significant correlation between the WHR and the ratio of VAT-to-SAT cross-sectional area (quantified by CT images taken in the abdominal region). In other words, an elevated WHR ratio is associated with a high proportion of intra-abdominal fat. Despite this association, Ashwell and his colleagues [21] did not find a significant correlation between VAT-to-SAT ratios and degree of generalised obesity, which may be attributed to the imprecision of the WHR approach. However, a recent study found WC to be the most reliable surrogate of visceral adiposity across a wide age range in a population with a high incidence of the metabolic syndrome [17].
In adult men and women, the proportion of the body representing intra-abdominal fat was found to increase with age, whereas subcutaneous fat cross-sectional areas had a tendency to increase with the degree of obesity but not with age [22]. Interestingly, men are reported to have a significantly higher percentage of VAT than women [17]. From anthropometric measurements, BMI and WC have demonstrated similar correlations to total, visceral and subcutaneous fat areas in all age categories, whereas correlations between skin-fold measures and intra-abdominal fat areas become weaker with increasing age [22]. Kvist et al [19] examined several relationships between total and visceral fat tissue volumes measured by CT and compared these measurements against BMI and various diameters, circumferences and subcutaneous fat thicknesses of the trunk. They found BMI to be the single superior predictor for total adipose tissue volume with errors of up to 11%. For the prediction of VAT volume, simple equations based entirely on the diameter of the trunk at the third to fifth lumbar vertebrae resulted in up to a 21% variation in both sexes [19]. Kullberg et al [23] found a strong correlation between anthropometric measurements and, in particular, abdominal diameters and VAT assessed with MRI; however, since these measures are usually performed in standing position and MRI images are obtained in a supine position, there are challenges when comparing the two measures. Although anthropometric measurements, such as WHR and sagittal abdominal diameter, are simple and quick indicators of visceral fat accumulation, these indices were fundamentally inaccurate in predicting VAT [19,21,22].
Bioelectrical impedance analysis
BIA is another accessible, safe and cost-efficient method that avoids exposure to radiation and has been widely used to measure body composition in clinical populations [24,25]. However, BIA lacks specificity and accuracy because it is based on differences in resistance when an electrical current is conducted through fat and lean components of the body. Thus, prediction equations are used to determine fat-free mass. While BIA can estimate whole-body fat content, recent attempts to assess the amount of abdominal subcutaneous and visceral fat by BIA indicated significant correlations when compared with precise imaging techniques such as CT [26,27]. However, caution should be taken when interpreting these results as they are based on measurements of fat-free tissue and BIA calculates total fat mass by subtracting fat-free mass from body weight. Lean tissue measurements are influenced by hydration status, which is often a problem in clinical populations, particularly in cancer patients [24,25,28]. If lean tissue measurements by BIA are imprecise, these errors will also confound fat measures. These limitations are the probable basis for the discrepancies that have been identified with dual energy X-ray absorptiometry (DXA) total body fat comparisons with BIA [24]. While BIA and anthropometric methods can be useful in classifying adipose tissue distribution for the initial diagnosis of abdominal obesity for individuals, and for general application in epidemiological studies, these methods have limited potential for accurately measuring visceral fat deposition in a clinical setting.
Dual energy X-ray absorptiometry and air displacement plethysmography
The whole-body imaging technologies of DXA and air displacement plethysmography have received increased attention for their precision and rapid assessment. While they are not necessarily clinically accessible, these modalities are progressively used by researchers. Air displacement plethysmography is a relatively novel technology that is based on pressure–volume relationships to estimate volume and density. DXA measures the attenuation of two energies emitted from the modality to distinguish fat, lean and bone mineral content measures. However, DXA and air displacement plethysmography can only provide estimations of visceral adiposity as they cannot distinguish between different adipose tissue deposits.
Intra-abdominal fat estimated from DXA and anthropometric data in obese women was compared with VAT measurements from single-slice CT images at the fourth to fifth lumbar vertebrae and was found to be inaccurate [20]. In obese women with a greater proportion of upper body fat distribution, the “narrow” location of the WC was difficult to discern on the trunk [20]. In these instances, the umbilicus circumference, which is easy to identify but located inferior to the waist, is typically recorded despite it being a larger value than the waist measurement. This inconsistency may limit the validity of the waist measurement in obese women. The inconsistency in sagittal diameter measurements is another source of inaccuracy because no standard procedures exist for measuring sagittal diameter whereby any difference in body position may also affect the measurement value [20].
Imaging technologies including DXA, MRI and CT have been identified as gold standards in body composition analysis. DXA can accurately detect whole-body fat mass (within 2% coefficient of variation) and has the capacity for regional analysis [24,29]. However, a distinct method for discriminating VAT has yet to be developed with DXA. Given that WHR correlates well with VAT-to-SAT ratios, one would expect that VAT would also correlate well with total or regional trunk fat quantified by DXA. While some studies have found substantially higher correlations (r=0.6–0.8) between VAT and DXA trunk percentage fat [30,31], there are studies that have found no significant correlations [20]. The lack of correlation may be in part due to the method of analysis used with DXA scans to estimate trunk fat. Specific regions of interest in the trunk can be identified with DXA using anatomical landmarks, such as a window extending 5 cm or 10 cm above the iliac crest and laterally to the edges of the abdominal soft tissue which corresponds to the third to fifth lumbar vertebrae; this is the region commonly used in CT imaging to assess VAT (Figure 1). The DXA software identifies the composition of lean, fat and bone tissue over each individual pixel. Given that fat tissue is the least dense and bone is the most dense, pixels containing fat and bone tissue may be identified as lean tissue and influence the estimation of trunk fat in obese individuals. These factors raise concerns regarding the accuracy with which DXA can predict the quantity of intra-abdominal fat tissue in obese patients [20,32]. While DXA has the capacity to provide whole body analysis at a lower cost and with little radiation, CT and MRI provide greater precision for the evaluation of VAT. Nonetheless, DXA is a far more precise method than anthropometric techniques, including WC, supine sagittal diameter or BIA.
Figure 1.
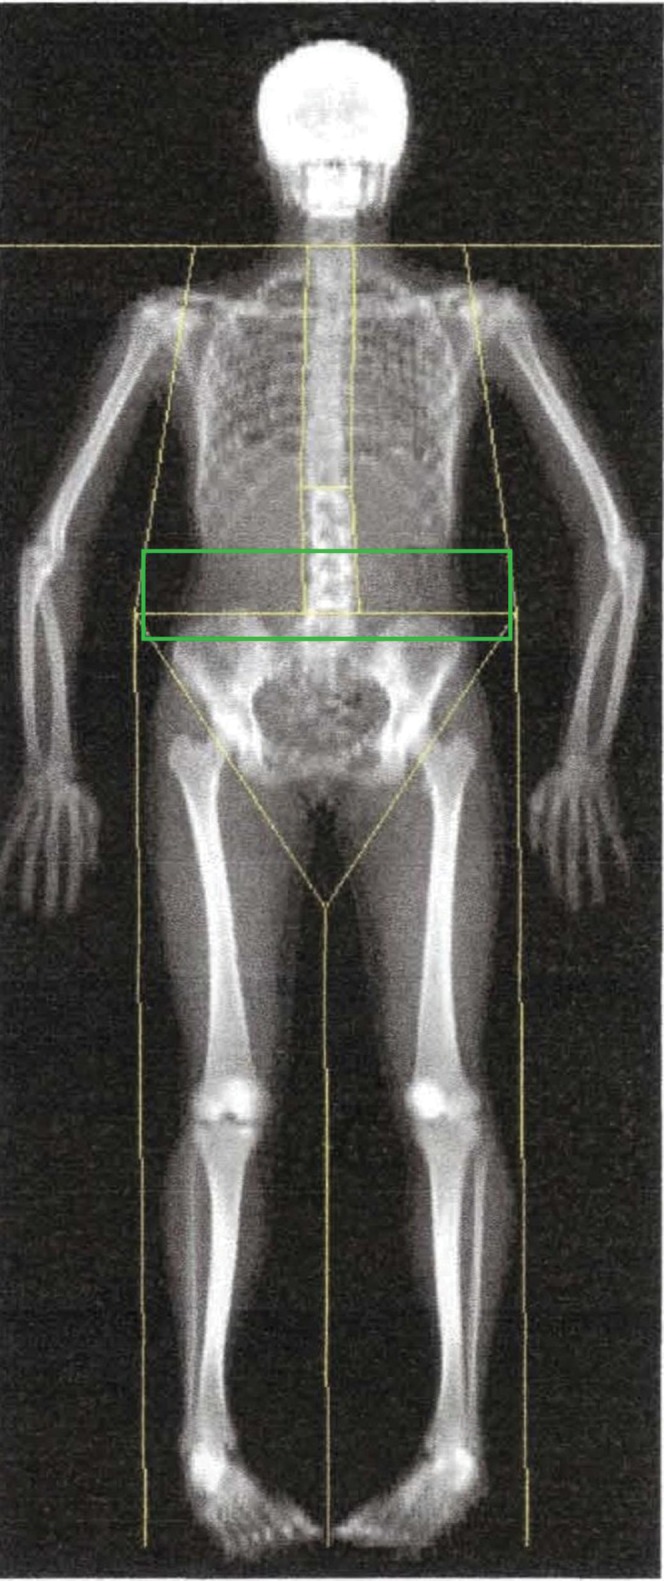
Dual energy X-ray absorptiometry of the whole body. Regional image analysis of the visceral fat is conducted at the level of L3–L5 lumbar vertebrae (green rectangle).
Ultrasound
Ultrasound is another suitable technique for estimating subcutaneous and intra-abdominal fat tissue. The time needed for a single measurement is very short, but reproducibility and accuracy are poor [33-35]. Bellisari et al [35] demonstrated that ultrasound measurements of intra-abdominal adipose tissue yield a coefficient of variation of 64% and therefore did not recommend ultrasound for the measurement of visceral fat. Several studies have shown a good correlation between abdominal ultrasound measurement and the amount of intra-abdominal adipose tissue on CT, as well as its usefulness in diagnosing intra-abdominal obesity [33,34,36]. The assessment of intra-abdominal adipose tissue by ultrasound was first published by Armellini et al [37], showing correlations between ultrasound and CT of 0.68–0.74 [33].
However, ultrasonography can be used to estimate the ratio of the thicknesses of the pre-peritoneal fat layer (extending from the anterior surface of the liver to the linea alba) and subcutaneous fat in the abdomen, which is termed the abdominal wall fat index (Figure 2). This index was comparable with VAT-to-SAT ratios obtained with CT analysis and it was positively correlated with serum triglyceride levels and inversely correlated with high-density lipoprotein [34,38]. These results suggest that the abdominal fat index measured by ultrasonography may predict visceral fat deposition and ultimately predict metabolic disorders involving lipid and glucose metabolism [34]. The use of ultrasonography for measuring visceral thickness from the posterior edge of the abdominal muscles to the aorta (Figure 2), lumbar spine or psoas muscles has also correlated well with VAT measured by CT imaging (r=0.669, p<0.001), also demonstrating that ultrasonography could be useful in evaluating intra-abdominal fat tissue [36,37]. However, caution should be taken when interpreting ultrasound measurements as they are often subjective to the experience and abilities of the researcher. A reproducible method for objective assessment of VAT using ultrasound is necessary and requires future investigation.
Figure 2.

Ultrasound image of the abdomen. (a,b) Subcutaneous fat (S) and a pre-peritoneal fat layer (P) extending from the anterior surface of the liver to the linea alba (white arrow) are identified. The abdominal wall fat index designates a ratio of the thicknesses of the pre-peritoneal fat layer and subcutaneous fat; (c) visceral thickness (green arrow) from the posterior edge of the abdominal muscles to the aorta (white arrow) is also demonstrated.
CT and MRI
Currently, the gold standard for the quantitative assessment of intra-abdominal adipose tissue is CT and MRI [39]. With its excellent resolution of adipose tissue, CT presents a direct method of assessing visceral fat deposition in both adult and paediatric populations. Specific ranges of Hounsfield units (HU) are the basic radiographic measure used to decipher between different tissues; the window width defining fat tissue varies from –250 HU to –30 HU [40]. Volume of fat can be measured in voxels and translated to cubic centimetres (Figure 3). Cross-sectional areas can be measured in single or multiple slices at pre-determined landmarks, which generates strong correlations with fat volume [41,42]. For example, the work by Kobayashi et al [42] showed that single-slice surface area of visceral fat strongly correlates with volumetric reconstruction at the umbilicus in males and females (r=0.81 and 0.85, respectively). However, they also highlight that visceral fat volume had a stronger correlation with BMI than visceral fat cross-sectional area in both genders [42], suggesting that when CT or MRI analysis is not available, BMI may provide a surrogate measure of VAT. However, the relationship between BMI and CT images of VAT has not been extensively evaluated in diverse healthy and clinical populations.
Figure 3.

Axial CT images of the abdomen at the level of the L3 vertebral body. (a) Visceral, (b) subcutaneous and (c) total fat components are highlighted. (d) Visceral, (e) subcutaneous and (f) total fat components are then separately extracted. The numbers of pixels of each component are summed across obtained slices to create a ratio of visceral and subcutaneous fat to total fat. The percentage of visceral adipose tissue is then calculated.
While single-slice images are often used in research studies to reduce costs and radiation exposure, one should keep in mind that they may be less accurate than volumetric analysis. One potential problem in using single-slice analysis for CT is that soft-tissue structures are continuously moving and may adversely affect the reliability of the visceral fat measurement, particularly in longitudinal analysis of scans, as movement of these tissues will alter the location of VAT in a given single slice. Intrasubject variability in CT-derived adipose tissue measures in the abdominal region may also limit the usefulness of single-slice analysis when comparing intra-abdominal fat between individuals [43]. The same problem may apply to MRI.
MRI continues to provide a valuable method for studying fat deposition and can be used to assess abdominal fat distribution [39]. In practice, multiple-slice MRI is one of the preferred options for volume calculation, but its use is limited by accessibility and cost. Accuracy is often high with MRI, but defining different adipose tissue deposits depends on the settings of the MRI scanner (Figure 4). Along with CT imaging, multislice volume MRI is generally considered a gold standard reference for measuring total and regional adipose tissue volumes [29,44]. With the costs involved with multislice imaging for volumetric analysis, single cross-sectional images can be used as representative measures of VAT for a compromise between accuracy and cost [45]. However, the limitations in this approach are similar to those described with CT. Thomas et al [46] found significant variation in the individual percentage of visceral and total adipose tissue based on the MRI single-slice technique with no relation to simple anthropometric measurements in a representative group of women [46]. Similar to CT imaging, the correlation between VAT cross-sectional areas in a single slice compared with VAT volume measured with multiple slices has varied; however, strong correlations are generated (r=0.82–0.99) regardless of sample size [19,44,47]. Shen et al [48] showed that single abdominal adipose tissue slice areas obtained by MRI at 5 cm superior to the L4–L5 level revealed the highest correlation with total body adipose tissue. Furthermore, the influence of age, sex, ethnicity, imaging position (prone or supine), BMI and WC on the relationship between single adipose tissue areas and respective total body adipose tissue volume were insignificant [48,49]. However, it should be emphasised that despite being a reliable technique that also can be used to assess abdominal fat distribution, MRI equipment is expensive and less available than CT equipment.
Figure 4.

(a) Axial gradient-echo fat-saturated three-dimensional MRI (repetition time (ms)/echo time (ms), 4.156/1.892; 4 mm thickness) of the abdomen at the level of the L3 vertebral body. (b) Visceral and (c) total fat components are highlighted. (d) Visceral and (e) total fat components are then extracted. The percentage of visceral adipose tissue is then calculated.
Another limitation of both CT and MRI techniques is the potential inapplicability for extremely obese patients because of the weight limits for the table attached to the CT and MRI scanners. Also, the circumference of an obese individual’s body may not fit through the field of view of the scanner. Future investigations are needed to understand the accuracy of body composition measurements in obese, particularly morbidly obese, individuals when using CT and MRI.
Conclusion
What is the preferred method for visceral adipose tissue measurement?
Accurate quantitative assessment of the visceral adiposity is essential in the evaluation of potential risk for the development of serious medical illnesses. Techniques for measuring visceral adiposity vary in accessibility, specificity, accuracy and the ability to quantitatively assess visceral fat (Table 1). Where MRI and CT images are available, these generate the most accurate, specific and comprehensive data in comparison with all modalities discussed in this paper. The precision of CT imaging for measuring visceral fat tissue provides a clinical venue for body composition analysis, particularly the quantification of visceral fat. Owing to the costs of both CT and MRI, retrospective analysis of images taken during routine clinical care in a given disease population can be valuable for assessing changes in VAT relative to other body composition features and relative to clinical and metabolic parameters. However, prospective analysis using MRI is less feasible because it is costly and relatively inaccessible in smaller clinical centres. Prospective analysis using CT imaging is also relatively unfeasible owing to the radiation exposure involved.
Table 1. Methods of evaluation of visceral adiposity: comparative analysis.
| Method of evaluation | Availability | Specificity | Accuracy | Reproducibility | Quantitative assessment | Exposure to radiation | Other comments |
| Anthropometric: BMI, WC and sagittal abdominal diameter | Most accessible | Low | Low | Highly variable | Does not provide | No | Simplest and most rapid method |
| BIA | Easily accessible | Low | Medium | Coefficient of variability: 4–9.8% [50,51] | Indirect assessment by measuring a voltage of current between the umbilicus and the back | No | Takes up to a few minutes. Does not require specific skills to operate equipment. Has maximum weight limit. Requires predictive equations |
| ADP | Less accessible | Medium | High | Coefficient of variability: adults, 1.7–4.5% [52]; children, 25% (boys), 44% (girls) [53] | Indirect assessment by monitoring changes in pressure within a closed chamber | No | Rapid and non-invasive |
| May be feasible for morbidly obese patients | |||||||
| Need to control temperature and moisture | |||||||
| Requires patient to perform a complex breathing manoeuvre | |||||||
| Volume of the body fat is often underestimated | |||||||
| Ultrasound | Easily accessible | Medium | High | Coefficient of variability: varies from <2% to 4.5–7.9% [54,55] | Indirect assessment by measuring a distance between internal face of the recto-abdominal muscle and anterior wall of the aorta | No | Operator skills and training required |
| Reliability and accuracy depend on operator | |||||||
| DXA | Less accessible | Low | High | Coefficient of variability: varies from <1% to 4% [50,56,57] | Indirect assessment by measuring a total body and trunk fat masses | The effective dose per scan: 0.003–0.06 mSv | Upper weight limit restricted by the size of the scanning area. Special software required |
| CT | Less accessible | Very high | Very high | Coefficient of variability: 1.2–4.3% [55,58,59] | Provide | The effective dose per scan: 6.0–10.0 mSv for abdominal multislice CT with routine protocol (2.5 mm slice collimation), but may be reduced with improved protocols | Can use single slices to predict whole body compartments |
| Upper weight limit | |||||||
| Specific software required for analysis | |||||||
| MRI | Much less available than other methods | Very high | Very high | Coefficient of variability: 2.1–6.5% [50,57,60,61] | Provide | No | Duration of the scan is approximately 14–18 s |
| Single-slice protocol is as accurate as multislice |
ADP, air displacement plethysmography; BIA, bioelectrical impedance analysis; BMI, body mass index; DXA, dual energy X-ray absorptiometry; WC, waist circumference.
Where this imaging equipment is inaccessible, surrogate measures of visceral adiposity may be used along with the inexpensive anthropometric measures (i.e. BMI, WHR) that have been discussed. These measures can be used to classify the magnitude of obesity in patients. However, studies that advance accuracy and provide more precise predictive equations in using these simple surrogate anthropometric measures that define intra-abdominal obesity are needed.
Ultrasound imaging may facilitate the assessment of the general magnitude of intra-abdominal adipose tissue, but it has obvious limitations regarding reliability. The techniques used in ultrasonography remain operator dependent in quantitative measurements of body composition. If ultrasound imaging is available, with proper precautions for operator protocols to promote consistency, it can provide expedient measures of visceral adiposity.
On the other hand, DXA and air displacement plethysmography can provide precise measures of fat mass but can only indirectly measure visceral adiposity. Until accurate predictive equations are developed for these high-precision techniques, their capacity to quantify VAT is limited. While BIA is a cost-efficient and accessible method that also avoids exposure to radiation, it has the least accuracy for predicting VAT of all the modalities discussed.
References
- 1.An P, Rice T, Borecki IB, Pérusse L, Gagnon J, Leon AS, et al. Major gene effect on subcutaneous fat distribution in a sedentary population and its response to exercise training: the Heritage Family Study. Am J Human Bio 2000;12:600–9 [DOI] [PubMed] [Google Scholar]
- 2.Wu CH, Yao WJ, Lu FH, Yang YC, Wu JS, Chang CJ, et al. Sex differences of body fat distribution and cardiovascular dysmetabolic factors in old age. Age Ageing 2001;30:331–6 [DOI] [PubMed] [Google Scholar]
- 3.Kyle UG, Genton L, Hans D, Karsegard L, Slosman DO, Pichard C. Age-related differences in fat-free mass, skeletal muscle, body cell mass and fat mass between 18 and 94 years. Eur J Clin Nut 2001;55:663–72 [DOI] [PubMed] [Google Scholar]
- 4.Ramos deMarins VM, Varnier Almeida RM, Pereira RA, Barros MB. Factors associated with overweight and central body fat in the city of Rio de Janeiro: results of a two-stage random sampling survey. Public Health 2001;115:236–42 [DOI] [PubMed] [Google Scholar]
- 5.Evans EM, Van Pelt RE, Binder EF, Williams DB, Ehsani AA, Kohrt WM. Effects of HRT and exercise training on insulin action, glucose tolerance, and body composition in older women. J Appl Physiol 2001;90:2033–40 [DOI] [PubMed] [Google Scholar]
- 6.Kanaley JA, Sames C, Swisher L, Swick AG, Ploutz-Snyder LL, Steppan CM, et al. Abdominal fat distribution in pre- and postmenopausal women: the impact of physical activity, age, and menopausal status. Metabolism 2001;50:976–82 [DOI] [PubMed] [Google Scholar]
- 7.Ritchie SA, Connell JM. The link between abdominal obesity, metabolic syndrome and cardiovascular disease. Nutr Metab Cardiovasc Dis 2007;17:319–26 [DOI] [PubMed] [Google Scholar]
- 8.Fox CS, Massaro JM, Hoffmann U, Pou KM, Maurovich-Horvat P, Liu CY, et al. Abdominal visceral and subcutaneous adipose tissue compartments: association with metabolic risk factors in the Framingham Heart Study. Circulation 2007;116:39–48 [DOI] [PubMed] [Google Scholar]
- 9.Oh TH, Byeon JS, Myung SJ, Yang SK, Choi KS, Chung JW, et al. Visceral obesity as a risk factor for colorectal neoplasm. J Gastroenterol Hepatol 2008;23:411–17 [DOI] [PubMed] [Google Scholar]
- 10.Schapira DV, Clark RA, Wolff PA, Jarrett AR, Kumar NB, Aziz NM. Visceral obesity and breast cancer risk. Cancer 1994;74:632–9 [DOI] [PubMed] [Google Scholar]
- 11.Von Hafe P, Pina F, Pérez A, Tavares M, Barros H. Visceral fat accumulation as a risk factor for prostate cancer. Obes Res 2004;12:1930–5 [DOI] [PubMed] [Google Scholar]
- 12.Tsujinaka S, Konishi F, Kawamura YJ, Saito M, Tajima N, Tanaka O, et al. Visceral obesity predicts surgical outcomes after laparoscopic colectomy for sigmoid colon cancer. Dis Colon Rectum 2008;51:1757–67 [DOI] [PubMed] [Google Scholar]
- 13.Mathieu P. Abdominal obesity and the metabolic syndrome: a surgeon’s perspective. Can J Cardiol 2008;24:19D–23D [DOI] [PMC free article] [PubMed] [Google Scholar]
- 14.Busetto L. Visceral obesity and the metabolic syndrome: effects of weight loss. Nutr Metab Cardiovasc Dis 2001;11:195–204 [PubMed] [Google Scholar]
- 15.Lamarche B, Lemieux S, Dagenais GR, Després JP. Visceral obesity and the risk of ischaemic heart disease: insights from the Québec Cardiovascular Study. Growth Horm IGF Res 1998;8 Suppl B:1–8 [DOI] [PubMed] [Google Scholar]
- 16.Mathieu P, Pibarot P, Larose E, Poirier P, Marette A, Després JP. Visceral obesity and the heart. Int J Biochem Cell Biol 2008;40:821–36 [DOI] [PubMed] [Google Scholar]
- 17.Onat A, Avci GS, Barlan MM, Uyarel H, Uzunlar B, Sansoy V. Measures of abdominal obesity assessed for visceral adiposity and relation to coronary risk. Int J Obes Relat Metab Disord 2004;28:1018–25 [DOI] [PubMed] [Google Scholar]
- 18.Pinthus JH, Kleinmann N, Tisdale B, Chatterjee S, Lu JP, Gillis A, et al. Lower plasma adiponectin levels are associated with larger tumor size and metastasis in clear-cell carcinoma of the kidney. Eur Urol 2008;54:866–73 [DOI] [PubMed] [Google Scholar]
- 19.Kvist H, Chowdhury B, Grangard U, Tylén U, Sjöström L. Total and visceral adipose-tissue volumes derived from measurements with computed tomography in adult men and women: predictive equations. Am J Clin Nutr 1988;48:1351–61 [DOI] [PubMed] [Google Scholar]
- 20.Ball SD, Swan PD. Accuracy of estimating intraabdominal fat in obese women. J Exerc Physiol Online 2003;6:1–7 [Google Scholar]
- 21.Ashwell M, Cole TJ, Dixon AK. New insight into the anthropometric classification of fat distribution shown by computed tomography. Br Med J Clin Res Ed 1985;290:1692–4 [DOI] [PMC free article] [PubMed] [Google Scholar]
- 22.Seidell JC, Oosterlee A, Deurenberg P, Hautvast JG, Ruijs JH. Abdominal fat depots measured with computed tomography: effects of degree of obesity, sex, and age. Eur J Clin Nutr 1988;42:805–15 [PubMed] [Google Scholar]
- 23.Kullberg J, von Below C, Lönn L, Lind L, Ahlström H, Johansson L. Practical approach for estimation of subcutaneous and visceral adipose tissue. Clin Physiol Funct Imaging 2007;27:148–53 [DOI] [PubMed] [Google Scholar]
- 24.Mourtzakis M, Prado CM, Lieffers JR, Reiman T, McCargar LJ, Baracos VE. A practical and precise approach to quantification of body composition in cancer patients using computed tomography images acquired during routine care. Appl Physiol Nutr Metab 2008;33:997–1006 [DOI] [PubMed] [Google Scholar]
- 25.Kyle UG, Bosaeus I, De Lorenzo AD, Deurenberg P, Elia M, Manuel Gómez J, et al. Bioelectrical impedance analysis-part II: utilization in clinical practice. Clin Nutr 2004;23:1430–53 [DOI] [PubMed] [Google Scholar]
- 26.Nagai M, Komiya H, Mori Y, Ohta T, Kasahara Y, Ikeda Y. Development of a new method for estimating visceral fat area with multi-frequency bioelectrical impedance. Tohoku J Exp Med 2008;214:105–12 [DOI] [PubMed] [Google Scholar]
- 27.Shoji K, Maeda K, Nakamura T, Funahashi T, Matsuzawa Y, Shimomura I, et al. Measurement of visceral fat by abdominal bioelectrical impedance analysis is beneficial in medical checkup. Obes Research Clin Pract 2008;2:269–75 [DOI] [PubMed] [Google Scholar]
- 28.Sarhill N, Walsh D, Nelson K, Homsi J, Komurcu S. Bioelectrical impedance, cancer nutritional assessment, and ascites. Support Care Cancer 2000;8:341–3 [DOI] [PubMed] [Google Scholar]
- 29.Heymsfield SB, Wang Z, Baumgartner RN, Ross R. Human body composition: advances in models and methods. Annu Rev Nutr 1997;17:527–8 5 [DOI] [PubMed] [Google Scholar]
- 30.Treuth MS, Hunter GR, Kekes-Szabo K. Estimating intraabdominal adipose tissue in women by dual-energy X-ray absorptiometry. Am J Clin Nutr 1995;62:527–32 [DOI] [PubMed] [Google Scholar]
- 31.Hill AM, LaForgia J, Coates AM, Buckley JD, Howe PR. Estimating abdominal adipose tissue with DXA and anthropometry. Obesity 2007;15:504–10 [DOI] [PubMed] [Google Scholar]
- 32.Bertin E, Marcus C, Ruiz JC, Eschard JP, Leutenegger M. Measurement of visceral adipose tissue by DXA combined with anthropometry in obese humans. Int J Obes Relat Metab Disord 2000;24:263–70 [DOI] [PubMed] [Google Scholar]
- 33.Armellini F, Zamboni M, Robbi R, Todesco T, Rigo L, Bergamo-Andreis IA, et al. Total and intra-abdominal fat measurements by ultrasound and computerized tomography. Int J Obes Relat Metab Disord 1993;17:209–14 [PubMed] [Google Scholar]
- 34.Suzuki R, Watanabe S, Hirai Y, Akiyama K, Nishide T, Matsushima Y, et al. Abdominal wall fat index, estimated by ultrasonography, for assessment of the ratio of visceral fat to subcutaneous fat in the abdomen. Am J Med 1993;95:309–14 [DOI] [PubMed] [Google Scholar]
- 35.Bellisari A, Roche AF, Siervogel RM. Reliability of B-mode ultrasonic measurements of subcutaneous adipose tissue and intra-abdominal depth: comparisons with skinfold thickness. Int J Obes Relat Metab Disord 1993;17:475–80 [PubMed] [Google Scholar]
- 36.Stolk RP, Wink O, Zelissen PMJ, Meijer R, van Gils AP, Grobbee DE. Validity and reproducibility of ultrasonography for the measurement of intra-abdominal adipose tissue. Int J Obes Relat Metab Disord 2001;25:1346–51 [DOI] [PubMed] [Google Scholar]
- 37.Armellini F, Zamboni M, Rigo L, Todesco T, Bergamo-Andreis IA, Procacci C, et al. The contribution of sonography to the measurement of intra-abdominal fat. J Clin Ultrasound 1990;18:563–7 [DOI] [PubMed] [Google Scholar]
- 38.Ono T, Taniguchi N, Osawa M, Onoguchi A, Kaneko S, Nakazawa Y, et al. The usefulness of mesenterium thickness as an index of visceral fat accumulation. J Med Ultrasonoc 2003;30:153–61 [DOI] [PubMed] [Google Scholar]
- 39.Seidell JC, Bakker CJ, Van der KK. Imaging techniques for measuring adipose-tissue distribution –— a comparison between computed tomography and 1.5-T magnetic resonance. Am J Clin Nutr 1990;51:953–7 [DOI] [PubMed] [Google Scholar]
- 40.Van der KK, Seidell JC. Techniques for the measurement of visceral fat: a practical guide. Int J Obes 1993;17:187–96 [PubMed] [Google Scholar]
- 41.Yoshizumi T, Nakamura T, Yamane M, Islam AH, Menju M, Yamasaki K, et al. Abdominal fat: standardized technique for measurement at CT. Radiology 1999;211:283–6 [DOI] [PubMed] [Google Scholar]
- 42.Kobayashi J, Tadokoro N, Watanabe M, Shinomiya M. A novel method of measuring intra-abdominal fat volume using helical computed tomography. Int J Obes Relat Metab Disord 2002;26:398–402 [DOI] [PubMed] [Google Scholar]
- 43.Greenfield JR, Samaras K, Chisholm DJ, Campbell LV. Regional intra-subject variability in abdominal adiposity limits usefulness of computed tomography. Obes Res 2002;10:260–5 [DOI] [PubMed] [Google Scholar]
- 44.Ross R, Leger L, Morris D, de Guise J, Guardo R. Quantification of adipose tissue by MRI: relationship with anthropometric variables. J Appl Physiol 1992;72:787–95 [DOI] [PubMed] [Google Scholar]
- 45.Shen W, Wang Z, Punyanita M, Lei J, Sinav A, Kral JG, et al. Adipose tissue quantification by imaging methods: a proposed classification. Obes Res 2003;11:5–16 [DOI] [PMC free article] [PubMed] [Google Scholar]
- 46.Thomas EL, Saeed N, Hajnal JV, Brynes A, Goldstone AP, Frost G, et al. Magnetic resonance imaging of total body fat. J Appl Physiol 1998;85:1778–85 [DOI] [PubMed] [Google Scholar]
- 47.Han TS, Kelly IE, Walsh K, Greene RM, Lean ME. Relationship between volumes and areas from single transverse scans of intra-abdominal fat measured by magnetic resonance imaging. Int J Obes Relat Metab Disord 1997;21:1161–6 [DOI] [PubMed] [Google Scholar]
- 48.Shen W, Punyanitya M, Wang Z, Gallagher D, St-Onge MP, Albu J, et al. Visceral adipose tissue: relations between single-slice areas and total volume. Am J Clin Nutr 2004;80:271–8 [DOI] [PMC free article] [PubMed] [Google Scholar]
- 49.Shen W, Punyanitya M, Wang Z, Gallagher D, St-Onge MP, Albu J, et al. Total body skeletal muscle and adipose tissue volumes: estimation from a single abdominal cross-sectional image. J Appl Physiol 2004;97:2333–8 [DOI] [PubMed] [Google Scholar]
- 50.Bosy-Westphal A, Later W, Hitze B, Sato T, Kossel E, Gluer CC, et al. Accuracy of bioelectrical impedance consumer devices for measurement of body composition in comparison to whole body magnetic resonance imaging and dual X-ray absorptiometry. Obes Facts 2008;1:319–24 [DOI] [PMC free article] [PubMed] [Google Scholar]
- 51.Giltay EJ, Elbers JM, Gooren LJ, Emeis JJ, Kooistra T, Asscheman H, et al. Visceral fat accumulation is an important determinant of PAI-1 levels in young, nonobese men and women: modulation by cross-sex hormone administration. Arterioscler Thromb Vasc Biol 1998;18:1716–22 [DOI] [PubMed] [Google Scholar]
- 52.Fields DA, Goran MI, McCrory MA. Body-composition assessment via air- displacement plethysmography in adults and children: a review. Am J Clin Nutr 2002;75:453–67 [DOI] [PubMed] [Google Scholar]
- 53.Winsley RJ, Fulford J, MacLeod KM, Ramos-Ibanez N, Williams CA, Armstrong N. Prediction of visceral adipose tissue using air displacement plethysmography in children. Obes Res 2005;13:2048–51 [DOI] [PubMed] [Google Scholar]
- 54.Ribeiro-Filho FF, Faria AN, Kohlmann O, Jr, Ajzen S, Ribeiro AB, Zanella MT, et al. Ultrasonography for the evaluation of visceral fat and cardiovascular risk. Hypertension 2001;38:713–17 [DOI] [PubMed] [Google Scholar]
- 55.Stolk RP, Wink O, Zelissen PM, Meijer R, van Gils AP, Grobbee DE. Validity and reproducibility of ultrasonography for the measurement of intra-abdominal adipose tissue. Int J Obes Relat Metab Disord 2001;25:1346–51 [DOI] [PubMed] [Google Scholar]
- 56.Lane JT, Mack-Shipman LR, Anderson JC, Moore TE, Erickson JM, Ford TC, et al. Comparison of CT and dual-energy DEXA using a modified trunk compartment in the measurement of abdominal fat. Endocrine 2005;27:295–9 [DOI] [PubMed] [Google Scholar]
- 57.Stewart KJ, DeRegis JR, Turner KL, Bacher AC, Sung J, Hees PS, et al. Usefulness of anthropometrics and dual-energy X-ray absorptiometry for estimating abdominal obesity measured by magnetic resonance imaging in older men and women. J Cardiopulm Rehabil 2003;23:109–14 [DOI] [PubMed] [Google Scholar]
- 58.Rockall AG, Sohaib SA, Evans D, Kaltsas G, Isidori AM, Monson JP, et al. Computed tomography assessment of fat distribution in male and female patients with Cushing's syndrome. Eur J Endocrinol 2003;149:561–7 [DOI] [PubMed] [Google Scholar]
- 59.Thaete FL, Colberg SR, Burke T, Kelley DE. Reproducibility of computed tomography measurement of visceral adipose tissue area. Int J Obes Relat Metab Disord 1995;19:464–7 [PubMed] [Google Scholar]
- 60.Demerath EW, Shen W, Lee M, Choh AC, Czerwinski SA, Siervogel RM, et al. Approximation of total visceral adipose tissue with a single magnetic resonance image. Am J Clin Nutr 2007;85:362–8 [DOI] [PMC free article] [PubMed] [Google Scholar]
- 61.Li X, Youngren JF, Hyun B, Sakkas GK, Mulligan K, Majumdar S, et al. Technical evaluation of in vivo abdominal fat and MCL quantification using MRI and MRSI at 3T. Technical evaluation of in vivo abdominal fat and IMCL quantification using MRI and MRSI at 3T. Magn Reson Imaging 2008;26:188–97 [DOI] [PMC free article] [PubMed] [Google Scholar]
- 62.World Health Organization (Switzerland) Global strategy on diet, physical activity and health. Geneva: WHO; 2004 [Google Scholar]