

Abstract
Imaging morphology and metabolic activity of splenic lesions is of paramount importance in patients with haematological malignancies; it can alter tumour staging, treatment protocols and overall prognosis. CT, MRI and positron emission tomography (PET)/CT have been shown to be powerful tools for the non-invasive assessment of splenic involvement in various haematological malignancies. Since many haematological malignancies and non-neoplastic conditions can involve the spleen and imaging manifestations can overlap, imaging and clinical findings outside of the spleen should be looked for to narrow the differential diagnosis; confirmation can be obtained by pathological findings. Radiologists should be familiar with the cross-sectional imaging patterns of haematological malignancies involving the spleen as well as non-neoplastic splenic findings common in these patients to facilitate their care and follow-up. This pictorial review provides the common and uncommon imaging appearances and complications of various haematological malignancies involving the spleen on CT, MRI and PET/CT, and common pitfalls in diagnosis.
The spleen is the largest lymphoid organ in the body; it plays an important role in immunological defences. Primary splenic malignancies, namely primary splenic lymphoma and angiosarcoma, are extremely uncommon [1]. Most haematological malignancies can affect the spleen, including various types of lymphomas, leukaemia and plasma cell malignancies. The most common haematological malignancy to affect the spleen is non-Hodgkin’s lymphoma (NHL), of which diffuse large B-cell is the most common type. The most common Hodgkin’s subtype to involve the spleen is nodular sclerosis [2].
Ultrasound and CT are the most common modalities for staging in haematological malignancies; MRI is often used as a problem solving tool. Fluorodeoxyglucose (FDG) positron emission tomography (PET)/CT is more frequently used in the staging and response assessment of lymphoma because it is considered more accurate than CT or MRI in detecting splenic involvement by lymphoma [3]. Accurate evaluation of splenic involvement by haematological malignancies is necessary because it may alter tumour staging and therefore treatment protocols and overall prognosis. In addition, other non-malignant conditions including infection, infarction and extramedullary haematopoiesis (EMH) may present as focal splenic lesions in patients with known diagnosis of haematological disorder, and may lead to erroneous diagnosis. This pictorial review provides the common and uncommon imaging appearances and complications of various haematological malignancies involving the spleen on CT, MRI and PET/CT, and the common pitfalls in diagnosis.
Lymphoma
The spleen is involved in one-third of all Hodgkin’s lymphoma and 30–40% of NHL at presentation. Splenic infiltration is considered nodal in Hodgkin’s disease and extranodal in NHL [3]. Splenic involvement in Hodgkin’s disease can upstage the disease and hence alter the treatment, whereas splenic infiltration in NHL may not always affect the overall staging because the majority present with disseminated disease [4].
Splenic involvement in lymphoma can be primary or secondary; the latter is much more common. Primary splenic lymphoma is defined as lymphomatous involvement of the spleen with or without splenic hilar lymphadenopathy. Secondary splenic lymphoma is defined as lymphomatous involvement of the spleen and the nodes, other than those in the splenic hilum [5,6]. Primary splenic lymphoma is rare and occurs in approximately 1−2% of all lymphomas at presentation, most commonly diffuse large B-cell lymphoma (DLBCL). On imaging, primary splenic lymphoma will often manifest as a single large mass or multiple focal splenic masses (Figure 1). Splenomegaly with invasion of adjacent organs has also been reported [4,7].
Figure 1.
An axial contrast-enhanced CT image of a 65-year-old male with primary splenic marginal zone lymphoma. Image reveals multiple hypodense nodular lesions in the spleen (white arrows) without lymphadenopathy.
We describe four imaging patterns of splenic involvement in primary and secondary lymphoma (most frequent to least frequent occurrence): homogeneous splenomegaly without a focal lesion, diffuse infiltration with miliary lesions less than 5 mm, multiple focal nodular lesions (1−10 cm) and a large solitary mass [1,4-6]. The spleen commonly varies in size. Splenomegaly alone cannot be used to determine splenic involvement by lymphoma because 30% of normal-sized spleens can have tumour infiltration and splenomegaly can occur without tumour involvement [2,5,8]. The commonly used ultrasonography and CT criterion in practice for defining splenomegaly is a craniocaudal height of 13 cm [1]. Splenomegaly based on physical examination, where the spleen extends below the ribs or is more than two-thirds of the anteroposterior dimension of the abdomen, is less accurate. The splenic index is calculated by the product of the maximum craniocaudal height, transverse thickness and anteroposterior length [1]. A recently published study proposed a splenic index greater than 725 cm3, which corresponds to a splenic height of 13 cm, length of 11 cm and thickness of 5 cm, as a useful practical criterion for defining splenomegaly in patients who are 16 years and older [8]. The study used multidetector CT and suggested that a splenic index of greater than 725 cm3 was a highly sensitive and specific criterion for splenomegaly and splenic involvement in lymphoma patients [8].
Diffuse uniform infiltration manifests as a normal-appearing spleen (i.e. microscopic involvement only), splenomegaly or ill-defined subcentimetre hypoenhancing nodules (Figure 2) [1,5,6]. Focal splenic nodules can be seen in both normal and enlarged spleens [4]. Calcification of splenic lesions is rare, although it may occur following treatment [1,4]. On MRI, splenic nodules are low to intermediate in signal on T1 weighted images, mild to moderately hyperintense on T2 weighted images and hypoenhancing compared with the spleen on post-gadolinium images [9]. The normal spleen shows a uniform homogeneous appearance on non-contrast scans, inhomogeneous enhancement in the early phase and uniform enhancement on the venous phase [1].
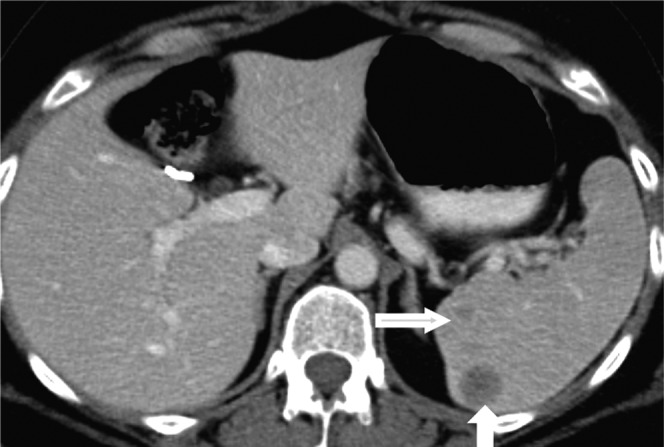
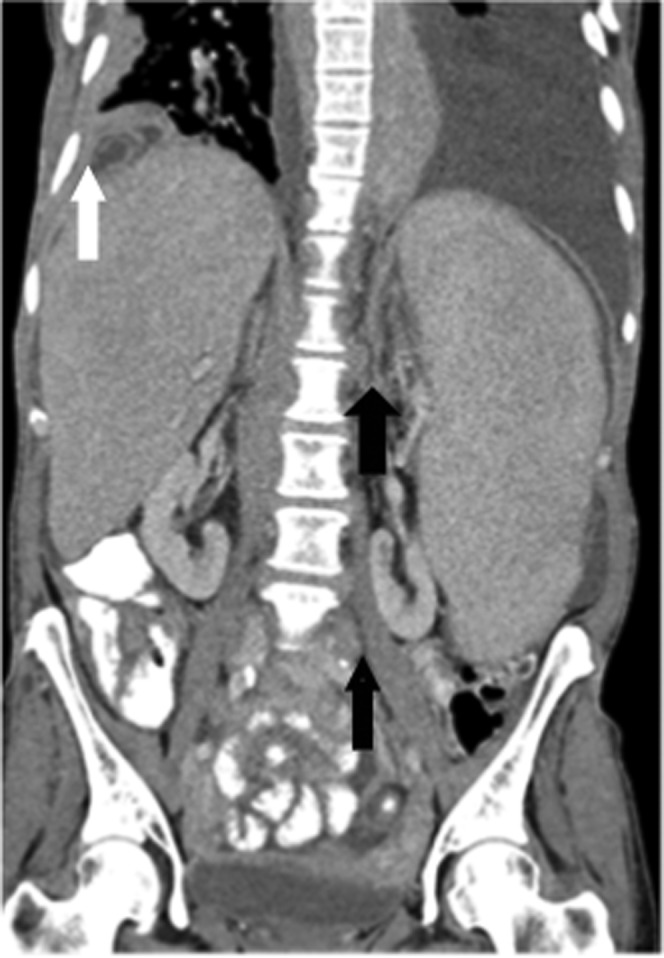
Figure 2.

Images from a 65-year-old male with relapse of small lymphocytic lymphoma. (a) Axial and (b) coronal contrast-enhanced CT images reveal moderate hepatosplenomegaly with multiple low attenuation, subcentimetre micronodules in the spleen (white arrows). Associated bulky retroperitoneal (black arrows) and mesenteric lymphadenopathy are also seen.
Discrete nodules are best seen in late venous phase CT and MRI because lymphoma nodules are hypoenhancing. Super paramagnetic iron oxide MRI has shown promising results in differentiating splenomegaly caused by venous congestion from malignant infiltration [4].
Several lymphoma subtypes have typical imaging manifestations when they involve the spleen. DLBCL commonly presents with moderate splenomegaly or a large hypodense splenic mass with abdominal lymphadenopathy (Figure 3) [4,5]. Marginal zone lymphoma, as with other indolent types of lymphoma (including follicular lymphoma), usually present with marked splenomegaly and lymphadenopathy in elderly patients (Figure 4) [10]. Diffuse splenic infiltration is the commonest pattern of splenic involvement in Hodgkin's disease owing to predominant involvement of periarteriolar lymphoid sheath (Figure 5) [4,11].
Figure 3.

Images from a 52-year-old male with diffuse large B-cell lymphoma of the spleen. (a) Axial and (b) coronal contrast-enhanced CT images reveal large heterogeneous mass with areas of low attenuation almost completely replacing the spleen (short black arrow) with extracapsular extension to involve stomach (long white arrow), pancreas and left adrenal gland. The mass is contiguous with the retroperitoneal lymphadenopathy (short white arrow) causing encasement of the splenic artery, coeliac axis (long black arrow) and left renal vein.
Figure 4.
Coronal reformatted contrast-enhanced CT image from a 54-year-old female with relapsed and refractory secondary splenic indolent marginal zone lymphoma. Images reveal marked homogeneous splenomegaly without focal splenic lesion. Hepatomegaly, retroperitoneal lymphadenopathy (black arrows) and pleuropulmonary parenchymal masses (white arrow) are also noted.
Figure 5.

Images from a 27-year-old female with recurrent classical Hodgkin’s lymphoma of nodular sclerosis type. (a) Axial contrast-enhanced CT images reveal diffuse heterogeneity of splenic enhancement (white arrow) with upper abdominal (black arrow) and retroperitoneal lymphadenopathy. (b) Axial fused positron emission tomography (PET)/CT and (c) coronal maximum intensity projection images from PET/CT data reveal intense fluorodeoxyglucose (FDG) uptake in the spleen (black arrow in (b)), which is significantly greater than the liver. Note the diffuse FDG-avid lymphadenopathy in the neck, mediastinum, right axilla, right hila (black arrow), upper abdomen, retroperitoneum (white arrow) and bilateral external iliac regions.
Hepatosplenic T-cell lymphoma is a rare aggressive subtype of peripheral T-cell lymphoma, which merits a separate discussion. It is characterised by isolated hepatosplenomegaly, without adenopathy or significant cytopaenias. On PET/CT, FDG-avid foci in the porta hepatis and diffuse splenic FDG uptake have been reported (Figure 6) [3,12].
Figure 6.

Images from a 46-year-old female with secondary hepatosplenic T-cell lymphoma. (a) Axial non-contrast CT, (b) axial fused positron emission tomography (PET)/CT and (c) coronal maximum intensity projection images from PET/CT data reveal moderate hepatosplenomegaly and heterogeneous, diffuse intense FDG uptake in the spleen (white arrows) without evidence of lymphadenopathy. Biopsy showed periportal infiltrate consistent with hepatosplenic T-cell lymphoma.
18F-fluorodeoxyglucose PET/CT in splenic lymphoma
18F-FDG PET/CT is the investigation of choice for staging and follow-up of Hodgkin’s disease and aggressive NHL [13]. In terms of sensitivity, specificity and accuracy, 18F-FDG PET/CT is distinctly superior to separate CT and PET in the staging and restaging of NHL and Hodgkin’s disease. The overall reported sensitivity and specificity of 18F-FDG PET/CT for the initial staging of NHL and Hodgkin’s disease were 97% and 100%, respectively; median sensitivity and specificity of PET only were 90.3% and 91.1%, respectively [3]. 18F-FDG PET/CT is currently recommended for staging before therapy in FDG-avid potentially curable lymphomas (e.g. DLBCL and Hodgkin’s lymphoma), and for the post-treatment response of DLBCL and Hodgkin’s lymphoma, while it is not considered helpful in non-curable, variably FDG-avid, indolent and aggressive subtypes (e.g. follicular lymphoma and mantle-cell lymphoma) [14]. A recent study on splenic involvement at initial staging in lymphoma found that sensitivity and specificity of CT, PET and PET/CT were 91% and 96%, 75% and 99%, and 100% and 95%, respectively [8].
The two patterns of splenic lymphomatous infiltration on FDG PET/CT are a diffusely FDG-avid spleen, with more FDG activity than in liver and bone marrow and often with normal CT appearance (Figures 5, 7, 8), or solitary or multiple FDG-avid splenic lesions (Figure 9) [3]. However, increased splenic activity, seen in a few patients in the post-therapy period on 18F-FDG PET scan, especially following haematopoietic stimulating agents, is a false positive finding and can limit the evaluation of splenic involvement by lymphoma; this can last for more than 1 month following therapy [3]. However, associated diffuse symmetric FDG uptake in bone marrow of the axial skeleton can suggest haematopoietic proliferation instead of true splenic lymphomatous involvement. Therefore, to avoid false-positive findings, post-therapy PET should be considered optimal 4–6 weeks after surgery or chemotherapy and 8–12 weeks after external beam radiation therapy or radioimmunotherapy [3].
Figure 7.

Images from a 67-year-old male with secondary splenic chronic lymphocytic leukaemia. (a) Coronal maximum intensity projection image from positron emission tomography (PET)/CT data before treatment showing moderately enlarged spleen with diffusely increased abnormal splenic fluorodeoxyglucose (FDG) uptake (black arrow), which is greater than hepatic uptake consistent with splenic involvement. Note the moderate to high uptake lymphomatous lymphadenopathy in bilateral cervical chain, supraclavicular, axillary (short white arrows), mediastinal, retroperitoneal (long white arrow), mesenteric and common iliac regions. (b) Coronal maximum intensity projection image from PET/CT following allogeneic transplant reveals complete resolution of abnormal FDG avid disease involving lymph nodes and the spleen suggesting complete remission.
Figure 8.

Images from a 40-year-old male with secondary splenic highly aggressive precursor B-cell acute lymphoblastic leukaemia. (a) Coronal non-contrast CT, (b) coronal fused positron emission tomography (PET)/CT and (c) coronal maximum intensity projection images from PET data reveal mild splenomegaly with diffuse intense fluorodeoxyglucose (FDG) uptake (white arrow), which is greater than hepatic uptake and is consistent with splenic involvement. Diffusely increased FDG uptake in the bone marrow of the spine (black arrow) was secondary to bone marrow involvement proven by biopsy.
Figure 9.

Images from a 64-year-old male with secondary splenic aggressive mantle cell lymphoma. (a) Axial non-contrast CT, (b) axial fused positron emission tomography (PET)/CT and (c) coronal maximum intensity projection PET images from PET/CT data reveal marked splenomegaly, mild diffusely increased splenic fluorodeoxyglucose (FDG) uptake and several high uptake splenic foci (white arrows). CT images show a homogeneous appearance of the spleen. There is mildly FDG-avid upper abdominal, retrocrural, retroperitoneal (short black arrow), mesenteric, hilar and mediastinal lymphadenopathy (long black arrow).
High-grade, aggressive lymphomas reveal significantly more splenic FDG-avidity than indolent types, and are greatest in diffuse large B-cell, Burkitt, anaplastic and grade 3 follicular lymphoma among NHLs and in the nodular sclerosing type among Hodgkin’s disease [3].
Waldenstrom’s macroglobulinaemia/lymphoplasmacytic lymphoma
Waldenstrom’s macroglobulinaemia is a rare disorder characterised by lymphoplasmacytic lymphoma in bone marrow and immunoglobulin M monoclonal gammopathy in blood. 30–35% of patients present with anaemia, lymphadenopathy, hepatosplenomegaly, hyperviscosity and peripheral neuropathy [15]. Focal splenic lesions are uncommon. On PET/CT, as in other lymphomas, diffuse splenic FDG uptake may be seen (Figure 10).
Figure 10.

Images from a 65-year-old male with Waldenstrom’s macroglobulinaemia. (a) Coronal non-contrast CT, (b) coronal fused positron emission tomography (PET)/CT images from PET/CT data reveal moderate splenomegaly with diffuse intense fluorodeoxyglucose (FDG) uptake (long black arrow), which is greater than hepatic uptake and is consistent with splenic involvement. FDG-avid lymphadenopathy is noted in bilateral axillary (short black arrow) and right common iliac regions.
Leukaemia (adult-acute or chronic leukaemias)
Cross-sectional imaging findings of leukaemia include lymphadenopathy, splenomegaly and miliary low attenuation splenic nodules (Figure 11) [1,16]. Tiny focal lesions in the spleen and liver due to leukaemia can be difficult to differentiate from fungal microabscesses based on imaging findings alone [16]. Hairy cell leukaemia is a rare indolent type of lymphoma in adults. Splenomegaly is the most consistent finding, with hepatomegaly reported in half and intra-abdominal lymphadenopathy in one-third of the cases of hairy cell leukaemia [17]. Massive splenomegaly with spontaneous splenic rupture at presentation is seen in 25% of patients [17]. Rarely, it may present as a focal splenic lesion (Figure 12).
Figure 11.

Images from a 65-year-old male with acute myelogenous leukaemia. (a) Axial contrast-enhanced CT image reveals mild hepatosplenomegaly with multiple well-defined low attenuation, non-enhancing, <1 cm micronodules (white arrows) in the spleen due to leukaemic deposits. An associated small linear area of splenic infarct (black arrow) is also noted. (b) Axial contrast-enhanced CT image of a 60-year-old patient with clinical suspicion of fungal microabscesses reveals multiple well-defined low attenuation, minimally enhancing, subcentimetre nodules (white arrows) in the normal-sized spleen making it difficult to differentiate from leukaemic lesions; however, hyperintense signal on T2 weighted images with rim enhancement on MRI (not shown) were suggestive of fungal microabscesses.
Figure 12.
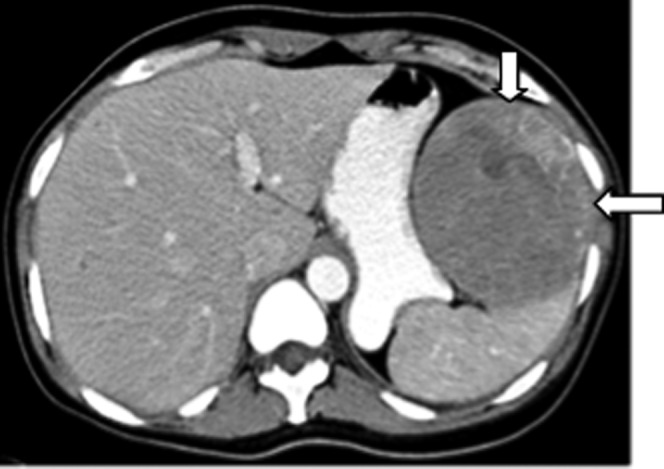
Image from a 49-year-old female with Hairy cell leukaemia and severe left upper quadrant pain. Contrast-enhanced axial CT revealed a well-defined heterogeneously enhancing solitary exophytic splenic lesion (white arrows). Biopsy was consistent with hairy cell leukaemia involving the spleen.
Mastocytosis
Mastocytosis is a rare disease of adults characterised by mast cell infiltration of various organs of the body, including skin. Imaging findings in systemic mastocytosis include sclerotic osseous lesions, hepatosplenomegaly, lymphadenopathy, ascites, bowel wall thickening and metastatic soft tissue calcification in the spleen or calcified Gamna–Gandy bodies (Figure 13) [18]. Aggressive subtypes of systemic mastocytosis have a poor prognosis and usually present with liver fibrosis, hypersplenism and Budd–Chiari syndrome. Since organ infiltration owing to aggressive systemic mastocytosis is not FDG-avid, FDG PET has no role in the clinical staging in these patients [19].
Figure 13.

Images from a 44-year-old female with aggressive systemic mastocytosis. Contrast-enhanced CT scan of the abdomen, (a) coronal soft tissue and (b) axial bone windows reveal moderate hepatosplenomegaly with multiple splenic calcifications (long black arrow), mesenteric and retroperitoneal adenopathy (short black arrow) and diffusely sclerotic bones (white arrow). The patient also had oesophageal varices due to portal hypertension (not shown), which is a reported finding in aggressive systemic mastocytosis.
Myelofibrosis
Myelofibrosis is a chronic myeloproliferative disorder of adults with a poor prognosis. Imaging manifestations include osteosclerosis, hepatosplenomegaly and rarely lymphadenopathy. Splenomegaly is the most consistent finding, and it is sometimes massive. Associated splenic infarction and EMH have also been reported (Figure 14) [20]. Reported 18F-FDG PET scan findings in myelofibrosis include diffuse significantly increased FDG uptake in the massively enlarged spleen and liver with diffuse increased uptake in bone marrow [21].
Figure 14.

Images from a 56-year-old male with primary myelofibrosis. (a) Axial and (b) coronal T2 half-Fourier acquisition single-shot turbo spin-echo (HASTE) images reveal marked splenomegaly (long white arrow) with splenic infarct (short white arrow).
Multiple myeloma
Extraosseous involvement is seen in 10−16% of multiple myeloma patients, commonly in younger patients, with a more aggressive course. Splenic involvement is seen in 31% of myeloma patients at autopsy [22]. Imaging findings of splenic involvement are non-specific, including splenomegaly (Figure 15), with or without multiple focal splenic lesions [23], which can be FDG-avid.
Figure 15.

Images from a 59-year-old male with relapsed refractory IgG myeloma. (a) Axial T1 post-contrast venous phase and (b) coronal T1 post-contrast delayed phase MRI reveal moderate hepatosplenomegaly that was histopathologically proved to be a result of a combination of cirrhosis and multiple myeloma. Note the multiple tiny hypointense nodules in the spleen representing Gamna–Gandy bodies (long white arrow) due to underlying cirrhosis of liver with portal hypertension. Note the heterogeneous appearance of bone marrow of the lumbar spine (short white arrow) secondary to multiple myeloma.
Non-neoplastic splenic lesions in haematological malignancies
Infection
MRI is the imaging modality of choice in diagnosing splenic infections with a sensitivity of 100% and accuracy of 97% [24]. On MRI, the signal intensity of the fungal lesions usually varies depending on the treatment and phase of disease [6]. Acute splenic fungal lesions appear as multiple, subcentimetre rounded lesions, which are hypointense on T1 weighted images, hyperintense on T2 weighted images (Figure 16) with rim enhancement on post-contrast MRI [6,9,24]. Hypoenhancement, less uniformity and relatively larger lymphoma nodules help to differentiate lymphoma deposits from fungal nodules, which often have central or rim enhancement. Moreover, significant splenic hilar lymphadenopathy is not a feature of splenic infection [4].
Figure 16.

Hepatosplenic fungal (candida) microabscesses in a 60-year-old male with acute myelogenous leukaemia. (a) Axial T2 weighted and (b) post-contrast T1 weighted images show multiple tiny (<1 cm diameter) T2 high-signal intensity lesions with thin rim enhancement on post-contrast T1 weighted images in the liver (long white arrow) and spleen (short white arrow) consistent with microabscesses. In contrast, focal lymphomatous lesions involving the spleen are usually larger lesions with isointense signal on T1 (not shown), and (c) T2 weighted images compared with the spleen (white arrow) and hypoenhancement on (d) post-contrast T1 weighted images in an enlarged spleen (white arrow). Note the multiple enlarged lymph nodes in the portocaval (small black arrow) and retroperitoneal (long black arrow) regions due to small lymphocytic lymphoma.
Extramedullary haematopoiesis
EMH may be seen in myelofibrosis, chronic leukaemia, multiple myeloma or other systemic conditions with chronic anaemia. It commonly involves the liver, spleen and paraspinal regions of the chest. On CT, splenic EMH is seen as unifocal or multifocal, solid and well-circumscribed masses. On MRI, active lesions are of intermediate signal on T1 weighted images, hyperintense on T2 weighted images, with minimal enhancement after intravenous contrast administration (Figure 17). Older, inactive lesions may appear hypointense on T1 and T2 weighted sequences [9].
Figure 17.

Images of a 63-year-old male with chronic myeloid leukaemia and extramedullary haematopoiesis. (a) Axial T2 and (b) T1 axial dynamic venous MRI reveals a normal-sized spleen with a focal lobulated lesion in its anterior aspect appearing heterogeneously hyperintense on T2 weighted images (black arrow), hypointense on T1 (not shown) and with minimal enhancement on post-gadolinium fat suppressed gradient recalled echo T1 weighted image (white arrow).
Other complications
The spleen can become massively enlarged, particularly in indolent lymphomas (Figure 4), hairy cell leukaemia, chronic myelogenous leukaemia, polycythaemia vera and myelofibrosis [5]. Splenic infarcts [5] can also occur, especially with massive splenomegaly. Splenic rupture, although very rare in haematological malignancies, is usually due to DLBCL [5], leukaemia [16] and myelofibrosis [20]. Other complications seen with splenic lymphoma include secondary infection, splenic vein thrombosis and hypersplenism [4].
MRI can be used to differentiate focal splenic lesions in patients with haematological malignancies [9]. Focal lymphomatous lesions are usually minimally hyperintense to isointense on T2 weighted images with minimal enhancement on post-contrast images and are usually associated with lymphadenopathy. Fungal microabscesses are subcentimetre, uniform in size, variable T1 and T2 signal lesions depending on stage (active lesions showing rim enhancement on post-contrast images), and are usually associated with hepatic and pulmonary lesions. Focal splenic lesions due to sarcoidosis are hypointense on T2 with enhancement on delayed post-contrast images (Figure 18). Gamna–Gandy bodies are hypointense on T1 and T2 weighted images with blooming on gradient echo images. Haemangiomas are hyperintense on T2 weighted images, with nodular peripheral enhancement on early arterial phase and uniform fill in delayed post-contrast images [9].
Figure 18.

Images from a 65-year-old male with known pulmonary sarcoidosis. (a) Axial T2 weighted and (b) delayed post-contrast T1 weighted images reveal multiple <1 cm, T2 hypointense lesions involving the spleen with uniform enhancement only on delayed post-contrast images (white arrows) and are suggestive of sarcoidosis. Similar lesions are noted in the liver (black arrow).
Role of splenic biopsy
The most common indications for percutaneous splenic biopsy are unifocal or multifocal splenic lesions, which are indeterminate on imaging [1]. Ultrasound-guided needle biopsy is a safe and effective diagnostic tool with high diagnostic accuracy for both focal and diffuse splenic involvement by disease. Overall, similar diagnostic accuracies were reported for fine-needle aspiration (FNA) (86.5%) and core-needle biopsy (CNB) (92%) in splenic diseases [25]. Reported complications have included haemorrhage (1.4–8.3%) and rarely pneumothorax, pleural effusion, colonic or other adjacent organ injuries with lower reported risk of bleeding associated with FNA than with CNB. Morbidity of the procedure is reduced by targeting the largest and most peripheral lesions and using small gauge needles (18- or 20-gauge) for biopsy. Reduced complication rates owing to real time visualisation of the needle track in multiple planes under sonographic guidance make it safer, with CT-guided biopsy being reserved for the lesions that are not well visualised on sonography [26]. Diagnostic splenectomy has a higher reported mortality rate of 2.9%, a morbidity rate of 37% and higher post-operative sepsis and pneumonia [25].
Conclusion
CT, MRI and PET/CT are complimentary tools for the non-invasive assessment of splenic involvement in various haematological malignancies. Many haematological malignancies can involve the spleen with overlapping imaging manifestations. However, several of the malignancies demonstrate characteristic imaging appearances. Furthermore, when a specific diagnosis is not possible, imaging and clinical findings outside the spleen may help to narrow the differential diagnosis while confirmation can be obtained by pathological findings. Radiologists should be familiar with the imaging patterns of haematological malignancies involving spleen as well as non-neoplastic splenic findings common in these patients to facilitate their care and follow-up.
References
- 1.Robertson F, Leander P, Ekberg O. Radiology of the spleen. Eur Radiol 2001;11:80–95 [DOI] [PubMed] [Google Scholar]
- 2.Strijk SP, Theo Wagener DJ, Bogman MJ. The spleen in Hodgkin’s disease: diagnostic value of CT. Radiology 1985;154:753–7 [DOI] [PubMed] [Google Scholar]
- 3.Paes FM, Kalkanis DG, Sideras PA, Serafini AN. FDG PET/CT of extranodal involvement in non-Hodgkin lymphoma and Hodgkin’s disease. Radiographics 2010;30:269–91 [DOI] [PubMed] [Google Scholar]
- 4.Bhatia K, Sahdev A, Reznek RH. Lymphoma of the spleen. Semin Ultrasound CT MR 2007;28:12–20 [DOI] [PubMed] [Google Scholar]
- 5.Lindsey S. Rabushka LS, Kawasbima A, Fishman EK. Imaging of the Spleen: CT with supplemental MR examination. Radiographics 1994;14:307–32 [DOI] [PubMed] [Google Scholar]
- 6.Leite NP, Kased N, Hanna RF, Brown MA, Pereira JM, Cunha R, et al. Cross-sectional imaging of extranodal involvement in abdominopelvic lymphoproliferative malignancies. Radiographics 2007;27:1613–34 [DOI] [PubMed] [Google Scholar]
- 7.Dachman AH, Buck JL, Krishnan J, Aguilera NS, Buetow PC. Primary non-Hodgkin's splenic lymphoma. Clin Radiol 1998;53:137–42 [DOI] [PubMed] [Google Scholar]
- 8.De Jong PA, van Ufford HM, Baarslag HJ, de Haas MJ, Wittebol SH, Quekel LG, et al. CT and 18F-FDG PET for noninvasive detection of splenic involvement in patients with malignant lymphoma. AJR Am J Roentgenol 2009;192:745–53 [DOI] [PubMed] [Google Scholar]
- 9.Elsayes KM, Narra VR, Mukundan G, Lewis JS, Jr, Menias CO, Heiken JP. MR imaging of the spleen: spectrum of abnormalities. Radiographics 2005;25:967–82 [DOI] [PubMed] [Google Scholar]
- 10.Thieblemont C, Felman P, Bauchu EC, Traverse-Glehen A, Salles G, Berger F, et al. Splenic marginal-zone lymphoma: a distinct clinical and pathological entity. Lancet Oncol 2003;4:95–103 [DOI] [PubMed] [Google Scholar]
- 11.Guermazi A, Brice P, Kerviller ED. Extranodal Hodgkin disease: spectrum of disease. Radiographics 2001;21:161–79 [DOI] [PubMed] [Google Scholar]
- 12.Rini JN, Leonidas JC, Tomas MB, Palestro CJ. 18F-FDG PET versus CT for evaluating the spleen during initial staging of lymphoma. J Nucl Med 2003;44:1072–4 [PubMed] [Google Scholar]
- 13.Schaefer NG, Hany TF, Taverna C, Seifert B, Stumpe KD, von Schulthess GK, et al. Non-Hodgkin lymphoma and Hodgkin disease: coregistered FDG PET and CT at staging and restaging—do we need contrast-enhanced CT? Radiology 2004;232:823–9 [DOI] [PubMed] [Google Scholar]
- 14.Cheson BD, Pfistner B, Juweid ME, Gascoyne RD, Specht L, Horning SJ, et al. Revised response criteria for malignant lymphoma. J Clin Oncol 2007;25:579–86 [DOI] [PubMed] [Google Scholar]
- 15.Dimopoulos MA, Panayiotidis P, Moulopoulos LA. Waldenstrom's macroglobulinemia: clinical features, complications, and management. J Clin Oncol 2000;18:214–32 [DOI] [PubMed] [Google Scholar]
- 16.Heiberg E, Wolverson MK, Sundaram M, Shields JB. CT findings in leukemia. AJR Am J Roentgenol 1984;143:1317–23 [DOI] [PubMed] [Google Scholar]
- 17.Grever MR. How I treat hairy cell leukemia. Blood 2010;115:21–8 [DOI] [PMC free article] [PubMed] [Google Scholar]
- 18.Huang TY, Yam LT, Li CY. Radiological features of systemic mast-cell disease. Br J Radiol 1987;60:765–70 [DOI] [PubMed] [Google Scholar]
- 19.Zettinig G, Becherer A, Szabo M, Uffmann M, Dudczak R, Valent P, et al. FDG positron emission tomography in patients with systemic mastocytosis. AJR Am J Roentgenol 2002;179:1235–7 [DOI] [PubMed] [Google Scholar]
- 20.Cloran F, Banks KP. AJR teaching file: Diffuse osteosclerosis with hepatosplenomegaly. AJR Am J Roentgenol 2007;188:S18–20 [DOI] [PubMed] [Google Scholar]
- 21.Burrell SC, Fischman AJ. Myelofibrosis on F-18 FDG PET Imaging. Clin Nucl Med 2005. ; 30:674. [DOI] [PubMed] [Google Scholar]
- 22.Oshima K, Kanda Y, Nannya Y, Kaneko M, Hamaki T, Suguro M, et al. Clinical and pathologic findings in 52 consecutively autopsied cases with multiple myeloma. Am J Hematol 2001;67:1–5 [DOI] [PubMed] [Google Scholar]
- 23.Hall MN, Jagannathan JP, Ramaiya NH, Shinagare AB, Van denAbbeele AD. Imaging of extraosseous myeloma: CT, PET/CT, and MRI Features. AJR Am J Roentgenol 2010;195:1057–65 [DOI] [PubMed] [Google Scholar]
- 24.Semelka RC, Kelekis NL, Sallah S, Worawattanakul S, Ascher SM. Hepatosplenic fungal disease: diagnostic accuracy and spectrum of appearances on MR imaging. AJR Am J Roentgenol 1997;169:1311–16 [DOI] [PubMed] [Google Scholar]
- 25.Gómez-Rubio M, López-Cano A, Rendón P, Muñoz-Benvenuty A, Macías M, Garre C, et al. Safety and diagnostic accuracy of percutaneous ultrasound-guided biopsy of the spleen: a multicenter study. J Clin Ultrasound 2009;37:445–50 [DOI] [PubMed] [Google Scholar]
- 26.Kang M, Kalra N, Gulati M, Lal A, Kochhar R, Rajwanshi A. Image guided percutaneous splenic interventions. Eur J Radiol 2007;64:140–6 [DOI] [PubMed] [Google Scholar]