Abstract
Objectives
Form discordance of cavity walls (FDCW) and form concordance of cavity walls (FCCW) in multislice spiral CT (MSCT) were investigated to determine their value in differentiating between peripheral lung cancer cavities and single pulmonary tuberculous thick-walled cavities. An assessment of the role of multiplanar reconstruction (MPR) in detecting FDCW and FCCW was also performed.
Methods
MSCT cross-sectional images of 116 consecutive cases (including 60 cases with available MPR images) with peripheral lung cancer cavities and 118 consecutive cases (including 62 cases with available MPR images) with single pulmonary tuberculous thick-walled cavities (wall thickness >3 mm) were retrospectively analysed. According to the characteristics of cavitary internal and external walls on MSCT, these cavities were divided into two types (FDCW and FCCW). FDCW was further divided into three subtypes (FDCW-I, FDCW-II and FDCW-III); FCCW was further divided into two subtypes (FCCW-I and FCCW-II). Results: On the cross-sectional and MPR images, the total detection rate of FDCW-I and FDCW-III in peripheral lung cancer cavities was 76.7% (89/116) and 93.3% (56/60), respectively, whereas the total detection rate of FCCW-I and FCCW-II in single pulmonary tuberculous thick-walled cavities was 75.4% (89/118) and 91.9% (57/62), respectively.
Conclusions
FDCW-I, FDCW-III, FCCW-I and FCCW-II were valuable in differentiating between peripheral lung cancer cavities and single pulmonary tuberculous thick-walled cavities. MPR could improve the detection of FDCW-I and FDCW-III in peripheral lung cancer cavities and FCCW-I and FCCW-II in single pulmonary tuberculous thick-walled cavities.
Cavities are frequent image findings in a variety of pulmonary diseases. Many of these diseases, including both lung cancer and pulmonary tuberculosis, can form a cavity during their course [1-3]. The cavities formed during these two particular diseases are difficult to distinguish [1,4,5], particularly in the case of peripheral lung cancer cavities and single pulmonary tuberculous thick-walled cavities. Although numerous studies have been conducted in this area, there is still no pertinent literature on the differential diagnostic value of form concordance or discordance of cavitary internal and external walls obtained from multislice spiral CT (MSCT). The aim of this study was to analyse MSCT manifestations of form discordance of cavity walls (FDCW) and form concordance of cavity walls (FCCW) to ascertain their value in differentiating between peripheral lung cancer cavities and single pulmonary tuberculous thick-walled cavities. In addition, the role of multiplanar reconstruction (MPR) in detecting FDCW and FCCW is assessed.
Methods and materials
Patients
Between May 2006 and June 2008, 116 consecutive cases of peripheral lung cancer cavities confirmed using pathological specimens obtained through surgical resection (n=80) or CT-guided transthoracic needle aspiration (n=36) were retrospectively analysed. The patients ranged in age from 36 to 76 years (mean age, 58 years) and included 76 males and 40 females. All cavities ranged in diameter from 0.5 to 5.6 cm (mean, 3.2±0.86 cm). In total, 19 cavities were <1.0 cm in diameter, 50 were between 1.0 and 3.0 cm and 47 were >3.0 cm in diameter. Among the 116 cases, 78 were squamous cell carcinomas, 20 were adenocarcinomas, 9 were small cell carcinomas, 4 were bronchioloalveolar carcinomas, 3 were adenosquamous carcinomas and 2 were large cell carcinomas.
In addition, 118 consecutive cases of single pulmonary tuberculous thick-walled cavities (wall thickness >3 mm) proven pathologically were retrospectively analysed. The patients ranged in age from 19 to 79 years (mean age, 42 years) and included 66 males and 52 females. Cavities ranged in diameter from 0.5 to 5.0 cm (mean, 2.8±0.62 cm). Of these cavities, 38 were <1.0 cm in diameter, 66 were between 1.0 and 3.0 cm and 14 were over 3.0 cm in diameter.
CT examination
All images were obtained using a 16-slice spiral CT system (Somatom Sensation 16; Siemens Medical Solutions, Erlangen, Germany) or a 64-slice spiral CT system (Lightspeed VCT 64; GE Healthcare, Milwaukee, WI). The following parameters were used: 100–120 kV, 120–130 mA, 0.750–0.875 for pitch, field of view 350 mm, 512×512 for matrix and 5 mm of section thickness and reconstruction interval. At the same time, for 122 cases (60 cases of peripheral lung cancer cavities and 62 cases of single pulmonary tuberculous thick-walled cavities), parameters of 1 mm section thickness and reconstruction interval were adopted; data were delivered to the workstation (Siemens Syngo CT 2006S or GE AW4.2) for further MPR operation.
All image post-processing operations were performed by an experienced radiologist.
Cavity categories
According to the characteristics of cavitary internal and external walls on MSCT, the cavities were divided into two types (FDCW and FCCW). FDCW was further divided into three subtypes: FDCW-I are cavities with smooth inner walls and uneven outer walls, FDCW-II are those with smooth outer walls and uneven inner walls and FDCW-III have uneven outer and inner walls and discordant uneven sectors. FCCW was also further divided into two subtypes: FCCW-I cavities have smooth inner and outer walls, whereas FCCW-II show uneven outer and inner walls and concordant uneven sectors (Figure 1). When a cavity showed different forms on different layers, we based our classification on the form of the central layer. The more complex form was selected over the standard when different forms appeared in different directions; for example, if a cavity took on FDCW-III on the coronal plane but FCCW-I on the sagittal plane, we chose FDCW-III as the representative of that cavity.
Figure 1.

Block diagram of the various types of cavities. FCCW-I and II, form concordance of cavity walls I and II; FDCW-I, II and III, form discordance of cavity walls I, II and III.
Cavity subtypes were identified by two experienced radiologists. Only those cases in which a consensus was reached by both radiologists were selected for further analysis. Six cases were excluded owing to some discordance between the two radiologists, because there was one or more septations inside the cavities.
Statistical analysis
The frequencies of the five subtypes in peripheral lung cancer cavities and single pulmonary tuberculous thick-walled cavities were globally compared using a χ2 test. The frequency of each subtype in the two diseases was then respectively compared using a χ2 test. The total detection rate of FDCW-I and FDCW-III in peripheral lung cancer cavities on the cross-sectional images and MPR images was compared and assessed using a McNemar test; the total detection rate of FCCW-I and FCCW-II in single pulmonary tuberculous thick-walled cavities on the cross-sectional images and MPR images was also compared and assessed using a McNemar test. The relationship between the different forms and histological subtypes of peripheral lung cancer cavities was globally compared using a χ2 test. All statistical analyses were performed using commercially available software (SPSS, release 11.5; SPSS, Chicago, IL).
Results
The frequencies of FDCW-I, FDCW-II, FDCW-III, FCCW-I and FCCW-II in peripheral lung cancer cavities and single pulmonary tuberculous thick-walled cavities are presented in Table 1.
Table 1. The frequencies of FDCW-I, FDCW-II, FDCW-III, FCCW-I and FCCW-II in peripheral lung cancer cavities and single pulmonary tuberculous thick-walled cavities.
| Cavity type | FDCW-I |
FDCW-II |
FDCW-III |
FCCW-I |
FCCW-II |
Total |
| n (%) | n (%) | n (%) | n (%) | n (%) | n (%) | |
| Peripheral lung cancer cavity | 28 (24.1) | 18 (15.5) | 61 (52.6) | 4 (3.4) | 5 (4.3) | 116 (100) |
| Pulmonary tuberculosis cavity | 5 (4.2) | 20 (16.9) | 4 (3.4) | 46 (39.0) | 43 (36.4) | 118 (100) |
| χ2 | 19.124 | 0.088 | 70.570 | 43.962 | 37.037 | 131.476 |
| p-Value | 0.000 | 0.767 | 0.000 | 0.000 | 0.000 | 0.000 |
FCCW-I and II, form concordance of cavity walls I and II; FDCW-I, II and III, form discordance of cavity walls I, II and III.
The results suggest that the difference in the frequencies of the five subtypes in peripheral lung cancer cavities and single pulmonary tuberculous thick-walled cavities was statistically significant (χ2=131.476; p<0.01). The frequencies of FDCW-I and FDCW-III in peripheral lung cancer cavities were clearly higher than in single pulmonary tuberculous thick-walled cavities (χ2=19.124 and 70.570, respectively; p<0.01). If FDCW-I and FDCW-III were combined as a single appraisal index, then 89 cases were positive among the 116 cases of peripheral lung cancer cavities in conventional cross-sectional images (Figure 2). This yielded a sensitivity of 76.7% (89/116) and a specificity of 92.4% (109/118). The occurrence of FDCW-II in single pulmonary tuberculous thick-walled cavities was slightly higher than that in peripheral lung cancer cavities, but the difference was not statistically significant (χ2=0.088; p>0.05). The frequency of FCCW-I and FCCW-II in single pulmonary tuberculous thick-walled cavities was significantly higher than in peripheral lung cancer cavities (χ2=43.962 and 37.037, respectively; p<0.01). When FCCW-I and FCCW-II were combined as a single appraisal index, 89 cases were detected in 118 cases of single pulmonary tuberculous thick-walled cavities in conventional cross-sectional images (Figure 3). This yielded a sensitivity of 75.4% (89/118) and a specificity of 92.2% (107/116).
Figure 2.
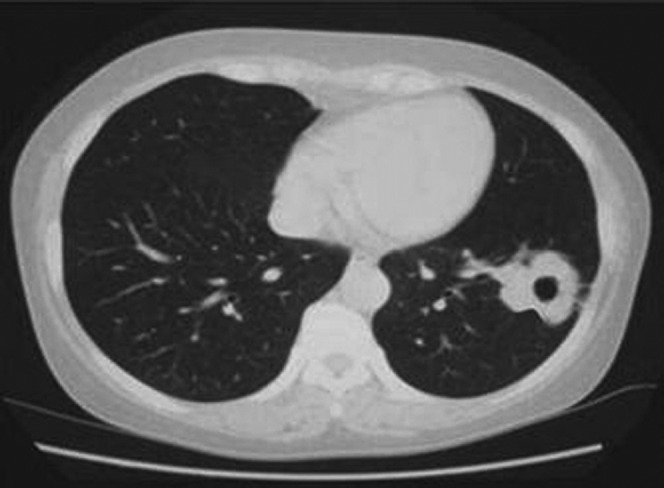
Chest CT scan of a patient with a peripheral lung cancer cavity showing FDCW-I in the left lower lobe.
Figure 3.
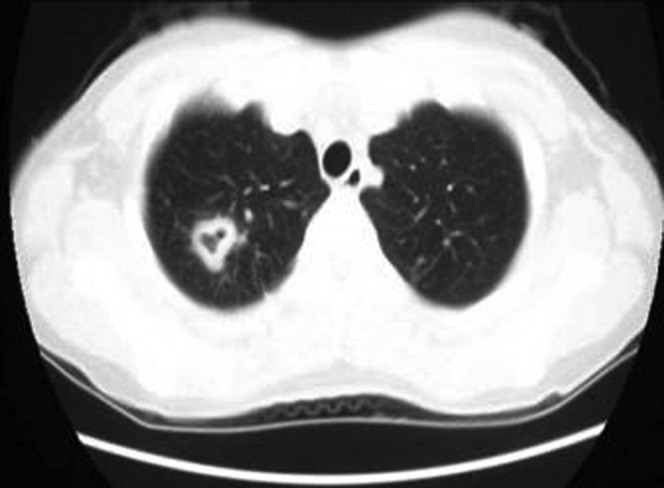
Chest CT scan of a patient with a pulmonary tuberculosis cavity showing FCCW-II in the right upper lobe.
A comparison was made of the MPR images and conventional cross-sectional images. Among 60 cases of peripheral lung cancer cavities, 45 manifested as FDCW-I and FDCW-III on conventional cross-sectional images. MPR detected 56 cases for a detection rate of 93.3%. There was a significant difference between the results of conventional cross-sectional images and MPR images for the McNemar test (χ2=9.091; p<0.01) (Table 2). Furthermore, MPR showed the discordance of cavitary inner and outer walls more clearly than did cross-sectional images (Figure 4). However, for single pulmonary tuberculous thick-walled cavities that manifested as FDCW-I and FDCW-III, both conventional cross-sectional images and MPR images were only capable of detecting six cases.
Table 2. The total detection rate of FDCW-I and FDCW-III on cross-sectional images and MPR images in peripheral lung cancer cavities.
| Cross-sectional images | MPR |
Total | |
| + | − | ||
| + | 45 | 0 | 45 |
| − | 11 | 4 | 15 |
| Total | 56 | 4 | 60 |
FDCW-I and III, form discordance of cavity walls I and III; MPR, multiplanar reconstruction.
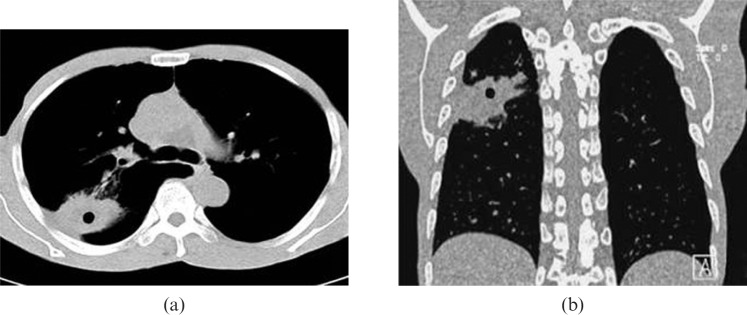
Figure 4.
Chest CT scan of a patient with a peripheral lung cancer cavity in the right upper lobe. (a) Multiplanar reconstruction (MPR) shows the cavity presents as FDCW-I and is clearer than (b) the conventional cross-sectional image.
In 62 cases of single pulmonary tuberculous thick-walled cavities, 47 cases presented as FCCW-I and FCCW-II on conventional cross-sectional images. MPR detected 57 cases (Figure 5) for a detection rate of 91.9%. There was a significant difference between the results of conventional cross-sectional images and MPR images for the McNemar test (χ2=8.100, p<0.01) (Table 3). By contrast, only five cases of FCCW-I and FCCW-II in peripheral lung cancer cavities were detected by conventional cross-sectional images or MPR images.
Figure 5.
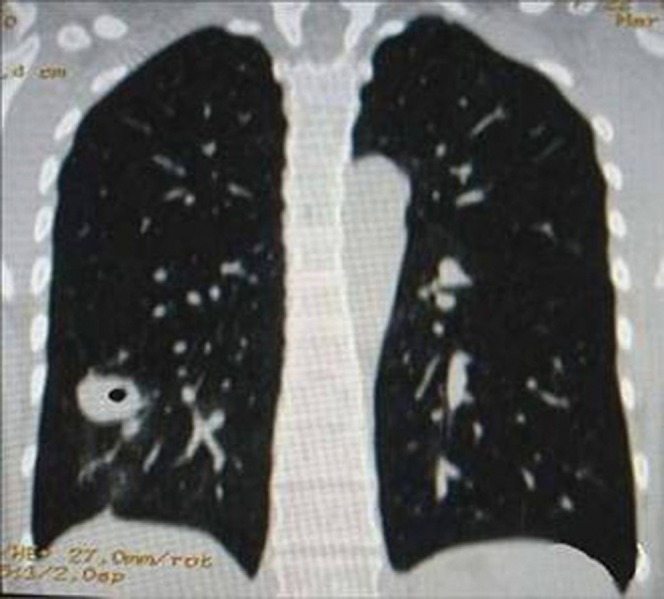
Chest CT scan of a patient with a pulmonary tuberculosis cavity showing FCCW-I in the right lower lobe.
Table 3. The total detection rate of FCCW-I and FCCW-II on cross-sectional images and MPR images in single pulmonary tuberculous thick-walled cavities.
| Cross-sectional images | MPR |
Total | |
| + | − | ||
| + | 47 | 0 | 47 |
| − | 10 | 5 | 15 |
| Total | 57 | 5 | 62 |
FCCW-I and II, form concordance of cavity walls I and II; MPR, multiplanar reconstruction.
The relationship between the different forms and histological subtypes of peripheral lung cancer cavities are presented in Table 4. The results suggest that different histological subtypes of peripheral lung cancer cavities have no predilection for different forms (χ2=10.179; p>0.05).
Table 4. The relationship between different forms and histological subtypes of peripheral lung cancer cavities.
| Histological subtype | FDCW-I |
FDCW-II |
FDCW-III |
FCCW-I |
FCCW-II |
Total |
| n (%) | n (%) | n (%) | n (%) | n (%) | n (%) | |
| Squamous cell carcinoma | 19 (16.4) | 15 (12.9) | 39 (33.6) | 2 (1.7) | 3 (2.6) | 78 (67.2) |
| Adenocarcinoma | 5 (4.3) | 2 (1.7) | 10 (8.6) | 1 (0.9) | 2 (1.7) | 20 (17.2) |
| Small cell carcinoma | 2 (1.7) | 1 (0.9) | 5 (4.3) | 1 (0.9) | 0 (1.7) | 9 (7.8) |
| Bronchioloalveolar carcinoma | 1 (0.9) | 0 (0.0) | 3 (2.6) | 0 (0.0) | 0 (0.0) | 4 (3.4) |
| Adenosquamous carcinoma | 0 (0.0) | 0 (0.0) | 3 (2.6) | 0 (0.0) | 0 (0.0) | 3 (2.6) |
| Large cell carcinoma | 1 (0.9) | 0 (0.0) | 1 (0.9) | 0 (0.0) | 0 (0.0) | 2 (1.7) |
| Total | 28 (24.1) | 18 (15.5) | 61 (52.6) | 4 (3.4) | 5 (4.3) | 116 (100) |
FCCW-I and II, form concordance of cavity walls I and II; FDCW-I, II and III, form discordance of cavity walls I, II and III.
Discussion
To better understand the different cavity subtypes observed in peripheral lung cancer and pulmonary tuberculosis, it is necessary to first consider the pathological basis of the formation of the various types of cavities. A cavity implies that the central portion of the lung lesion has undergone necrosis, has deliquesced and has been expelled via the bronchus; a gas-containing space remains [6]. Radiologically, a cavity is defined as a gas-containing space within the lung that is surrounded by a wall the thickness of which is >1 mm.
The outer margin of a tumour is also a peripheral lung cancer cavitary side wall. Its shape is proportional to the growth velocity of each part of the peripheral lung cancer and is blocked by the larger pulmonary vessels and bronchi [7,8]. The form of cavitary inner wall depends on whether the tissue necrosis of the tumour is even or whether there is a wall nodule. A peripheral lung cancer cavity most frequently appears as FDCW-III, followed by FDCW-I and is only rarely seen as FDCW-II, FCCW-I or FCCW-II. Because the growth velocity is discordant and blocked by the larger pulmonary vessels and bronchi, the necrosis is also uneven and a wall nodule is present at the same time [9].
The form of the internal and external walls of the pulmonary tuberculosis cavity is also dependent on the pathological type. It is worth mentioning that a peripheral lung cancer cavity can be discriminated from a caseous tuberculoma cavity and fibrotic thick-walled cavity. The surface of the tuberculoma has an integral thick fibrous capsule that is smooth and of low fluctuation. The form of the cavitary inner wall will depend on whether the caseous necrosis is discharged completely and whether there is a wall nodule. The not-yet-liquefied caseous matter can shape the wall nodule inside the caseous cavity. The wall of a fibrous thick-walled tuberculosis cavity is mainly made up of fibrous tissue; thus, the shape of the wall is principally a result of the contraction and drag of the fibrous tissue. Therefore, a tuberculoma cavity is often manifested as FCCW-I and FDCW-II, whereas a fibrous thick-walled cavity is often shown as FCCW-II. FDCW-I and FDCW-III are uncommon in pulmonary tuberculosis cavities.
What is the value of the differential diagnosis of FDCW-I, FDCW-II, FDCW-III, FCCW-I and FCCW-II in peripheral lung cancer cavities and single pulmonary tuberculous thick-walled cavities? Previous studies have been carried out on the use of CT performance in differentiating peripheral lung cancer cavities and single pulmonary tuberculous thick-walled cavities. These earlier works focused primarily on whether the side wall of the cavity was lobulated, the inner wall had rugosity, the cavity wall was even or uneven or whether there were other features such as spiculate signs, processus spinosus, pleura indentation signs, calcification foci, satellite focus, bronchial dissemination focus and contrast-enhanced CT characteristics, among others [9-13].
However, these signs can often also appear in both peripheral lung cancer cavities and single pulmonary tuberculous thick-walled cavities; factors such as the unevenness of the cavity wall, sublobe signs, spiculate signs, pleural indentation signs and calcification foci are common in either disease. Other common signs of peripheral lung cancer cavities can sometimes be found in single pulmonary tuberculous cavities; the reverse is also true. Moreover, the two cavitary diseases do not always demonstrate the above-mentioned typical signs. In our study group, 12 patients with single pulmonary tuberculous thick-walled cavity manifested as FDCW-II and were misdiagnosed with, or suspected of having, peripheral lung cancer cavity (Figure 6). The retrospective analysis on the causes of misdiagnosis suggests that it occurred mainly because we focused only on the unevenness of the cavity wall and the roughened inner wall and did not pay significant attention to the characteristics of the form concordance of the cavitary inner and outer walls.
Figure 6.
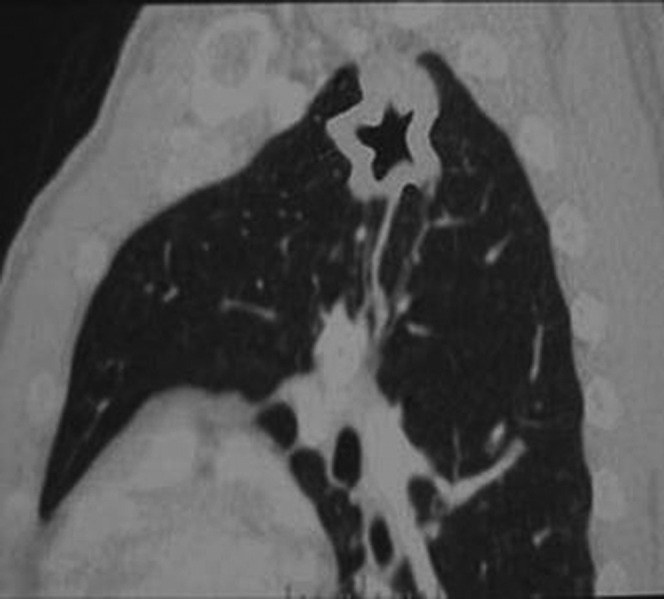
Chest CT scan of a patient with a pulmonary tuberculosis cavity in the left upper lobe. The cavity shows FCCW-II and an uneven thickness of cavity wall.
In this study, the difference in the frequencies of the five subtypes in peripheral lung cancer cavities and single pulmonary tuberculous thick-walled cavities was significant. The sensitivity of the detection rate of FDCW-I and FDCW-III in peripheral lung cancer cavities was 76.7% (89/116) and the specificity was 92.4% (109/118). For single pulmonary tuberculous thick-walled cavities, the sensitivity of the detection rate of FCCW-I and FCCW-II was 75.4% (89/118) with a specificity of 92.2% (107/116). There was no obvious difference in FDCW-II between pulmonary tuberculous single cavities and peripheral lung cancer cavities. We believe that, in differentiating between peripheral lung cancer cavities and single pulmonary tuberculous thick-walled cavities, a cavity showing as FDCW-I or FDCW-III implies with a good degree of certainty that it is a peripheral lung cancer cavity. If a cavity shows as FCCW-I or FCCW-II, it is almost certainly a pulmonary tuberculous cavity. If a cavity shows as FDCW-II, however, further information needs to be obtained for identification.
We also conclude from our studies that MPR can improve the detection of FDCW-I, FDCW-III, FCCW-I and FCCW-II. In addition to its rapid scanning speed and wide scanning coverage, the important advantage of MSCT is that it gives a lamellar image and isotropic volume data. The isotropic volume data can be rebuilt from images of different angles and planars. Moreover, the data can be rebuilt retrospectively. This technology is helpful for showing the tiny characteristics of cavitary internal and external walls that conventional cross-sectional images cannot show or that show unclearly [14,15].
In this study, compared with conventional cross-sectional images, MPR could detect 18.3% higher incidences of FDCW-I and FDCW-III in peripheral lung cancer cavities and 16.1% higher incidences of FCCW-I and FCCW-II in single pulmonary tuberculous thick-walled cavities. MPR could increase the detection rate of FDCW-I and FDCW-III in peripheral lung cancer cavities and FCCW-I and FCCW-II in single pulmonary tuberculous thick-walled cavities, which made possible the differential diagnosis of peripheral lung cancer cavity and single pulmonary tuberculous thick-walled cavity.
It should be noted that there are many forms of cavity and in this study we chose only some common types. Other forms, such as some separations within the cavity, need to be studied further.
References
- 1.Winer-Muram H. The solitary pulmonary nodule. Radiology 2006;239:34–49 [DOI] [PubMed] [Google Scholar]
- 2.Marom EM, Martinez CH, Truong MT, Lei X, Sabloff BS, Munden RF, et al. Tumor cavitation during therapy with antiangiogenesis agents in patients with lung cancer. J Thorac Oncol 2008;3:351–7 [DOI] [PubMed] [Google Scholar]
- 3.Okuma T, Matsuoka T, Yamamoto A, Oyama Y, Inoue K, Nakamura K, et al. Factors contributing to cavitation after CT-guided percutaneous radiofrequency ablation for lung tumors. J Vasc Interv Radiol 2007;18:399–404 [DOI] [PubMed] [Google Scholar]
- 4.Kobashi Y, Fukuda M, Nakata M, Oka M. Coexistence of metastatic lung cancer and pulmonary tuberculosis diagnosed in the same cavity. Int J Clin Oncol 2005;10:366–70 [DOI] [PubMed] [Google Scholar]
- 5.Honda O, Tsubamoto M, Inoue A, Johkoh T, Tomiyama N, Hamada S, et al. Pulmonary cavitary nodules on computed tomography: differentiation of malignancy and benignancy. J Comput Assist Tomogr 2007;31:943–9 [DOI] [PubMed] [Google Scholar]
- 6.Gadkowski LB, Stout JE. Cavitary pulmonary disease. Clin Microbiol Rev 2008;21:305–33 [DOI] [PMC free article] [PubMed] [Google Scholar]
- 7.Yang ZG, Sone S, Takashima S, Li F, Honda T, Maruyama Y, et al. High-resolution CT analysis of small peripheral lung adenocarcinomas revealed on screening helical CT. AJR 2001;176:1399–1407 [DOI] [PubMed] [Google Scholar]
- 8.Ma E, Yang Z, Li Y, Guo Y, Yu J, Deng Y. The solitary pulmonary tuberculous cavity and malignant cavity: comparison on multi-detector row CT. Sheng Wu Yi Xue Gong Cheng Xue Za Zhi 2008;25:903–7 [PubMed] [Google Scholar]
- 9.Park Y, Kim TS, Yi CA, Cho EY, Kim H, Choi YS. Pulmonary cavitary mass containing a mural nodule: differential diagnosis between intracavitary aspergilloma and cavitating lung cancer on contrast-enhanced computed tomography. Clin Radiol 2007;62:227–32 [DOI] [PubMed] [Google Scholar]
- 10.Ors F, Deniz O, Bozlar U, Gumus S, Tasar M, Tozkoparan E, et al. High-resolution CT findings in patients with pulmonary tuberculosis: correlation with the degree of smear positivity. J Thorac Imaging 2007;22:154–9 [DOI] [PubMed] [Google Scholar]
- 11.Kosaka N, Sakai T, Uematsu H, Kimura H, Hase M, Noguchi M, et al. Specific high-resolution computed tomography findings associated with sputum smear-positive pulmonary tuberculosis. J Comput Assist Tomogr 2005;29:801–4 [DOI] [PubMed] [Google Scholar]
- 12.Onn A, Choe DH, Herbst RS, Correa AM, Munden RF, Truong MT, et al. Tumor cavitation in stage I non-small cell lung cancer: epidermal growth factor receptor expression and prediction of poor outcome. Radiology 2005;237:342–7 [DOI] [PubMed] [Google Scholar]
- 13.Lee JY, Lee KS, Jung KJ, Han J, Kwon OJ, Kim J, et al. Pulmonary tuberculosis: CT and pathologic correlation. J Comput Assist Tomogr 2000;24:691–8 [DOI] [PubMed] [Google Scholar]
- 14.Wormanns D, Diederich S. Characterization of small pulmonary nodules by CT. Eur Radiol 2004;14:1380–91 [DOI] [PubMed] [Google Scholar]
- 15.Schoepf UJ, Bruening RD, Hong C, Eibel R, Aydemir S, Crispin A, et al. Multislice helical CT of focal and diffuse lung disease: comprehensive diagnosis with reconstruction of contiguous and high-resolution CT section from a single thin collimation scan. AJR 2001;177:179–84 [DOI] [PubMed] [Google Scholar]


