Abstract
The potential harmful effects of ionising radiation continue to be highlighted. Radiation reduction techniques have largely consisted of low-dose techniques rather than a shift to non-ionising methods of imaging. CT scanning is frequently employed for imaging the craniofacial skeleton despite being one of the key anatomical regions for radiation protection in view of the radiosensitive lens and thyroid gland. We describe a low flip angle gradient echo MRI sequence which provides high image contrast between bone and other tissues but reduces the contrast between individual soft tissues. This permits the “black bone” to be easily distinguished from the uniformity of the soft tissues. While maintaining a repetition time of 8.6 ms and an echo time of 4.2 ms, the flip angle which provided optimised suppression of both fat and water was identified to be 5°. The biometric accuracy of this sequence was confirmed using a phantom to obtain direct anatomical measurements and comparable CT scanning. The average discrepancy between black bone MRI measurements and direct anatomical measurements was 0.32 mm. Black bone MRI therefore has the potential to reduce radiation exposure by replacing CT scanning when imaging the facial skeleton, with particular scope for imaging benign conditions in the young.
Shortly after its introduction into clinical practice, the poor detail of bone and calcified tissues seen on MRI was reported as a significant limitation of the technique [1]. The superior imaging quality of cortical bone on CT and the subsequent ability to create three-dimensional reconstructions has largely superseded further development of MRI for this purpose.
The potential adverse effects of ionising radiation continue to be highlighted [2-5], with attention being largely focused on low dose techniques to decrease radiation exposure. The craniofacial skeleton is one of the key anatomical areas for radiation protection in view of the radiosensitive lens and thyroid gland. Imaging is frequently required for benign conditions in this region in young patient groups, making radiation protection paramount.
While MRI is increasingly finding its place in the imaging of pathological conditions of bone [6,7], the relatively poor detail achieved on standard sequences continues to be its main limitation. Ultra-short echo time (TE) techniques [8,9] show potential promise but cannot currently be performed on standard MRI scanners available in most hospitals.
Following preliminary work utilising gradient echo sequences to image pathology of the facial skeleton [10], we identified the parameters to obtain uniform contrast of the soft tissues. The aim of this study was to confirm the optimal flip angle for the sequence and determine the biometric accuracy of the technique. We present the “black bone” sequence, a novel technique to enable the differentiation of bone from an almost uniform contrast of the soft tissues.
Materials and methods
Flip angle
The ideal flip angle to suppress signal from both fat and water to provide a uniform soft-tissue contrast and therefore optimise bony definition was investigated using a human volunteer. Since the volunteer used in this study was one of the authors, ethical approval was not required. The investigation was completed on a 1.5 Telsa system (GE Medical Systems, Milwaukee, IL). Imaging was performed using the neurovascular array head coil with the volunteer in the conventional position for imaging of the head. Images were acquired in the axial plane using the gradient echo sequence with three-dimensional acquisition. The flip angle was decreased incrementally from 60° to 1° while maintaining the remaining scanning parameters (Table 1). The images were reviewed by the authors (non-blinded) on an Advantage Windows workstation (GE Medical Systems, Milwaukee, IL) to visually determine which sequence provided the most optimised result—as uniform a contrast as possible of the soft tissues with bone shown clearly.
Table 1. MRI scanning parameters.
| Parameter | Value |
| TR | 8.6 ms |
| TE | 4.2 ms |
| Slice thickness | 2.4 mm |
| Slice spacing | −1.2 mm |
| Scan FOV | 24 cm |
| Phase encode | 256 |
| Frequency encode | 256 |
| Receive bandwidth | 31.25 |
| ZIP | 2512 |
FOV, field of view; TE, echo time; TR, repetition time; ZIP, zero fill interpolation.
Biometric accuracy
The biometric accuracy of the black bone sequence was investigated utilising a custom-made phantom, consisting of a disarticulated skull confined within a watertight perspex anthromorphic shell filled with copper sulphate solution. This provided the opportunity for direct anatomical measurements in addition to imaging. The gold standard results were defined as those obtained from direct anatomical measurement. In addition, to assess how the black bone sequence compared with the current gold standard imaging technique for the craniofacial skeleton, comparable CT images were obtained. The biometric accuracy was determined by straight line measurements between paired anatomical points which could be identified directly on the phantom and on both black bone MRI and CT (Table 2). These included the distance between paired foramina and maximum heights and widths of bony structures.
Table 2. Anatomical measurements.
| Anatomical measurement | Imaging plane |
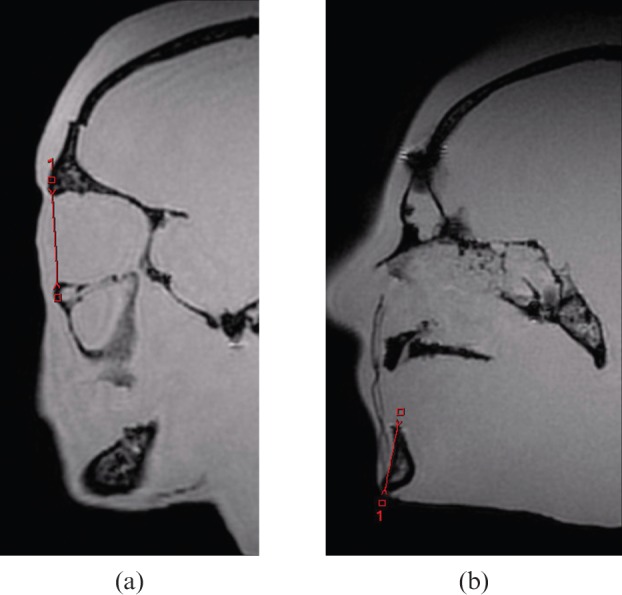
| 1. Maximum craniocaudal aperture of the right orbit (Figure 2) | Sagittal |
| 2. Maximum craniocaudal aperture of the left orbit | Sagittal |
| 3. Maximum height of the mandible from chin point in the midline (Figure 2) | Sagittal |
| 4. Maximum coronal dimension of the skull at the disarticulation point (cut surface) | Coronal |
| 5. Maximum coronal dimension of the skull cap at the disarticulation point (cut surface) | Coronal |
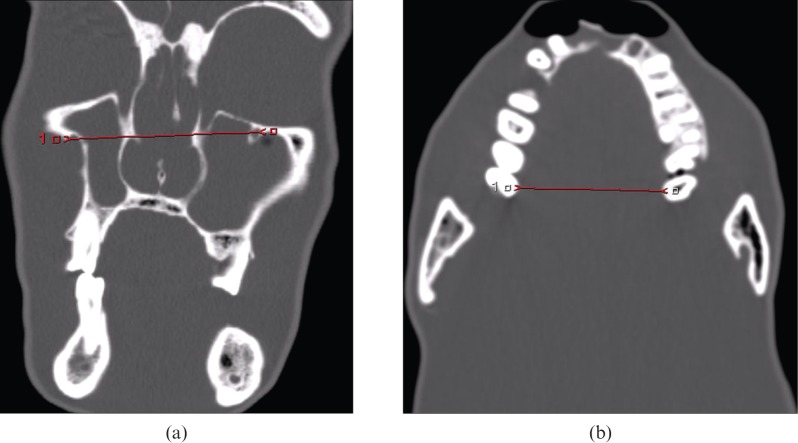
| 6. Distance between the lateral most aspect of the paired infra-orbital foramen (Figure 1) | Coronal |
| 7. Maximum craniocaudal aperture of the piriform aperture | Coronal |
| 8. Maximum coronal aperture of the piriform aperture | Coronal |
| 9. Distance between the lateral most aspect of the paired mental foramen (on both axial and coronal views) | Coronal |
| 10. Distance between the lateral most aspect of the paired mandibular condyles | Axial |
| 11. Maximum coronal dimension of the posterior hard palate between the most posterior identifiable molar teeth (Figure 1) | Axial |
| 12. Maximum coronal distance between the lateral surfaces of the paired posterior upper molar teeth | Axial |
Direct anatomical measurements
To minimise discrepancy owing to drying (noted to be up to 2 mm), the phantom was housed within its shell immersed in the copper sulphate solution until measurements were performed. Using vernier callipers (resolution 0.01 mm; accuracy <100±0.02 mm; 100–200±0.03 mm) each measurement was repeated and recorded 20 times on 2 separate occasions with a time interval of 2 weeks by 1 assessor.
MRI
The anthropometric shell was supported to maintain the phantom in the direct horizontal position consistent with standard positioning for imaging of the head. Using the pre-determined black bone sequence, images were acquired in the axial, sagittal and coronal planes. Using an Advantage Windows workstation, the images were reviewed to determine the image on which the anatomical points were most clearly identifiable and on which the measurements could be made. The image number for each measurement was recorded to ensure the same slice was used for repeated measurements. Each measurement was made using the cursor function and again repeated 20 times on 2 separate occasions by 1 assessor. To minimise bias, distance annotations were removed immediately after each measurement was recorded.
CT
Comparable CT images of the phantom were obtained on a 64-slice Spiral CT scanner (GE Medical Systems, Milwaukee, IL) with 0.625 mm slice thickness and the phantom positioned in the standard position for craniofacial imaging. Axial images were acquired with no gantry tilt and reconstructed in the sagittal and coronal planes. The images were again reviewed on an Advantage Windows workstation and the image number for each anatomical point recorded. Using the cursor function, the measurements were repeated 20 times on 2 separate occasions by the same assessor.
The use of a phantom permitted repeated imaging without movement artefacts and allowed comparable CT imaging and direct anatomical measurement. Examples of the measurements on CT and MRI are demonstrated in Figures 1 and 2.
Figure 1.
CT measurements: (a) infra-orbital foramina distance, (b) maxilla without teeth.
Figure 2.

Black bone MRI measurements: (a) obit, (b) mandible height.
The Mann–Whitney U-test and Kruskal–Wallis tests were performed using SPSS Version 18 (IBM, Armonk, NY) on a Windows PC with the null hypothesis that there was no significant difference between the groups (p<0.05).
Results
Flip angle
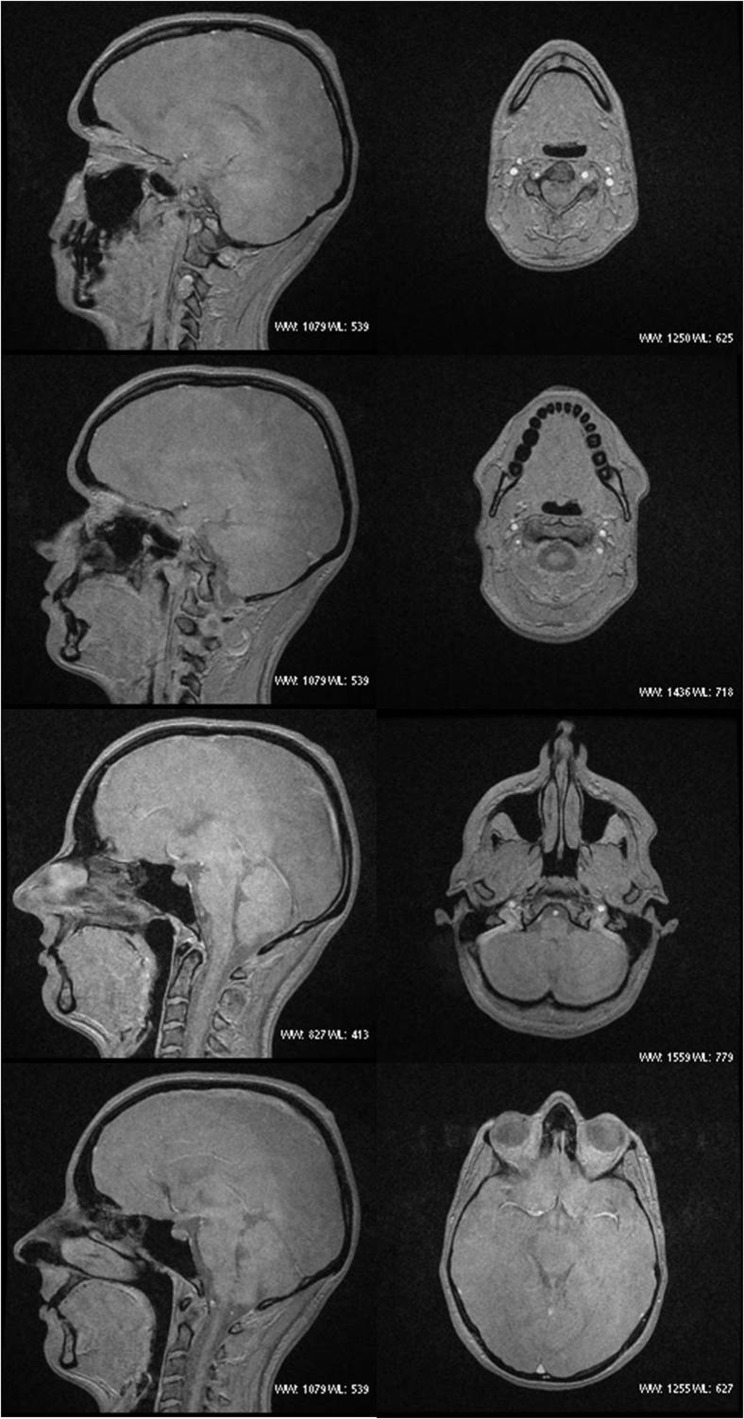
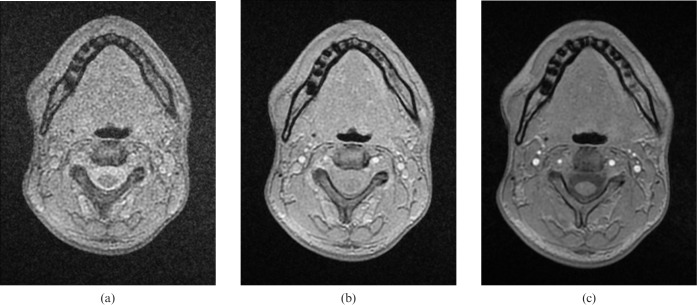
The ideal flip angle to effectively suppress signal from both fat and water was 5°. This resulted in an image where cortical bone appears black and is identifiable from the surrounding soft tissues, which appear as an almost uniform grey (Figure 3). The clarity of this appearance was lost with minimal deviation from 5° (Figure 4). The imaging time for the black bone sequence of an adult skull was approximately 4 min.
Figure 3.
Black bone MRI sagittal and axial images.
Figure 4.
Axial images, utilising flip angles of (a) 1°, (b) 3° and (c) 7°.
Biometric accuracy
Intraobserver concordance was high, with no statistical significance between the two groups of results. The measurements were therefore combined and analysed collectively for each modality.
Using the direct anatomical measurements as a reference group, no statistical difference was found for 3 of the 12 distances on MRI and 2 of the 12 distances on CT (Table 3). Whilst statistically different, the difference between the measurements for each group was <1 mm for all measurements (Table 4). The average discrepancy between MRI and anatomical values using the mean for each group was 0.32 mm (0.76%) and for CT it was 0.40 mm (0.76%). The mean difference between MRI and CT was 0.38 mm.
Table 3. Mann–Whitney U-test results highlighting in bold those distances where there was no significant difference in result.
| Anatomical vs MRI | Anatomical vs CT | CT vs MRI | |
| 1. Right orbit | <0.05 | <0.05 | <0.05 |
| 2. Left orbit | 0.11 | 0.48 | 0.22 |
| 3. Mandible height | <0.05 | <0.05 | 0.42 |
| 4. Coronal skull base | <0.05 | <0.05 | 0.11 |
| 5. Coronal skull cap | <0.05 | <0.05 | <0.05 |
| 6. Infra-orbital foramina | <0.05 | <0.05 | <0.05 |
| 7. Piriform aperture height | <0.05 | 0.27 | <0.05 |
| 8. Piriform aperture width | <0.05 | <0.05 | <0.05 |
| 9. Mental foramina | <0.05 | <0.05 | <0.05 |
| 10. Intercondylar distance | <0.05 | <0.05 | <0.05 |
| 11. Maxilla with teeth | 0.50 | 0.48 | 0.22 |
| 12. Maxilla without teeth | 0.28 | <0.05 | <0.05 |
Table 4. Mean and standard error (SE) results for distances.
| Measurement | Method | Mean (mm) | SE | Percentage difference compared with anatomical |
| 1. Right orbit | ||||
| Anatomical | 32.74 | 0.038 | ||
| MRI | 32.97 | 0.044 | 0.70 | |
| CT | 32.49 | 0.058 | 0.76 | |
| 2. Left orbit | ||||
| Anatomical | 32.89 | 0.020 | ||
| MRI | 32.87 | 0.031 | 0.06 | |
| CT | 32.80 | 0.051 | 0.27 | |
| 3. Mandible height | ||||
| Anatomical | 27.69 | 0.040 | ||
| MRI | 27.99 | 0.053 | 1.08 | |
| CT | 27.93 | 0.054 | 0.87 | |
| 4. Coronal skull base | ||||
| Anatomical | 139.48 | 0.040 | ||
| MRI | 139.95 | 0.034 | 0.33 | |
| CT | 140.04 | 0.055 | 0.40 | |
| 5. Coronal skull cap | ||||
| Anatomical | 140.62 | 0.045 | ||
| MRI | 140.28 | 0.042 | 0.24 | |
| CT | 140.08 | 0.041 | 0.38 | |
| 6. Infra-orbital foramina | ||||
| Anatomical | 55.81 | 0.008 | ||
| MRI | 56.19 | 0.042 | 0.68 | |
| CT | 56.83 | 0.534 | 1.82 | |
| 7. Piriform aperture height | ||||
| Anatomical | 32.35 | 0.024 | ||
| MRI | 32.39 | 0.038 | 0.12 | |
| CT | 32.96 | 0.042 | 1.89 | |
| 8. Piriform aperture width | ||||
| Anatomical | 21.54 | 0.041 | ||
| MRI | 22.25 | 0.038 | 3.30 | |
| CT | 21.75 | 0.039 | 0.97 | |
| 9. Mental foramina | ||||
| Anatomical | 44.47 | 0.042 | ||
| MRI | 43.61 | 0.032 | 1.93 | |
| CT | 44.78 | 0.050 | 0.70 | |
| 10. Intercondylar distance | ||||
| Anatomical | 110.13 | 0.073 | ||
| MRI | 110.40 | 0.086 | 0.25 | |
| CT | 110.93 | 0.037 | 0.73 | |
| 11. Maxilla with teeth | ||||
| Anatomical | 58.11 | 0.061 | ||
| MRI | 58.07 | 0.050 | 0.07 | |
| CT | 58.24 | 0.073 | 0.22 | |
| 12. Maxilla without teeth | ||||
| Anatomical | 40.54 | 0.025 | ||
| MRI | 40.70 | 0.051 | 0.39 | |
| CT | 40.57 | 0.033 | 0.07 | |
Discussion
The black bone imaging sequence provides improved soft-tissue/bone contrast by utilising a low flip angle to suppress both fat and water to obtain a uniform soft-tissue background. The ability to clearly identify bone is therefore optimised in areas where bone is enveloped within soft tissue, such as the mandibular region. The main limitation of the technique is imaging areas where bone abuts air, such as the craniofacial sinuses, since both air and bone return a low signal on these sequences, making distinction challenging.
The technique has been demonstrated as reliable, with good correlation with measurements obtained both from CT and direct anatomical dimensions. While a statistically significant difference was identified between the direct anatomical measurements and those on the black bone and CT sequences, these differences correlated to a discrepancy of less than 0.5 mm in all cases, corresponding to an average error of 0.76% (range 0.06–3.30%), similar to results obtained in CT analysis [11-13]. Errors are likely to have been compounded by the difficulties in obtaining perfectly correlated measurements on direct anatomical, CT and MRI. The greatest discrepancies were seen for distances between transected formina resulting from the obliquity of path and resultant transection on imaging. Measurement of the piriform aperture, in view of the transection of the steep nasal bones, also resulted in increased variability in measurement.
The greatest potential of the black bone sequence is in imaging benign conditions of the facial skeleton, since these are frequently necessary in young patient groups and on multiple occasions. This offers a valuable method of radiation dose constraint in such patients. We are exploring the clinical applications of this novel sequence and are currently further developing methods to create three-dimensional reformations which will further enhance the potential of this technique.
Conclusion
In conclusion, low flip angle imaging provides good soft-tissue-bone contrast, optimised at an angle of 5°. We continue to investigate the clinical benefit of this technique in our patients and our key areas of research are benign conditions affecting the craniofacial skeleton.
Acknowledgments
We would like to thank Mr Raed S Saeed, Department of Health Sciences, University of Kuwait, and Mr Chris M Alvey, Nuffield Department of Surgery, Oxford, for their initial work on this project. Funding was provided by the New Life Foundation and AO Foundation (Project numbers F-09-45W and C-09-01W).
References
- 1.Moseley I, Brant-Zawadski M, Mills C. Nuclear magnetic resonance imaging of the orbit. Br J Ophthalmol 1983;67:333–42 [DOI] [PMC free article] [PubMed] [Google Scholar]
- 2.Raissaki M, Perisinakis K, Damilakis J, Gourtsoyiannis N. Eye-lens bismuth shielding in paediatric head CT: artefact evaluation and reduction. Pediatr Radiol 2010;40:1748–54 [DOI] [PubMed] [Google Scholar]
- 3.Nievelstein RA, van Dam IM, van derMolen AJ. Multidetector CT in children: current concepts and dose reduction strategies. Pediatr Radiol 2010;40:1324–44 [DOI] [PMC free article] [PubMed] [Google Scholar]
- 4.Golding SJ. Radiation exposure in CT: what is the professionally responsible approach? Radiology 2010;255:683–6 [DOI] [PubMed] [Google Scholar]
- 5.Golding SJ. Multi-slice computed tomography (MSCT): the dose challenge of the new revolution. Radiat Prot Dosimetry 2005;114:303–7 [DOI] [PubMed] [Google Scholar]
- 6.Petrantonaki M, Maris T, Damilakis J. MRI techniques for the examination of trabecular bone structure. Cur Med Imaging Rev 2005;1:35–41 [Google Scholar]
- 7.Vanel D. MRI of bone metastases: the choice of the sequence. Cancer Imaging 2003;4:30–5 [DOI] [PMC free article] [PubMed] [Google Scholar]
- 8.Robson MD, Bydder GM. Clinical ultrashort echo time imaging of bone and other connective tissues. NMR Biomed 2006;19:765–80 [DOI] [PubMed] [Google Scholar]
- 9.Techawiboonwong A, Song HK, Leonard MB, Wehrli FW. Cortical bone water: in vivo quantification with ultrashort echo-time MR imaging. Radiology 2008;248:824–33 [DOI] [PMC free article] [PubMed] [Google Scholar]
- 10.Golding SJ, Saeed R, Alvey C, Evangelou I, McIntyre A, Watt-Smith S. Imaging cortical bone by MRI: a new approach to image-guided planning for reconstructive surgery of the face. European Congress of Radiology, ECR, Abstract. European Radiology Supplements 2005;15:1–688 [Google Scholar]
- 11.Waitzman AA, Posnick JC, Armstrong DC, Pron GE. Craniofacial skeletal measurements based on computed tomography: Part I. Accuracy and reproducibility. Cleft Palate Craniofac J 1992;29:112–7 [DOI] [PubMed] [Google Scholar]
- 12.Connor SEJ, Arscott T, Berry J, Greene L, Gorman RO. Precision and accuracy of low-dose CT protocols in the evaluation of skull landmarks. Dentomaxillofac Radiol 2007;36:270–6 [DOI] [PubMed] [Google Scholar]
- 13.Cavalcanti MGP, Rocha SS, Vannier MW. Craniofacial measurements based on 3D-CT volume rendering: implications for clinical applications. Dentomaxillofac Radiol 2004;33:170–6 [DOI] [PubMed] [Google Scholar]


